 RSS Feed
 by Calculated Risk on 2/16/2023 11:21:00 AM
Thursday, February 16, 2023
NY Fed Q4 Report: Household Debt Increases, Mortgage and Auto Loan Growth Slows
From the NY Fed: Total Household Debt Reaches $16.90 trillion in Q4 2022; Mortgage and Auto Loan Growth Slows
The Federal Reserve Bank of New York's Center for Microeconomic Data today issued its Quarterly Report on Household Debt and Credit. The Report shows an increase in total household debt in the fourth quarter of 2022, increasing by $394 billion (2.4%) to $16.90 trillion. Balances now stand $2.75 trillion higher than at the end of 2019, before the pandemic recession. The report is based on data from the New York Fed's nationally representative Consumer Credit Panel.
Mortgage balances rose by $254 billion in the fourth quarter of 2022 and stood at $11.92 trillion at the end of December, marking a nearly $1 trillion increase in mortgage balances in 2022.
Credit card balances increased $61 billion in the fourth quarter to $986 billion, surpassing the pre-pandemic high of $927 billion. Auto loan balances increased by $28 billion in the fourth quarter, consistent with the upward trajectory seen since 2011. Student loan balances now stand at $1.60 trillion, up by $21 billion from the previous quarter. In total, non-housing balances grew by $126 billion.
Mortgage originations, which include refinances, fell to $498 billion in the fourth quarter, representing a return to lower levels last seen in 2019. The volume of newly originated auto loans was $186 billion, representing a slight increase from the previous quarter. Aggregate limits on credit card accounts increased by $88 billion in the fourth quarter and now stand at $4.4 trillion.
The share of current debt becoming delinquent increased again in the fourth quarter for nearly all debt types, following two years of historically low delinquency transitions. The delinquency transition rate for credit cards and auto loans increased by 0.6 and 0.4 percentage points, respectively.
"Credit card balances grew robustly in the 4th quarter, while mortgage and auto loan balances grew at a more moderate pace, reflecting activity consistent with pre-pandemic levels," said Wilbert van der Klaauw, economic research advisor at the New York Fed. "Although historically low unemployment has kept consumer's financial footing generally strong, stubbornly high prices and climbing interest rates may be testing some borrowers' ability to repay their debts."
emphasis added
 Click on graph for larger image.
Here are three graphs from the report:
The first graph shows aggregate consumer debt increased in Q4. Household debt previously peaked in 2008 and bottomed in Q3 2013. Unlike following the great recession, there wasn't a decline in debt during the pandemic.
From the NY Fed:
Aggregate household debt balances increased by $394 billion in the fourth quarter of 2022, a 2.4% rise from 2022Q3. Balances now stand at $16.90 trillion and have increased by $2.75 trillion since the end of 2019, just before the pandemic recession.
 The second graph shows the percent of debt in delinquency.
The overall delinquency rate decreased in Q4. From the NY Fed:
Aggregate delinquency rates decreased in the fourth quarter of 2022 and remained low, after declining sharply through the beginning of the pandemic, although there has been some shift in the composition, with increases in the share of balances that are 30- 59 days past due and declines in seriously delinquent balances. As of December, 2.5% of outstanding debt was in some stage of delinquency, 2.2 percentage points lower than last quarter of 2019, just before the COVID-19 pandemic hit the United States.
 The third graph shows Mortgage Originations by Credit Score.
From the NY Fed:
Mortgage originations, measured as appearances of new mortgages on consumer credit reports, declined to $498 billion in 2022Q4, back to the lower levels seen in 2019. ... The median credit score of newly originated mortgages declined again, to 766, down from a series high in 2021Q1 of 788 and returning to pre-covid levels which remain very high and reflect continuing high lending standards. The median credit score on newly originated auto loans was down slightly, to 711, but remained about level with the past two years.There is much more in the report.
January Housing Starts: Near Record Number of Housing Units Under Construction
by Calculated Risk on 2/16/2023 09:26:00 AM
Today, in the CalculatedRisk Real Estate Newsletter: January Housing Starts: Near Record Number of Housing Units Under Construction
Excerpt:
Possibly Important: Multi-family permits averaged 547,000 SAAR over the last three months after averaging close to 650,000 SAAR over the previous 8 months. This decline in permits is a possible signal that the expected decline in multi-family starts has begun (although permits aren’t a perfect leading indicator for starts).There is much more in the post. You can subscribe at https://calculatedrisk.substack.com/
...
The fourth graph shows housing starts under construction, Seasonally Adjusted (SA).
Red is single family units. Currently there are 752 thousand single family units (red) under construction (SA). This was down in January compared to December, and 76 thousand below the recent peak in April and May 2022. Single family units under construction have peaked since single family starts are now declining. The reason there are still so many homes under construction is probably due to supply constrain
Blue is for 2+ units. Currently there are 948 thousand multi-family units under construction. This is the highest level since November 1973! For multi-family, construction delays are probably also a factor. The completion of these units should help with rent pressure.
Combined, there are 1.700 million units under construction, just below the all-time record of 1.711 million set in October 2022.
...
The weakness in 2022 was mostly for single family starts; however, it appears the expected decline in multi-family starts has begun.

Housing Starts Decreased to 1.309 million Annual Rate in January
by Calculated Risk on 2/16/2023 08:42:00 AM
From the Census Bureau: Permits, Starts and Completions
Housing Starts:
Privately‐owned housing starts in January were at a seasonally adjusted annual rate of 1,309,000. This is 4.5 percent below the revised December estimate of 1,371,000 and is 21.4 percent below the January 2022 rate of 1,666,000. Single‐family housing starts in January were at a rate of 841,000; this is 4.3 percent below the revised December figure of 879,000. The January rate for units in buildings with five units or more was 457,000.
Building Permits:
Privately‐owned housing units authorized by building permits in January were at a seasonally adjusted annual rate of 1,339,000. This is 0.1 percent above the revised December rate of 1,337,000, but is 27.3 percent below the January 2022 rate of 1,841,000. Single‐family authorizations in January were at a rate of 718,000; this is 1.8 percent below the revised December figure of 731,000. Authorizations of units in buildings with five units or more were at a rate of 563,000 in January
emphasis added
 Click on graph for larger image.
The first graph shows single and multi-family housing starts for the last several years.
Multi-family starts (blue, 2+ units) decreased in January compared to December. Multi-family starts were down 8.1% year-over-year in January.
Single-family starts (red) decreased in January and were down 27.3% year-over-year.
 The second graph shows single and multi-family housing starts since 1968.
 This shows the huge collapse following the housing bubble, and then the eventual recovery - and the recent collapse in single-family starts.
Total housing starts in January were below expectations, however, starts in November and December were revised up slightly, combined.
I'll have more later …
Weekly Initial Unemployment Claims decrease to 194,000
by Calculated Risk on 2/16/2023 08:30:00 AM
The DOL reported:
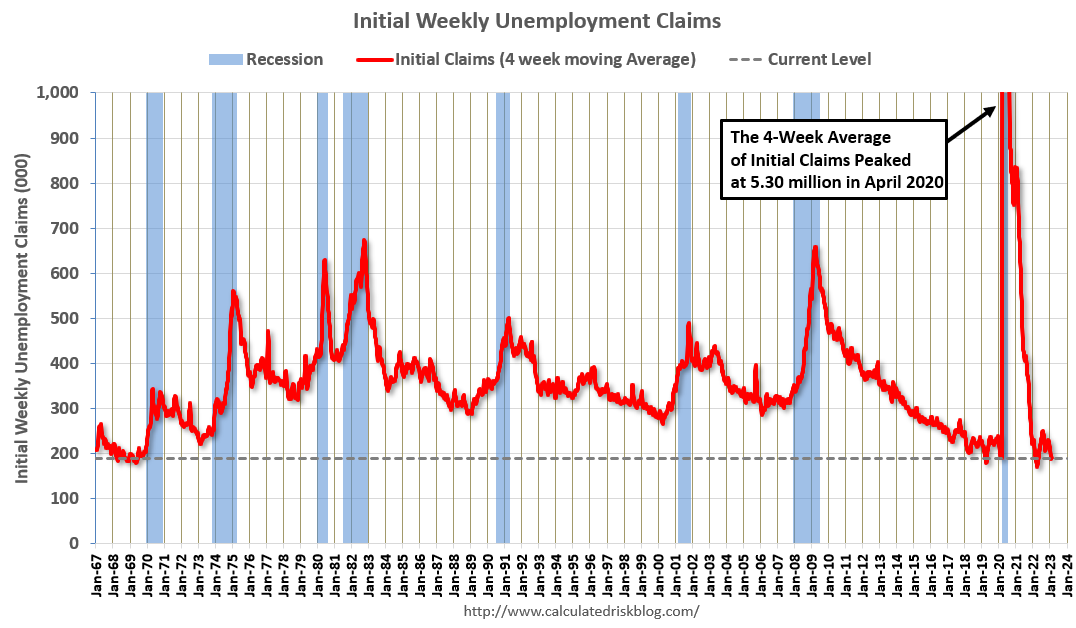
In the week ending February 11, the advance figure for seasonally adjusted initial claims was 194,000, a decrease of 1,000 from the previous week's revised level. The previous week's level was revised down by 1,000 from 196,000 to 195,000. The 4-week moving average was 189,500, an increase of 500 from the previous week's revised average. The previous week's average was revised down by 250 from 189,250 to 189,000.The following graph shows the 4-week moving average of weekly claims since 1971.
emphasis added
 Click on graph for larger image.
The dashed line on the graph is the current 4-week average. The four-week average of weekly unemployment claims increased to 189,500.
The previous week was revised down.
Weekly claims were below the consensus forecast.
Wednesday, February 15, 2023
Thursday: Housing Starts, Unemployment Claims, PPI, Philly Fed Mfg, NY Fed Household Debt and Credit
by Calculated Risk on 2/15/2023 08:53:00 PM
 Note: Mortgage rates are from MortgageNewsDaily.com and are for top tier scenarios.
Thursday:
• At 8:30 AM ET, The initial weekly unemployment claims report will be released. The consensus is for 200 thousand initial claims, up from 196 thousand last week.
• Also at 8:30 AM, Housing Starts for January. The consensus is for 1.361 million SAAR, down from 1.382 million SAAR.
• Also at 8:30 AM, The Producer Price Index for December from the BLS. The consensus is for a 0.4% increase in PPI, and a 0.3% increase in core PPI.
• Also at 8:30 AM, the Philly Fed manufacturing survey for February. The consensus is for a reading of -6.7, up from -8.9.
• At 11:00 AM, NY Fed: Q4 Quarterly Report on Household Debt and Credit
Update: Some "Good News" for Homebuilders
by Calculated Risk on 2/15/2023 12:39:00 PM
Today, in the Calculated Risk Real Estate Newsletter: Update: Some "Good News" for Homebuilders
A brief excerpt:
Last October I wrote: Some "Good News" for HomebuildersThere is much more in the article. You can subscribe at https://calculatedrisk.substack.com/
I noted:Even though we can expect significant further declines in new home sales and single-family housing starts, the good news for the homebuilders is activity usually picks up quickly following an interest rate induced slowdown (as opposed to following the housing bust when the recovery took many years).I included the following graph to illustrate this point. The following graph shows new home sales for three periods: 1978-1982, 2005-2020, and current (red). The prior peak in sales is set to 100 (updated through the December New Home sales release).
...
My sense is this downturn will have some similarities to the 1980 period, see: Housing: Don't Compare the Current Housing Boom to the Bubble and Bust

NAHB: Builder Confidence Increased in February
by Calculated Risk on 2/15/2023 10:07:00 AM
The National Association of Home Builders (NAHB) reported the housing market index (HMI) was at 42, up from 35 last month. Any number below 50 indicates that more builders view sales conditions as poor than good.
From the NAHB: Cautious Optimism for Builders in February
Two consecutive solid monthly gains for builder confidence, spurred in part by easing mortgage rates, signal that the housing market may be turning a corner even as builders continue to contend with high construction costs and building material supply chain logjams. Builder confidence in the market for newly built single-family homes in February rose seven points to 42, according to the National Association of Home Builders (NAHB)/Wells Fargo Housing Market Index (HMI) released today. This is the strongest reading since September of last year.
...
“While the HMI remains below the breakeven level of 50, the increase from 31 to 42 from December to February is a positive sign for the market,” said NAHB Chief Economist Robert Dietz. “Even as the Federal Reserve continues to tighten monetary policy conditions, forecasts indicate that the housing market has passed peak mortgage rates for this cycle. And while we expect ongoing volatility for mortgage rates and housing costs, the building market should be able to achieve stability in the coming months, followed by a rebound back to trend home construction levels later in 2023 and the beginning of 2024.”And while builders continue to offer a variety of incentives to attract buyers during this housing downturn, recent data indicate that the housing market is showing signs of stabilizing off a cyclical low:
• 31% of builders reduced home prices in February, down from 35% in December and 36% in November.
• The average price drop in February was 6%, down from 8% in December, and tied with 6% in November.
• 57% offered some kind of incentive in February, down from 62% in December and 59% in November.
...
All three HMI indices posted gains for the second consecutive month. The HMI index gauging current sales conditions in February rose six points to 46, the component charting sales expectations in the next six months increased 11 points to 48 and the gauge measuring traffic of prospective buyers increased six points to 29.
Looking at the three-month moving averages for regional HMI scores, the Northeast rose four points to 37, the Midwest edged one-point higher to 33, the South increased four points to 40 and the West moved three points higher to 30
emphasis added
 Click on graph for larger image.
This graph shows the NAHB index since Jan 1985.
This was above the consensus forecast.
The "traffic of prospective buyers" is still well below breakeven at 29 (below 50).
Industrial Production Unchanged in January
by Calculated Risk on 2/15/2023 09:22:00 AM
From the Fed: Industrial Production and Capacity Utilization
Industrial production was unchanged in January after falling 0.6 percent and 1.0 percent in November and December, respectively. In January, manufacturing output moved up 1.0 percent and mining output rose 2.0 percent following two months with substantial decreases for each sector. The output of utilities fell 9.9 percent in January, as a swing from unseasonably cool weather in December to unseasonably warm weather in January depressed the demand for heating. At 103.0 percent of its 2017 average, total industrial production in January was 0.8 percent above its year-earlier level. Capacity utilization declined 0.1 percentage point in January to 78.3 percent, a rate that is 1.3 percentage points below its long-run (1972–2022) average.
emphasis added
 Click on graph for larger image.
This graph shows Capacity Utilization. This series is up from the record low set in April 2020, and above the level in February 2020 (pre-pandemic).
Capacity utilization at 78.3% is 1.3% below the average from 1972 to 2021. This was below consensus expectations.
Note: y-axis doesn't start at zero to better show the change.
 The second graph shows industrial production since 1967.
Industrial production increased slightly in January to 103.0. This is above the pre-pandemic level.
The change in industrial production was below consensus expectations.
Retail Sales Increased 3.0% in January
by Calculated Risk on 2/15/2023 08:39:00 AM
On a monthly basis, retail sales were up 3.0% from December to January (seasonally adjusted), and sales were up 6.4 percent from January 2022.
From the Census Bureau report:
Advance estimates of U.S. retail and food services sales for January 2023, adjusted for seasonal variation and holiday and trading-day differences, but not for price changes, were $697.0 billion, up 3.0 percent from the previous month, and up 6.4 percent above January 2022.
emphasis added
 Click on graph for larger image.
This graph shows retail sales since 1992. This is monthly retail sales and food service, seasonally adjusted (total and ex-gasoline).
Retail sales ex-gasoline were up 3.2% in January.
The second graph shows the year-over-year change in retail sales and food service (ex-gasoline) since 1993.
Retail and Food service sales, ex-gasoline, increased by 6.8% on a YoY basis.
 Sales in January were well above expectations, however, sales in November and December were revised down, combined.
MBA: Mortgage Applications Decreased in Latest Weekly Survey
by Calculated Risk on 2/15/2023 07:00:00 AM
From the MBA: Mortgage Applications Decrease in Latest MBA Weekly Survey
Mortgage applications decreased 7.7 percent from one week earlier, according to data from the Mortgage Bankers Association’s (MBA) Weekly Mortgage Applications Survey for the week ending February 10, 2023.
... The Refinance Index decreased 13 percent from the previous week and was 76 percent lower than the same week one year ago. The seasonally adjusted Purchase Index decreased 6 percent from one week earlier. The unadjusted Purchase Index decreased 5 percent compared with the previous week and was 43 percent lower than the same week one year ago.
“Mortgage rates increased across the board last week, pushed higher by market expectations that inflation will persist, thus requiring the Federal Reserve to keep monetary policy restrictive for a longer time. After five straight weeks of decreases, the 30-year fixed rate increased by 21 basis points to 6.39 percent,” said Joel Kan, MBA’s Vice President and Deputy Chief Economist. “Mortgage applications decreased for the second time in three weeks because of these higher rates. Refinance borrowers, both rate/term and cash-out, remain on the sidelines as current rates provide little financial incentive to act.”
Added Kan, “Purchase applications dropped to their lowest level since the beginning of this year and were more than 40 percent lower than a year ago. Potential buyers remain quite sensitive to the current level of mortgage rates, which are more than two percentage points above last year’s levels and have significantly reduced buyers’ purchasing power.”
...
The average contract interest rate for 30-year fixed-rate mortgages with conforming loan balances ($726,200 or less) increased to 6.39 percent from 6.18 percent, with points increasing to 0.70 from 0.64 (including the origination fee) for 80 percent loan-to-value ratio (LTV) loans.
emphasis added
 Click on graph for larger image.
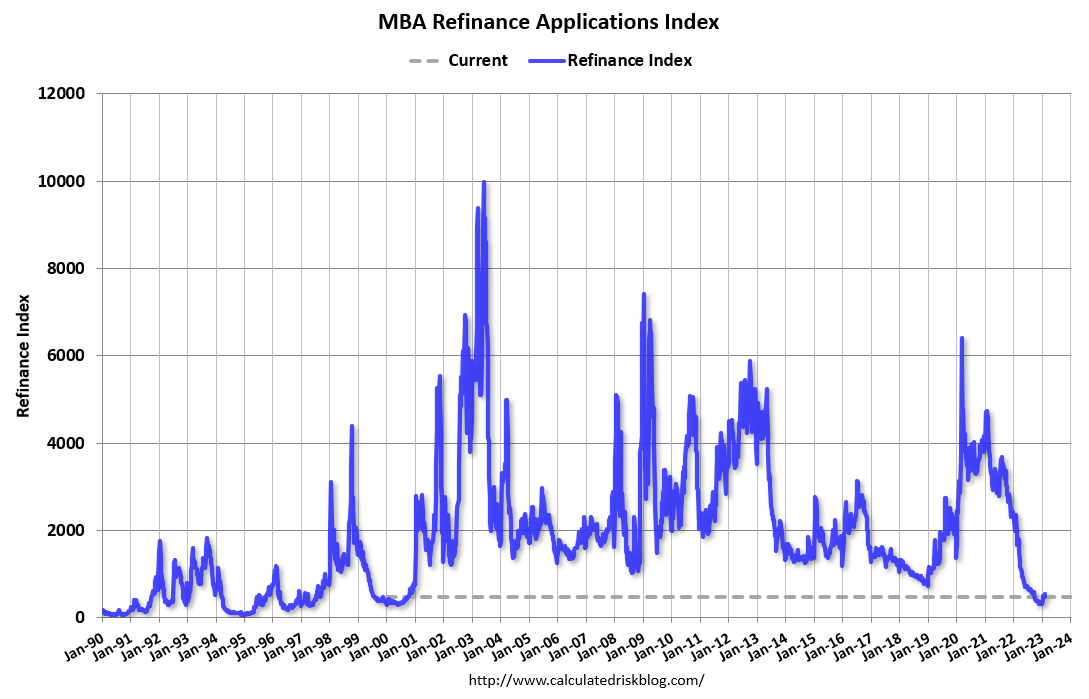
The first graph shows the refinance index since 1990.
With higher mortgage rates, the refinance index declined sharply in 2022.
Five weeks ago, the refinance index was at the lowest level since the year 2000, but it has rebounded somewhat as rates declined.
The second graph shows the MBA mortgage purchase index.
 According to the MBA, purchase activity is down 43% year-over-year unadjusted. This has increased a little with lower rates but is still near housing bust levels.
Note: Red is a four-week average (blue is weekly).


