 RSS Feed
 by Calculated Risk on 2/11/2023 08:11:00 AM
Saturday, February 11, 2023
Schedule for Week of February 12, 2023
The key reports this week are January CPI, Housing Starts, and Retail sales.
For manufacturing, the January Industrial Production report, and the February NY and Philly Fed manufacturing surveys will be released this week.
No major economic releases scheduled.
6:00 AM: NFIB Small Business Optimism Index for January.
8:30 AM: The Consumer Price Index for January from the BLS. The consensus is for 0.5% increase in CPI, and a 0.4% increase in core CPI. The consensus is for CPI to be up 6.2% year-over-year and core CPI to be up 5.5% YoY.
7:00 AM ET: The Mortgage Bankers Association (MBA) will release the results for the mortgage purchase applications index.
 8:30 AM: Retail sales for January is scheduled to be released. The consensus is for a 1.5% increase in retail sales.
This graph shows retail sales since 1992. This is monthly retail sales and food service, seasonally adjusted (total and ex-gasoline).
8:30 AM: The New York Fed Empire State manufacturing survey for February. The consensus is for a reading of -20.0, up from -32.9.
 9:15 AM: The Fed will release Industrial Production and Capacity Utilization for January.
This graph shows industrial production since 1967.
The consensus is for a 0.5% increase in Industrial Production, and for Capacity Utilization to increase to 79.1%.
10:00 AM: The February NAHB homebuilder survey. The consensus is for a reading of 37, up from 35. Any number below 50 indicates that more builders view sales conditions as poor than good.
8:30 AM: The initial weekly unemployment claims report will be released. The consensus is for 200 thousand initial claims, up from 196 thousand last week.
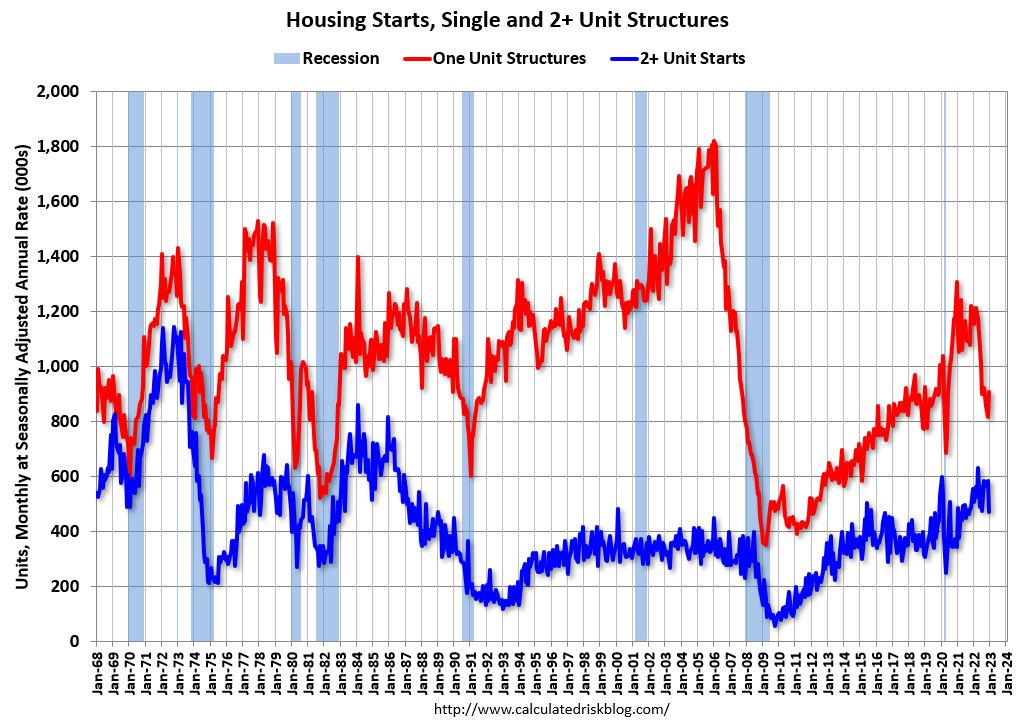 8:30 AM: Housing Starts for January.
 This graph shows single and multi-family housing starts since 1968.
The consensus is for 1.361 million SAAR, down from 1.382 million SAAR.
8:30 AM ET: The Producer Price Index for December from the BLS. The consensus is for a 0.4% increase in PPI, and a 0.3% increase in core PPI.
8:30 AM: the Philly Fed manufacturing survey for February. The consensus is for a reading of -6.7, up from -8.9.
11:00 AM: NY Fed: Q4 Quarterly Report on Household Debt and Credit
No major economic releases scheduled.
Friday, February 10, 2023
COVID Feb 10, 2023: Update on Cases, Hospitalizations and Deaths
by Calculated Risk on 2/10/2023 08:44:00 PM
 Note: Mortgage rates are from MortgageNewsDaily.com and are for top tier scenarios.
On COVID (focus on hospitalizations and deaths). Data is now weekly.
| COVID Metrics | ||||
|---|---|---|---|---|
| Now | Week Ago | Goal | ||
| New Cases per Week2 | 282,827 | 285,702 | ≤35,0001 | |
| Hospitalized2 | 23,420 | 26,029 | ≤3,0001 | |
| Deaths per Week2 | 3,171 | 3,513 | ≤3501 | |
| 1my goals to stop weekly posts, 2Weekly for Cases, Currently Hospitalized, and Deaths 🚩 Increasing number weekly for Cases, Hospitalized, and Deaths ✅ Goal met. | ||||
 Click on graph for larger image.
This graph shows the weekly (columns) number of deaths reported.
January was the worst month for the previous two years, and January 2023 saw a much smaller increase in deaths.
Early Q1 GDP Tracking
by Calculated Risk on 2/10/2023 12:45:00 PM
It is very early in the quarter and some tracking estimates will start next week. It looks like Q4 GDP will be revised up in the second estimate to be released on February 23rd.
From BofA:
Data released since our last weekly lowered our 4Q tracking estimate by 0.1ppt to 3.2% q/q saar. ... Looking ahead to next week, we will start our tracker for 1Q US GDP with the January retail sales report. In addition, we will incorporate December business inventories, January housing starts and permits, CPI, PPI, and import prices into our 4Q and 1Q tracking estimates. [Feb 10th]From Goldman:
emphasis added
We boosted our Q1 GDP tracking estimate by 0.4pp to +0.8% (qoq ar). We left our past-quarter GDP tracking estimate for Q4 unchanged on a rounded basis at +3.2%, compared to +2.9% as originally reported. [Feb 7th estimate]And from the Altanta Fed: GDPNow
The GDPNow model estimate for real GDP growth (seasonally adjusted annual rate) in the first quarter of 2023 is 2.2 percent on February 8, up from 2.1 percent on February 7. [Feb 8th estimate]
Net Immigration and Household Formation
by Calculated Risk on 2/10/2023 10:10:00 AM
Today, in the Calculated Risk Real Estate Newsletter:
Net Immigration and Household Formation
An excerpt:
A key theme has been that household formation surged during the pandemic and has slowed recently. This surge in household formation increased demand for homeownership and for rental units - pushing up both house prices and rents.There is more in the article. You can subscribe at https://calculatedrisk.substack.com/
The recent slowdown in household formation has lowered demand, and we are already seeing this with falling asking rents.
This brief note provides an update on immigration.
Trends in Educational Attainment in the U.S. Labor Force
by Calculated Risk on 2/10/2023 08:43:00 AM
The first graph shows the unemployment rate by four levels of education (all groups are 25 years and older) through January 2023. Note: This is an update to a post from a few years ago.
Unfortunately, this data only goes back to 1992 and includes only three recessions (the stock / tech bust in 2001, and the housing bust/financial crisis, and the 2020 pandemic). Clearly education matters with regards to the unemployment rate, with the lowest rate for college graduates at 2.0% in January, and highest for those without a high school degree at 4.5% in January.
All four groups were generally trending down prior to the pandemic. And all are close to pre-pandemic levels now.
 Click on graph for larger image.
Note: This says nothing about the quality of jobs - as an example, a college graduate working at minimum wage would be considered "employed".
This brings up an interesting question: What is the composition of the labor force by educational attainment, and how has that been changing over time?
Here is some data on the U.S. labor force by educational attainment since 1992.
 Currently, almost 63 million people in the U.S. labor force have a bachelor's degree or higher. This is almost 44% of the labor force, up from 26.2% in 1992.
This is the only category trending up. "Some college" has been steady (and trending down lately), and both "high school" and "less than high school" have been trending down.
Based on current trends, probably half the labor force will have at least a bachelor's degree sometime next decade (2030s).
Some thoughts: Since workers with bachelor's degrees typically have a lower unemployment rate, rising educational attainment is probably a factor in pushing down the overall unemployment rate over time.
Also, I'd guess more education would mean less labor turnover, and that education is a factor in lower weekly claims.
A more educated labor force is a positive for the future.
Thursday, February 09, 2023
Realtor.com Reports Weekly Active Inventory Up 70% YoY; New Listings Down 11% YoY
by Calculated Risk on 2/09/2023 03:56:00 PM
Realtor.com has monthly and weekly data on the existing home market. Here is their weekly report released today from Chief Economist Danielle Hale: Weekly Housing Trends View — Data Week Ending Feb 4, 2023
• Active inventory growth continued to climb with for-sale homes up 70% above one year ago. Inventories of for-sale homes rose again, but climbed at a slightly slower yearly pace than last week.
...
• New listings–a measure of sellers putting homes up for sale–were again down, this week by 11% from one year ago. For 31 weeks now, fewer homeowners put their homes on the market for sale than at this time last year. After smaller declines in the first few weeks of the year, the gap has widened for a second week. High costs and mortgage rates can significantly up the ante for homeowners hoping to trade-up and remain in their current area.
 Here is a graph of the year-over-year change in inventory according to realtor.com. NOTE: The release says active inventory is up 70% YoY, but the data shows up 79% (graph based on data).
In early 2022, inventory was declining rapidly, so the year-over-year change is up sharply.
An interesting note this week is that new listings were only down 11% from a year ago. This is a significant change from December when new listings were down 21% year-over-year according to Realtor.com, and down 21.5% in the local markets I track. Something to watch!
Energy expenditures as a percentage of PCE
by Calculated Risk on 2/09/2023 02:11:00 PM
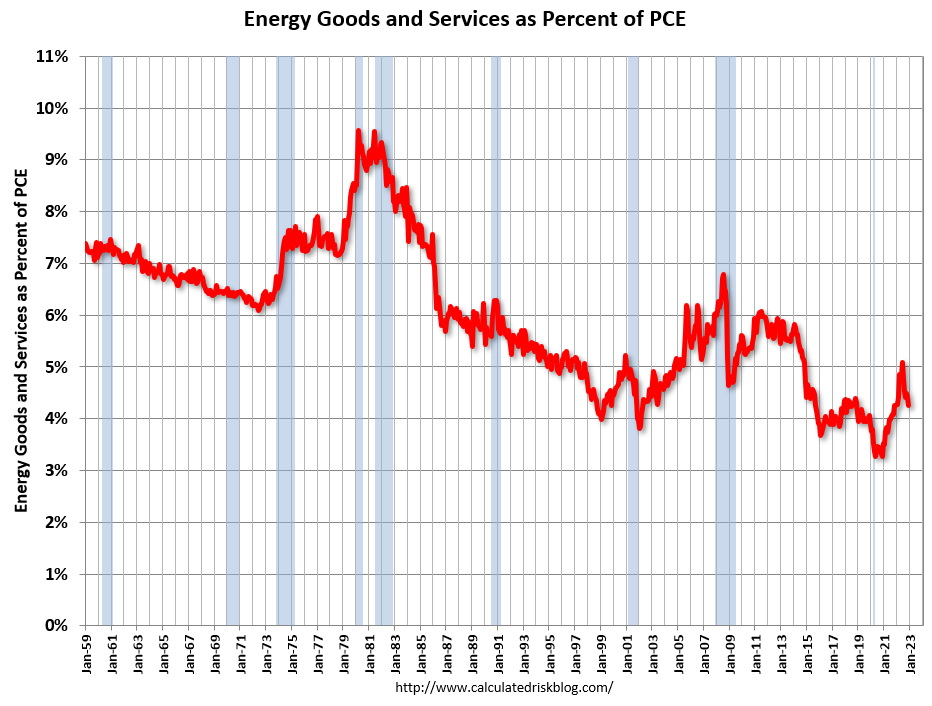
During the early stages of the pandemic, energy expenditures as a percentage of PCE hit an all-time low of 3.3% of PCE. Then energy expenditures increased to 2018 levels by the end of 2021.
With the invasion of Ukraine, energy expenditures as a percentage of PCE increased further in 2022.
Here is an update through the December 2022 PCE report.
This graph shows expenditures on energy goods and services as a percent of total personal consumption expenditures. This is one of the measures that Professor Hamilton at Econbrowser looks at to evaluate any drag on GDP from energy prices.

Click on graph for larger image.
Data source: BEA.
In general, energy expenditures as a percent of PCE has been trending down for decades. The huge spikes in energy prices during the oil crisis of 1973 and 1979 are obvious. As is the increase in energy prices during the 2001 through 2008 period.
This graph shows expenditures on energy goods and services as a percent of total personal consumption expenditures. This is one of the measures that Professor Hamilton at Econbrowser looks at to evaluate any drag on GDP from energy prices.
Click on graph for larger image.
Data source: BEA.
In general, energy expenditures as a percent of PCE has been trending down for decades. The huge spikes in energy prices during the oil crisis of 1973 and 1979 are obvious. As is the increase in energy prices during the 2001 through 2008 period.
In December 2022, energy expenditures as a percentage of PCE were at 4.3% of PCE, down from 4.4% in November, and down from the recent peak of 5.1% in June 2022.
This is still above the pre-pandemic level of around 3.8% of PCE.
Hotels: Occupancy Rate Down 7.3% Compared to Same Week in 2019
by Calculated Risk on 2/09/2023 11:29:00 AM
From CoStar: STR: Weekly US Hotel Occupancy Hovers Around 55%
U.S. hotel performance fell slightly from the previous week, according to STR‘s latest data through Feb. 4.The following graph shows the seasonal pattern for the hotel occupancy rate using the four-week average.
Jan. 29 to Feb. 4, 2023 (percentage change from comparable week in 2019*):
• Occupancy: 55.3% (-7.3%)
• Average daily rate (ADR): $145.35 (+13.9%)
• Revenue per available room (RevPAR): $80.45 (+5.6%)
*Due to the pandemic impact, STR is measuring recovery against comparable time periods from 2019. Year-over-year comparisons will once again become standard after Q1.
emphasis added
 Click on graph for larger image.
The red line is for 2023, black is 2020, blue is the median, and dashed light blue is for 2022. Dashed purple is 2019 (STR is comparing to a strong year for hotels).
The 4-week average of the occupancy rate is at the median rate for the previous 20 years (Blue).
Note: Y-axis doesn't start at zero to better show the seasonal change.
The 4-week average of the occupancy rate will increase seasonally over the next few months.
Weekly Initial Unemployment Claims increase to 196,000
by Calculated Risk on 2/09/2023 08:33:00 AM
The DOL reported:
In the week ending February 4, the advance figure for seasonally adjusted initial claims was 196,000, an increase of 13,000 from the previous week's unrevised level of 183,000. The 4-week moving average was 189,250, a decrease of 2,500 from the previous week's unrevised average of 191,750.The following graph shows the 4-week moving average of weekly claims since 1971.
emphasis added
 Click on graph for larger image.
The dashed line on the graph is the current 4-week average. The four-week average of weekly unemployment claims decreased to 189,250.
The previous week was unrevised.
Weekly claims were close to the consensus forecast.
Wednesday, February 08, 2023
Thursday: Unemployment Claims
by Calculated Risk on 2/08/2023 08:12:00 PM
 Note: Mortgage rates are from MortgageNewsDaily.com and are for top tier scenarios.
Thursday:
• At 8:30 AM: The initial weekly unemployment claims report will be released. The consensus is for 194 thousand initial claims, up from 183 thousand last week.


