 RSS Feed
 by Calculated Risk on 12/04/2022 11:38:00 AM
Sunday, December 04, 2022
Heavy Truck Sales Up 11% Year-over-year
The BEA released their estimate of vehicle sales for November on Friday.
This graph shows heavy truck sales since 1967 using data from the BEA. The dashed line is the November 2022 seasonally adjusted annual sales rate (SAAR).
Heavy truck sales really collapsed during the great recession, falling to a low of 180 thousand SAAR in May 2009. Then heavy truck sales increased to a new all-time high of 570 thousand SAAR in April 2019.
 Click on graph for larger image.
Note: "Heavy trucks - trucks more than 14,000 pounds gross vehicle weight."
Heavy truck sales declined sharply at the beginning of the pandemic, falling to a low of 308 thousand SAAR in May 2020.
Heavy truck sales were at 489 thousand SAAR in November, down from 492 thousand in October, and up 11.4% from 439 thousand SAAR in November 2021.
Usually, heavy truck sales decline sharply prior to a recession. Sales were solid in November.
Saturday, December 03, 2022
Real Estate Newsletter Articles this Week: Inflation Adjusted House Prices 3.3% Below Peak
by Calculated Risk on 12/03/2022 02:11:00 PM
At the Calculated Risk Real Estate Newsletter this week:
• Inflation Adjusted House Prices 3.3% Below Peak
• Rents Falling Faster than "Seasonality Alone"
• FHFA Announces Baseline Conforming Loan Limit Will Increase to $726,200
• Case-Shiller: National House Price Index "Continued to Decline" to 10.6% year-over-year increase in September
• Join the CalculatedRisk subscriber chat
This is usually published 4 to 6 times a week and provides more in-depth analysis of the housing market.
You can subscribe at https://calculatedrisk.substack.com/
Most content is available for free (and no Ads), but please subscribe!
Schedule for Week of December 4, 2022
by Calculated Risk on 12/03/2022 08:11:00 AM
The key economic report this week is the October trade deficit.
10:00 AM: the ISM Services Index for November.
8:00 AM: Corelogic House Price index for October.
 8:30 AM: Trade Balance report for October from the Census Bureau.
 This graph shows the U.S. trade deficit, with and without petroleum, through the most recent report. The blue line is the total deficit, and the black line is the petroleum deficit, and the red line is the trade deficit ex-petroleum products.
The consensus is the trade deficit to be $79.1 billion. The U.S. trade deficit was at $73.3 billion in September.
7:00 AM ET: The Mortgage Bankers Association (MBA) will release the results for the mortgage purchase applications index.
8:30 AM: The initial weekly unemployment claims report will be released. The consensus is for 230 thousand initial claims, up from 225 thousand last week.
8:30 AM: The Producer Price Index for November from the BLS. The consensus is for a 0.3% increase in PPI, and a 0.2% increase in core PPI.
12:00 PM: Q3 Flow of Funds Accounts of the United States from the Federal Reserve.
10:00 AM: University of Michigan's Consumer sentiment index (Preliminary for December).
Friday, December 02, 2022
COVID Dec 2, 2022: Update on Cases, Hospitalizations and Deaths
by Calculated Risk on 12/02/2022 08:46:00 PM
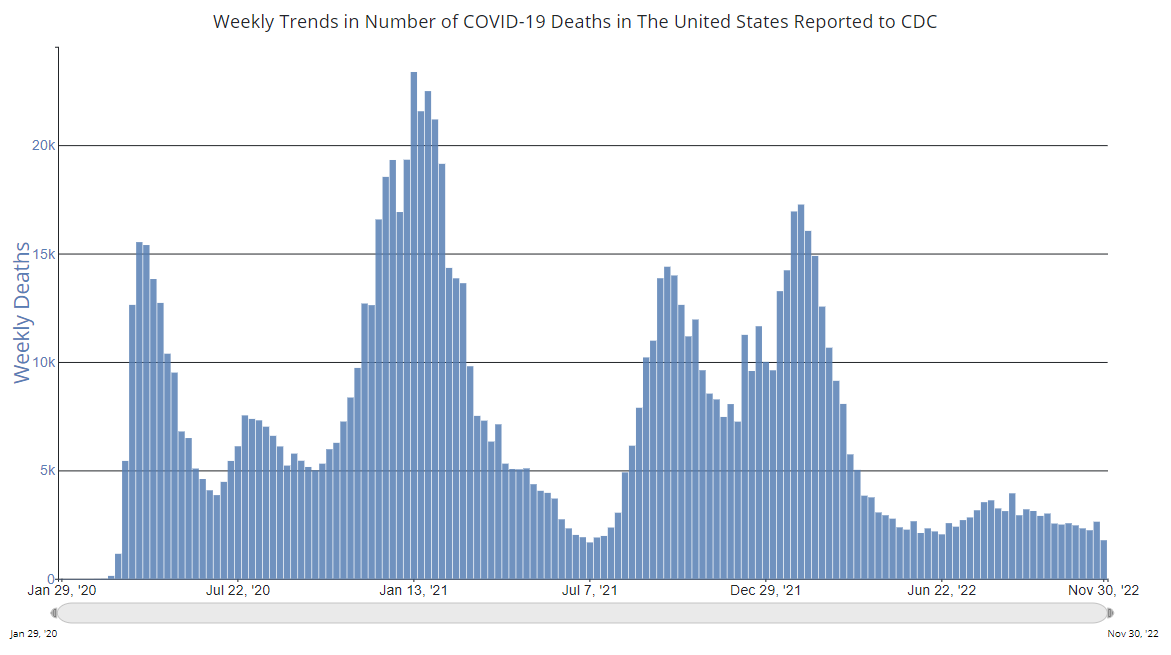
NOTE: This was a holiday week, and cases and deaths reporting always declines during holiday weeks.
On COVID (focus on hospitalizations and deaths). Data has switched to weekly.
| COVID Metrics | ||||
|---|---|---|---|---|
| Now | Week Ago | Goal | ||
| New Cases per Week2 | 303,101 | 306,856 | ≤35,0001 | |
| Hospitalized2🚩 | 25,603 | 22,011 | ≤3,0001 | |
| Deaths per Week2 | 1,780 | 2,634 | ≤3501 | |
| 1my goals to stop weekly posts, 2Weekly for Cases, Currently Hospitalized, and Deaths 🚩 Increasing number weekly for Cases, Hospitalized, and Deaths ✅ Goal met. | ||||
 Click on graph for larger image.
This graph shows the weekly (columns) number of deaths reported.
Hotels: Occupancy Rate Down 0.5% Compared to Same Week in 2019
by Calculated Risk on 12/02/2022 03:09:00 PM
Due to the Thanksgiving holiday, U.S. hotel performance came in lower than the previous week and showed mixed comparisons to 2019, according to STR‘s latest data through Nov. 26.The following graph shows the seasonal pattern for the hotel occupancy rate using the four-week average.
Nov. 20-26, 2022 (percentage change from comparable week in 2019*
• Occupancy: 50.4% (-0.5%)
• Average daily rate (ADR): US$135.49 (+20.4%)
• Revenue per available room (RevPAR): US$68.27 (+19.9%)
*Due to the pandemic impact, STR is measuring recovery against comparable time periods from 2019.
emphasis added
 Click on graph for larger image.
The red line is for 2022, black is 2020, blue is the median, and dashed light blue is for 2021. Dashed purple is 2019 (STR is comparing to a strong year for hotels).
The 4-week average of the occupancy rate is above the median rate for the previous 20 years (Blue) and close to 2019 levels.
Note: Y-axis doesn't start at zero to better show the seasonal change.
The 4-week average of the occupancy rate continue to decline into the Winter.
Realtor.com Reports Weekly Active Inventory Up 53% Year-over-year; New Listings Down 17%
by Calculated Risk on 12/02/2022 01:44:00 PM
Realtor.com has monthly and weekly data on the existing home market. Here is their weekly report released today from Chief Economist Danielle Hale: Weekly Housing Trends View — Data Week Ending Nov 26, 2022. Note: They have data on list prices, new listings and more, but this focus is on inventory.
• Active inventory continued to grow, increasing 53% above one year ago. Inventory accelerated again, notching a seventh week in a row with yearly trend growth roughly at or above 2% higher than the previous week.
...
• New listings–a measure of sellers putting homes up for sale–were again down, dropping 17% from one year ago. This marks the twenty-first consecutive week of year-over-year declines in homeowners listing their home for sale.
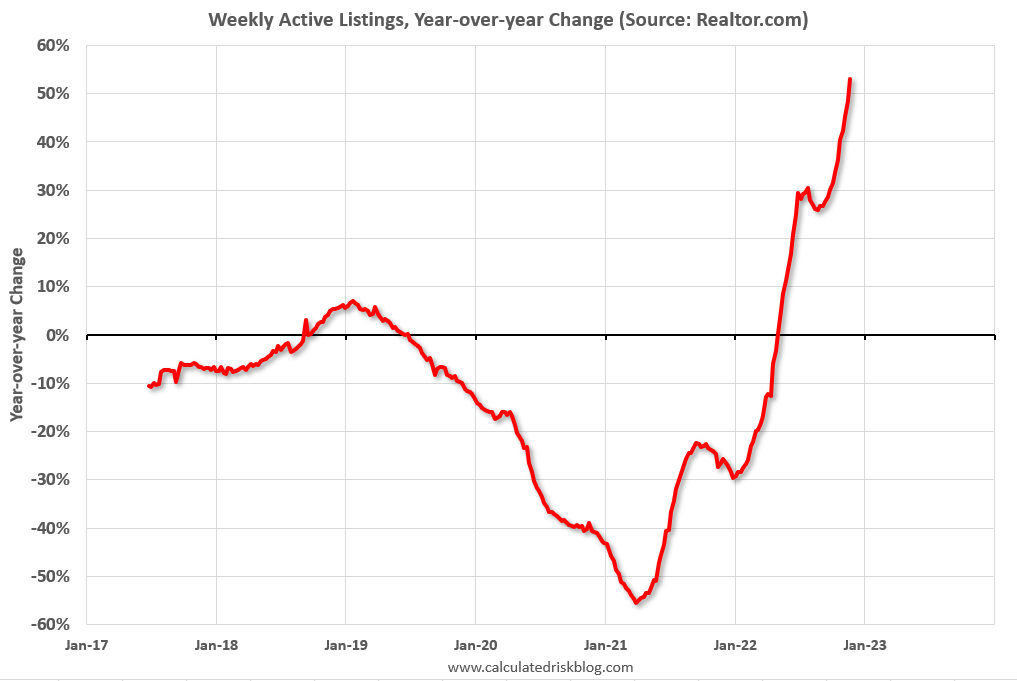 Here is a graph of the year-over-year change in inventory according to realtor.com.
 Note the rapid increase in the YoY change earlier this year, from down 30% at the beginning of the year, to up 29% YoY at the beginning of July.
Then the Realtor.com data was stuck at up around 26% to 30% YoY for 14 weeks in a row. This was due to the slowdown in new listings, even as sales had fallen sharply.
Now YoY inventory is increasing again with even higher mortgage rates, suggesting sales are off more than new listings.
Comments on November Employment Report
by Calculated Risk on 12/02/2022 09:33:00 AM
The headline jobs number in the November employment report was above expectations, however employment for the previous two months was revised down by 23,000, combined. The participation rate decreased, and the unemployment rate was unchanged at 3.7%.
Leisure and hospitality gained 88 thousand jobs in November. At the beginning of the pandemic, in March and April of 2020, leisure and hospitality lost 8.2 million jobs, and are now down 980 thousand jobs since February 2020. So, leisure and hospitality has now added back about 88% all of the jobs lost in March and April 2020.
Construction employment increased 20 thousand and is now 126 thousand above the pre-pandemic level.
Manufacturing added 14 thousand jobs and is now 149 thousand above the pre-pandemic level.
In November, the year-over-year employment change was 4.90 million jobs.
Seasonal Retail Hiring
Typically, retail companies start hiring for the holiday season in October, and really increase hiring in November. Here is a graph that shows the historical net retail jobs added for October, November and December by year.
 This graph really shows the collapse in retail hiring in 2008. Since then, seasonal hiring had increased back close to more normal levels. Note: I expect the long-term trend will be down with more and more internet holiday shopping.
Retailers hired 257 thousand workers Not Seasonally Adjusted (NSA) net in November.
This was seasonally adjusted (SA) to a loss of 29.9 thousand jobs in November.
Prime (25 to 54 Years Old) Participation
 Since the overall participation rate is impacted by both cyclical (recession) and demographic (aging population, younger people staying in school) reasons, here is the employment-population ratio for the key working age group: 25 to 54 years old.
The 25 to 54 participation rate decreased in November to 82.4% from 82.5% in October, and the 25 to 54 employment population ratio decreased to 79.7% from 79.8% the previous month.
Both have declined recently - but both are close to the pre-pandemic levels and indicate almost all of the prime age workers have returned to the labor force.
Part Time for Economic Reasons
 From the BLS report:
These workers are included in the alternate measure of labor underutilization (U-6) that decreased to 6.7% from 6.8% in the previous month. This is down from the record high in April 22.9% and ties the lowest level on record (series started in 1994). This measure is below the level in February 2020 (pre-pandemic).
Unemployed over 26 Weeks
 This graph shows the number of workers unemployed for 27 weeks or more.
According to the BLS, there are 1.230 million workers who have been unemployed for more than 26 weeks and still want a job, up from 1.165 million the previous month.
This is close to pre-pandemic levels.
Summary:
The headline monthly jobs number was above expectations; however, employment for the previous two months was revised down by 23,000, combined.
Part Time for Economic Reasons
 From the BLS report:
"The number of persons employed part time for economic reasons was about unchanged at 3.7 million in November. These individuals, who would have preferred full-time employment, were working part time because their hours had been reduced or they were unable to find full-time jobs."The number of persons working part time for economic reasons increased in November to 3.685 million from 3.660 million in October. This is below pre-recession levels and near the fewest part time workers (for economic reasons) in over 20 years.
These workers are included in the alternate measure of labor underutilization (U-6) that decreased to 6.7% from 6.8% in the previous month. This is down from the record high in April 22.9% and ties the lowest level on record (series started in 1994). This measure is below the level in February 2020 (pre-pandemic).
Unemployed over 26 Weeks
 This graph shows the number of workers unemployed for 27 weeks or more.
 According to the BLS, there are 1.230 million workers who have been unemployed for more than 26 weeks and still want a job, up from 1.165 million the previous month.
This is close to pre-pandemic levels.
Summary:
The headline monthly jobs number was above expectations; however, employment for the previous two months was revised down by 23,000, combined.
The headline unemployment rate was unchanged at 3.7%, and U-6 declined to tie a record low at 6.7%.
Overall, this was another solid employment report.
November Employment Report: 263 thousand Jobs, 3.7% Unemployment Rate
by Calculated Risk on 12/02/2022 08:44:00 AM
From the BLS:
Total nonfarm payroll employment increased by 263,000 in November, and the unemployment rate was unchanged at 3.7 percent, the U.S. Bureau of Labor Statistics reported today. Notable job gains occurred in leisure and hospitality, health care, and government. Employment declined in retail trade and in transportation and warehousing.
...
The change in total nonfarm payroll employment for September was revised down by 46,000, from +315,000 to +269,000, and the change for October was revised up by 23,000, from +261,000 to +284,000. With these revisions, employment gains in September and October combined were 23,000 lower than previously reported.
emphasis added
 Click on graph for larger image.
The first graph shows the job losses from the start of the employment recession, in percentage terms.
The current employment recession was by far the worst recession since WWII in percentage terms.
However, as of August 2022, the total number of jobs had returned and are now 1.044 million above pre-pandemic levels. I'll post this graph through the January 2023 report (includes the annual revision).
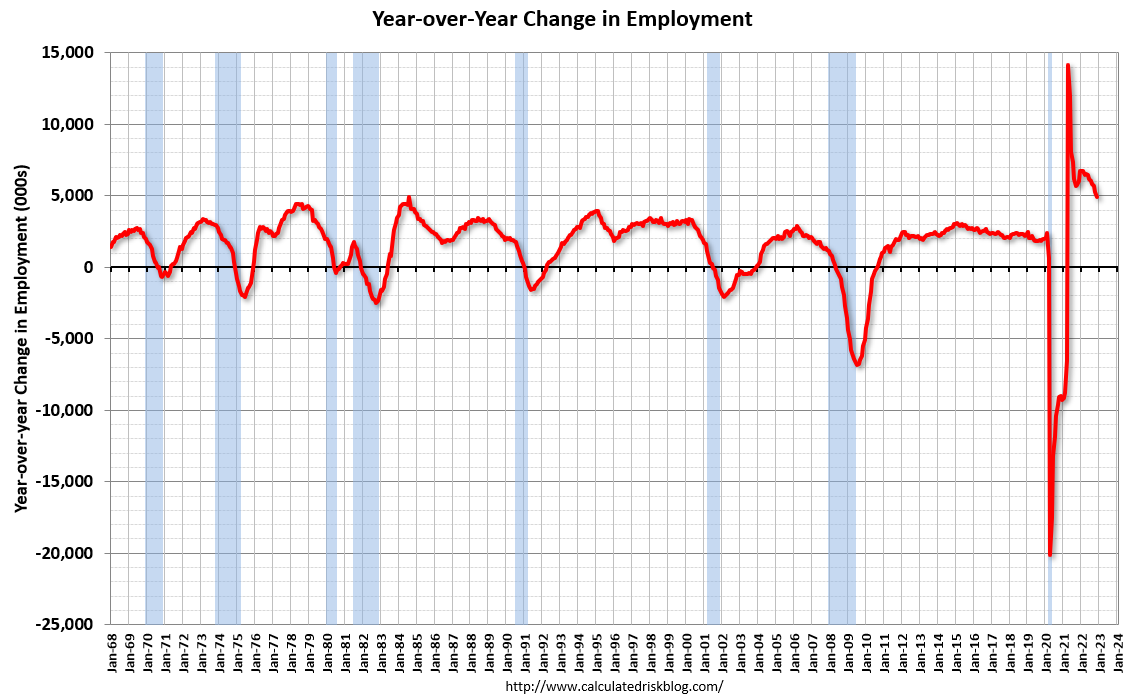
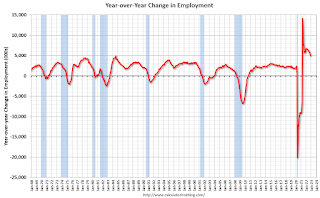 The second graph shows the year-over-year change in total non-farm employment since 1968.
In November, the year-over-year change was 4.90 million jobs. Employment was up significantly year-over-year.
Total payrolls increased by 263 thousand in November. Private payrolls increased by 221 thousand, and public payrolls increased 42 thousand.
Payrolls for September and October were revised down 23 thousand, combined.
The third graph shows the employment population ratio and the participation rate.
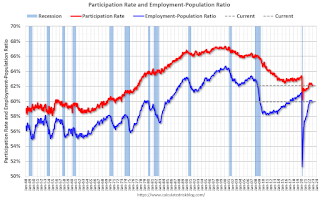 The Labor Force Participation Rate decreased to 62.1% in November, from 62.2% in October. This is the percentage of the working age population in the labor force.
The Employment-Population ratio decreased to 59.9% from 60.0% (blue line).
I'll post the 25 to 54 age group employment-population ratio graph later.
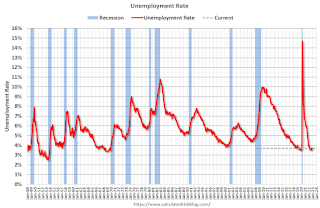 The fourth graph shows the unemployment rate.
The unemployment rate was unchanged in November at 3.7% from 3.7% in October.
This was above consensus expectations; however, September and October payrolls were revised down by 23,000 combined.
 The second graph shows the year-over-year change in total non-farm employment since 1968.
In November, the year-over-year change was 4.90 million jobs. Employment was up significantly year-over-year.
Total payrolls increased by 263 thousand in November. Private payrolls increased by 221 thousand, and public payrolls increased 42 thousand.
Payrolls for September and October were revised down 23 thousand, combined.
The third graph shows the employment population ratio and the participation rate.
 The Labor Force Participation Rate decreased to 62.1% in November, from 62.2% in October. This is the percentage of the working age population in the labor force.
 The Employment-Population ratio decreased to 59.9% from 60.0% (blue line).
I'll post the 25 to 54 age group employment-population ratio graph later.
 The fourth graph shows the unemployment rate.
 The unemployment rate was unchanged in November at 3.7% from 3.7% in October.
This was above consensus expectations; however, September and October payrolls were revised down by 23,000 combined.
I'll have more later ...
Thursday, December 01, 2022
Friday: Employment Report
by Calculated Risk on 12/01/2022 09:08:00 PM
 Mortgage rates are down a full percentage point in just over 3 weeks.
Note: Mortgage rates are from MortgageNewsDaily.com and are for top tier scenarios.
My November Employment Preview
Friday:
• At 8:30 AM ET, Employment Report for November. The consensus is for 200,000 jobs added, and for the unemployment rate to be unchanged at 3.7%.
Vehicles Sales Declined to 14.14 million SAAR in November
by Calculated Risk on 12/01/2022 07:24:00 PM
Wards Auto released their estimate of light vehicle sales for November. Wards Auto estimates sales of 14.14 million SAAR in November 2022 (Seasonally Adjusted Annual Rate), down 5.1% from the October sales rate, and up 7.9% from November 2021.
 Click on graph for larger image.
This graph shows light vehicle sales since 2006 from the BEA (blue) and Wards Auto's estimate for November (red).
The impact of COVID-19 was significant, and April 2020 was the worst month. After April 2020, sales increased, and were close to sales in 2019 (the year before the pandemic). However, sales decreased late last year due to supply issues. It appears the "supply chain bottom" was in September 2021.
 The second graph shows light vehicle sales since the BEA started keeping data in 1967.

