 RSS Feed
 by Calculated Risk on 10/31/2022 08:57:00 PM
Monday, October 31, 2022
Tuesday: ISM Mfg, Construction Spending, Vehicle Sales
 From Matthew Graham at Mortgage News Daily: Mortgage Rates Slightly Higher To Start The Week. More Volatility Ahead
Mortgage rates are fresh off their best week since at least July and their best winning streak (in terms of consecutive days moving lower) in well over a year. The price of admission happened to be the highest rates in more than 20 years, so the recent improvements were really nothing more than a balancing act. ... [30 year fixed 7.13%]Tuesday:
emphasis added
• At 8:00 AM ET, Corelogic House Price index for September.
• At 10:00 AM, ISM Manufacturing Index for October. The consensus is for 49.9, down from 50.9.
• Also at 10:00 AM, Construction Spending for September. The consensus is for 0.5% decrease in spending.
• Late, Light vehicle sales for October. The consensus is for sales of 14.3 million SAAR, up from 13.5 million SAAR in September (Seasonally Adjusted Annual Rate).
Fannie Mae: Mortgage Serious Delinquency Rate Decreased in September
by Calculated Risk on 10/31/2022 04:47:00 PM
Fannie Mae reported that the Single-Family Serious Delinquency decreased to 0.69% in September from 0.72% in August. The serious delinquency rate is down from 1.62% in September 2021. This is close to pre-pandemic levels.
These are mortgage loans that are "three monthly payments or more past due or in foreclosure".
The Fannie Mae serious delinquency rate peaked in February 2010 at 5.59% following the housing bubble and peaked at 3.32% in August 2020 during the pandemic.
 Click on graph for larger image
By vintage, for loans made in 2004 or earlier (1% of portfolio), 2.41% are seriously delinquent (down from 2.48% in August).
For loans made in 2005 through 2008 (1% of portfolio), 3.83% are seriously delinquent (down from 3.95%),
For recent loans, originated in 2009 through 2021 (98% of portfolio), 0.55% are seriously delinquent (down from 0.57%). So, Fannie is still working through a few poor performing loans from the bubble years.
Mortgages in forbearance were counted as delinquent in this monthly report, but they were not reported to the credit bureaus.
Freddie Mac reported earlier.
Mortgages in forbearance were counted as delinquent in this monthly report, but they were not reported to the credit bureaus.
Freddie Mac reported earlier.
Q3 2022 GDP Details on Residential and Commercial Real Estate
by Calculated Risk on 10/31/2022 02:46:00 PM
The BEA released the underlying details for the Q3 advance GDP report on Friday.
The BEA reported that investment in non-residential structures increased at a 3.7% annual pace in Q3. Investment in petroleum and natural gas structures increased in Q3 compared to Q2 and was up 22% year-over-year.

The first graph shows investment in offices, malls and lodging as a percent of GDP.
Investment in offices (blue) increased slightly in Q3 and was down 1.3% year-over-year. And still declining as a percent of GDP.
Investment in multimerchandise shopping structures (malls) peaked in 2007 and was up about 16% year-over-year in Q3 - from a very low level. The vacancy rate for malls is still very high, so investment will probably stay low for some time.
Lodging investment increased in Q3 compared to Q2, and lodging investment was up 6% year-over-year.
All three sectors - offices, malls, and hotels - were hurt significantly by the pandemic.
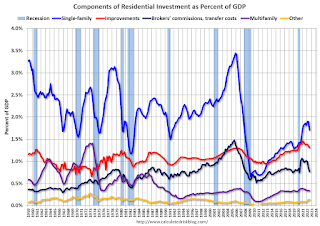 The second graph is for Residential investment components as a percent of GDP. According to the Bureau of Economic Analysis, RI includes new single-family structures, multifamily structures, home improvement, Brokers’ commissions and other ownership transfer costs, and a few minor categories (dormitories, manufactured homes).
Investment in single family structures was $438 billion (SAAR) (about 1.7% of GDP) and was unchanged year-over-year.
Investment in multi-family structures was up in Q3 from Q2.
Investment in home improvement was at a $335 billion Seasonally Adjusted Annual Rate (SAAR) in Q3 (about 1.3% of GDP). Home improvement spending was strong during the pandemic but has declined as a percent of GDP recently.
Note that Brokers' commissions (black) increased sharply as existing home sales increased in the second half of 2020 but was down in Q3 2022. Brokers' commissions were down 15% year-over-year in Q3 (and down sharply as a percent of GDP).
Year-over-year Pace of Rent Increases Continues to Slow
by Calculated Risk on 10/31/2022 09:52:00 AM
Today, in the Calculated Risk Real Estate Newsletter: Year-over-year Pace of Rent Increases Continues to Slow
A brief excerpt:
Here is a graph of the year-over-year (YoY) change for these measures since January 2015. All of these measures are through September 2022 (Apartment List through October 2022).There is much more in the article. You can subscribe at https://calculatedrisk.substack.com/
Note that new lease measures (Zillow, Apartment List) dipped early in the pandemic, whereas the BLS measures were steady. Then new leases took off, and the BLS measures are picking up.
...
The Zillow measure is up 10.8% YoY in September, down from 12.3% YoY in August. This is down from a peak of 17.2% YoY in February.
The ApartmentList measure is up 5.9% YoY as of October, down from 7.5% in September. This is down from the peak of 18.0% YoY last November.
Rents are still increasing YoY, and we should expect this to continue to spill over into measures of inflation. The Owners’ Equivalent Rent (OER) was up 6.7% YoY in September, from 6.3% YoY in August - and will likely increase further in the coming months even as rents slow sharply.
...
My suspicion is rent increases will slow further over the coming months as the pace of household formation slows, and more supply comes on the market. Housing economist Tom Lawler recently wrote: "An actual decline in rents next year would be a reasonable base case"

Housing October 31st Weekly Update: Inventory Increased, New High for 2022
by Calculated Risk on 10/31/2022 08:42:00 AM
Active inventory increased again, hitting another new peak for the year. Here are the same week inventory changes for the last four years (usually inventory is declining at this time of year):
2022: +5.2K (still increasing!)
2021: -9.1K
2020: -6.6K
2019: -9.9K
Inventory bottomed seasonally at the beginning of March 2022 and is now up 139% since then. Altos reports inventory is up 0.9% week-over-week.
 Click on graph for larger image.
This inventory graph is courtesy of Altos Research.
 Click on graph for larger image.
This inventory graph is courtesy of Altos Research.
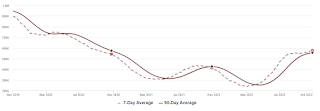
As of October 28th, inventory was at 577 thousand (7-day average), compared to 572 thousand the prior week.
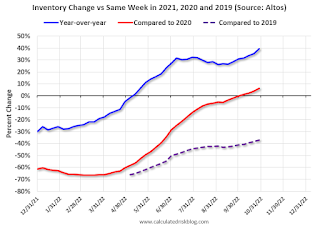
Compared to the same week in 2021, inventory is up 39.5% from 414 thousand, and compared to the same week in 2020 inventory is up 6.3% from 543 thousand. Compared to 3 years ago, inventory is down 37.2% from 919 thousand.
Here are the inventory milestones I’ve been watching for with the Altos data:
1. The seasonal bottom (happened on March 4, 2022, for Altos) ✅
2. Inventory up year-over-year (happened on May 20, 2022, for Altos) ✅
3. Inventory up compared to 2020 (happened on October 7, 2022, for Altos) ✅
4. Inventory up compared to 2019 (currently down 37.2%).
1. The seasonal bottom (happened on March 4, 2022, for Altos) ✅
2. Inventory up year-over-year (happened on May 20, 2022, for Altos) ✅
3. Inventory up compared to 2020 (happened on October 7, 2022, for Altos) ✅
4. Inventory up compared to 2019 (currently down 37.2%).

Here is a graph of the inventory change vs 2021 (milestone 2 above), 2020 (milestone 3) and 2019 (milestone 4).
The blue line is the year-over-year data, the red line is compared to two years ago, and dashed purple is compared to 2019.
A key will be if inventory continues to increase in the Fall.
Mike Simonsen discusses this data regularly on Youtube.
Four High Frequency Indicators for the Economy
by Calculated Risk on 10/31/2022 08:29:00 AM
These indicators are mostly for travel and entertainment. It is interesting to watch these sectors recover as the pandemic subsides.
The TSA is providing daily travel numbers.
This data is as of October 30th.
 Click on graph for larger image.
This data shows the 7-day average of daily total traveler throughput from the TSA for 2019 (Light Blue), 2020 (Black), 2021 (Blue) and 2022 (Red).
The dashed line is the percent of 2019 for the seven-day average.
The 7-day average is about at the same level as in 2019 (100.3% of 2019). (Dashed line)
Air travel - as a percent of 2019 - has picked up recently.
----- Movie Tickets: Box Office Mojo -----
 This data shows domestic box office for each week and the median for the years 2016 through 2019 (dashed light blue).
 This data shows domestic box office for each week and the median for the years 2016 through 2019 (dashed light blue).
 Black is 2020, Blue is 2021 and Red is 2022.
The data is from BoxOfficeMojo through October 27th.
Note that the data is usually noisy week-to-week and depends on when blockbusters are released.
Movie ticket sales were at $147 million last week, down about 7% from the median for the week.
Note that the data is usually noisy week-to-week and depends on when blockbusters are released.
Movie ticket sales were at $147 million last week, down about 7% from the median for the week.
 This graph shows the seasonal pattern for the hotel occupancy rate using the four-week average.
 The red line is for 2022, black is 2020, blue is the median, and dashed light blue is for 2021. Dashed purple is 2019 (STR is comparing to a strong year for hotels).
This data is through Oct 22nd. The occupancy rate was down 0.5% compared to the same week in 2019.
The 4-week average of the occupancy rate is above the median rate for the previous 20 years (Blue).
Notes: Y-axis doesn't start at zero to better show the seasonal change.
Notes: Y-axis doesn't start at zero to better show the seasonal change.

This graph, based on weekly data from the U.S. Energy Information Administration (EIA), shows gasoline supplied compared to the same week of 2019.
Blue is for 2020. Purple is for 2021, and Red is for 2022.
As of October 21st, gasoline supplied was down 6.9% compared to the same week in 2019.
Recently gasoline supplied has been running below 2019 and 2021 levels - and sometimes below 2020.
Sunday, October 30, 2022
Sunday Night Futures
by Calculated Risk on 10/30/2022 07:15:00 PM
Weekend:
• Schedule for Week of October 30, 2022
Monday:
• At 9:45 AM ET, Chicago Purchasing Managers Index for October. The consensus is for a reading of 47.2, up from 45.7 in September.
• At 10:00 AM, The Q3 Housing Vacancies and Homeownership report from the Census Bureau.
• At 10:30 AM, Dallas Fed Survey of Manufacturing Activity for October. This is the last regional Fed survey for October.
From CNBC: Pre-Market Data and Bloomberg futures S&P 500 and DOW futures are down slightly (fair value).
Oil prices were up over the last week with WTI futures at $87.90 per barrel and Brent at $95.77 per barrel. A year ago, WTI was at $84, and Brent was at $84 - so WTI oil prices are up 5% year-over-year.
Here is a graph from Gasbuddy.com for nationwide gasoline prices. Nationally prices are at $3.72 per gallon. A year ago, prices were at $3.39 per gallon, so gasoline prices are up $0.33 per gallon year-over-year.
FOMC Preview: 75bp Hike
by Calculated Risk on 10/30/2022 10:28:00 AM
Expectations are the FOMC will announce a 75bp rate increase in the federal funds rate at the meeting this week.
From Merrill Lynch:
1 Projections of change in real GDP and inflation are from the fourth quarter of the previous year to the fourth quarter of the year indicated.
The unemployment rate was at 3.5% in September. So far, the economic slowdown has not pushed up the unemployment rate.
2 Projections for the unemployment rate are for the average civilian unemployment rate in the fourth quarter of the year indicated.
As of September 2022, PCE inflation was up 6.2% from September 2021. This was below the cycle high of 7.0% YoY in June. There was a surge of inflation in Q4 2021, so with less inflation in Q4 this year, it is possible inflation will decline to the projected year-over-year range in Q4.
PCE core inflation was up 5.1% in September year-over-year. This was below the cycle high of 5.4% YoY in February. Core inflation has picked up more than expected and will likely be above the Q4 projected range.
"We expect the Fed to raise its target range for the federal funds rate by 75bp in November ... In our view, based on the median policy rate path as expressed in the September SEPs and communication from some FOMC participants like San Francisco Fed President Mary Daly, the committee is likely to engage in a debate on the appropriateness of slowing the pace of policy rate hikes beginning in December.From Goldman Sachs:
Communicating that the discussion took place should be enough to open the door for a step down to a 50bp rate hike in December, as we currently expect. That said, we expect Chair Powell to say that no decision was taken and the committee remains data dependent. With two employment reports and one CPI report between the November FOMC meeting and the December blackout period, the Fed will be reluctant to pre- commit to a smaller rate hike this far in advance. Data still need to cooperate.
By reaffirming the September median policy rate path, repeating consensus FOMC views that risks to the outlook for inflation still reside to the upside, and emphasizing a willingness to err on the side of tightening to much over tightening too little, we think the Fed can be successful in pushing back against any interpretation that a slower pace of rate hikes implies a lower terminal rate or a quicker pivot to rate cuts. In other words, it is now about the destination, not the journey."
"The FOMC is set to deliver a fourth 75bp hike at its November meeting next week, raising the target range for the fed funds rate to 3.75-4%. The focus will be on what comes next, and we expect Chair Powell to hint that the FOMC will likely slow the pace to 50bp in December ... We expect the FOMC to eventually pair that slowdown to 50bp in December with a somewhat higher projected peak funds rate in the December dot plot. We are adding another 25bp hike to our own forecast—which now calls for hikes of 75bp in November, 50bp in December, 25bp in February, and 25bp in March—and now see the funds rate peaking at 4.75-5%."
Analysts will be looking for comments on the size of future rate hikes.
Projections will NOT be released at this meeting. For review, here are the September projections.
In September, most participants expected seventeen 25bp rate hikes in 2022. The FOMC raised rates 25 bp in March, 50 bp in May, 75 bp in June, 75 bp in July and 75 bp in September. That is twelve 25 bp increases so far, and the Fed expects rates to raise rates 75 bp at this meeting and 50 bp in December.
Current Wall Street forecasts are for GDP to increase slightly in 2022 Q4 over Q4 in line with FOMC projections. For example, BofA is projecting:
Current Wall Street forecasts are for GDP to increase slightly in 2022 Q4 over Q4 in line with FOMC projections. For example, BofA is projecting:
We now forecast GDP growth to slow to 0.2% in 2022 (4Q/4Q) and expect growth to slow to -0.9% in 2023 (4Q/4Q) as the lagged effects of tighter monetary policy and financial conditions cool the economy.
Goldman is tracking real Q4 GDP at a 0.8% annualized rate, that would put Q4/Q4 at 0.3% in 2022.
| GDP projections of Federal Reserve Governors and Reserve Bank presidents, Change in Real GDP1 | ||||
|---|---|---|---|---|
| Projection Date | 2022 | 2023 | 2024 | |
| Sept 2022 | 0.1 to 0.3 | 0.5 to 1.5 | 1.4 to 2.0 | |
| June 2022 | 1.5 to 1.9 | 1.3 to 2.0 | 1.5 to 2.0 | |
The unemployment rate was at 3.5% in September. So far, the economic slowdown has not pushed up the unemployment rate.
| Unemployment projections of Federal Reserve Governors and Reserve Bank presidents, Unemployment Rate2 | ||||
|---|---|---|---|---|
| Projection Date | 2022 | 2023 | 2024 | |
| Sept 2022 | 3.8 to 3.9 | 4.1 to 4.5 | 4.0 to 4.6 | |
| June 2022 | 3.6 to 3.8 | 3.8 to 4.1 | 3.9 to 4.1 | |
As of September 2022, PCE inflation was up 6.2% from September 2021. This was below the cycle high of 7.0% YoY in June. There was a surge of inflation in Q4 2021, so with less inflation in Q4 this year, it is possible inflation will decline to the projected year-over-year range in Q4.
| Inflation projections of Federal Reserve Governors and Reserve Bank presidents, PCE Inflation1 | ||||
|---|---|---|---|---|
| Projection Date | 2022 | 2023 | 2024 | |
| Sept 2022 | 5.3 to 5.7 | 2.6 to 3.5 | 2.1 to 2.6 | |
| June 2022 | 5.0 to 5.3 | 2.4 to 3.0 | 2.0 to 2.5 | |
PCE core inflation was up 5.1% in September year-over-year. This was below the cycle high of 5.4% YoY in February. Core inflation has picked up more than expected and will likely be above the Q4 projected range.
| Core Inflation projections of Federal Reserve Governors and Reserve Bank presidents, Core Inflation1 | ||||
|---|---|---|---|---|
| Projection Date | 2022 | 2023 | 2024 | |
| Sept 2022 | 4.4 to 4.6 | 3.0 to 3.4 | 2.2 to 2.5 | |
| June 2022 | 4.2 to 4.5 | 2.5 to 3.2 | 2.1 to 2.5 | |
Saturday, October 29, 2022
Real Estate Newsletter Articles this Week: National House Price Index "Continued to Decelerate"
by Calculated Risk on 10/29/2022 02:11:00 PM
At the Calculated Risk Real Estate Newsletter this week:
• Case-Shiller: National House Price Index "Continued to Decelerate" to 13.0% year-over-year increase in August
• New Home Sales Decreased in September; Completed Inventory Increased
• Lawler: Update on the Household “Conundrum”
• Inflation Adjusted House Prices 2.3% Below Peak
• Final Look at Local Housing Markets in September
• Lawler: Selected Operating Results, Large Home Builders
This is usually published 4 to 6 times a week and provides more in-depth analysis of the housing market.
You can subscribe at https://calculatedrisk.substack.com/
Most content is available for free (and no Ads), but please subscribe!
Schedule for Week of October 30, 2022
by Calculated Risk on 10/29/2022 08:11:00 AM
Boo!
The key report this week is the October employment report on Friday.
Other key indicators include the October ISM manufacturing and services indexes, October vehicle sales, and the September trade deficit.
The FOMC meets this week and is expected to raise rates 75 bp.
9:45 AM: Chicago Purchasing Managers Index for October. The consensus is for a reading of 47.2, up from 45.7 in September.
10:00 AM: The Q3 Housing Vacancies and Homeownership report from the Census Bureau.
10:30 AM: Dallas Fed Survey of Manufacturing Activity for October. This is the last regional Fed survey for October.
8:00 AM ET: Corelogic House Price index for September.
10:00 AM: ISM Manufacturing Index for October. The consensus is for 49.9, down from 50.9.
10:00 AM: Construction Spending for September. The consensus is for 0.5% decrease in spending.
 All day: Light vehicle sales for October.
The consensus is for sales of 14.3 million SAAR, up from 13.5 million SAAR in September (Seasonally Adjusted Annual Rate).
This graph shows light vehicle sales since the BEA started keeping data in 1967. The dashed line is the current sales rate.
7:00 AM ET: The Mortgage Bankers Association (MBA) will release the results for the mortgage purchase applications index.
8:15 AM: The ADP Employment Report for October. This report is for private payrolls only (no government). The consensus is for 200,000 jobs added, down from 208,000 in September.
2:00 PM: FOMC Meeting Announcement. The FOMC is expected to raise rates 75bp at this meeting.
2:30 PM: Fed Chair Jerome Powell holds a press briefing following the FOMC announcement.
8:30 AM: The initial weekly unemployment claims report will be released. The consensus is for an increase to 222 thousand from 217 thousand last week.
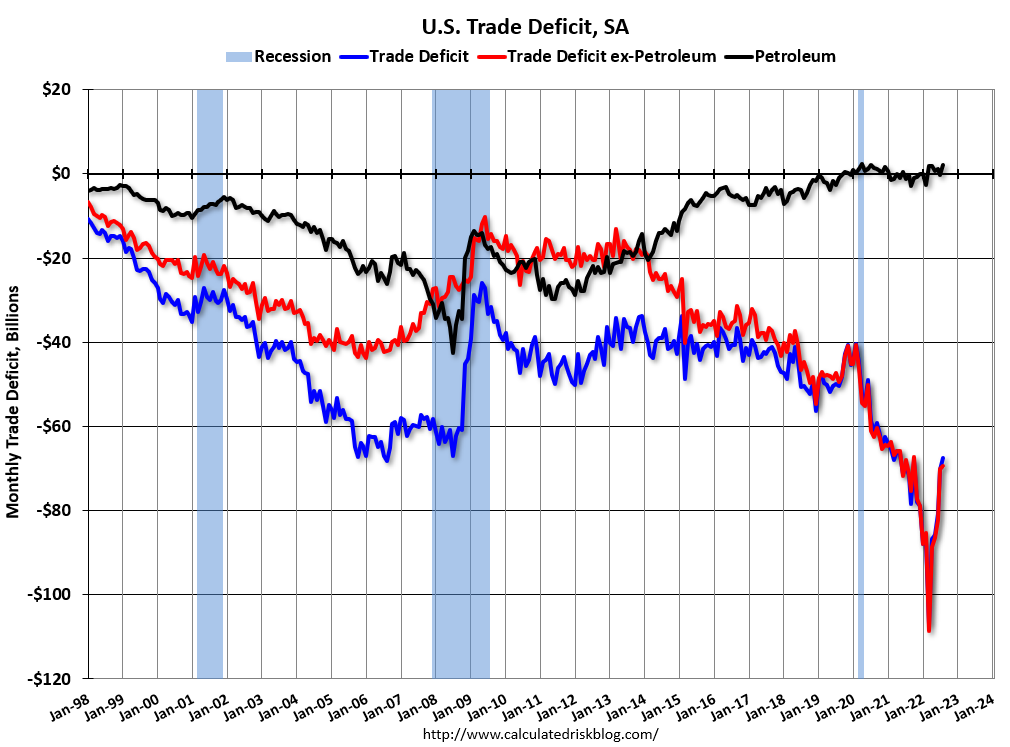 8:30 AM: Trade Balance report for September from the Census Bureau. The consensus is for the deficit to be $72.1 billion in September, from $67.4 billion in August.
This graph shows the U.S. trade deficit, with and without petroleum, through the most recent report. The blue line is the total deficit, and the black line is the petroleum deficit, and the red line is the trade deficit ex-petroleum products.
10:00 AM: the ISM Services Index for October. The consensus is for a decrease to 55.5 from 56.7.
 8:30 AM: Employment Report for October. The consensus is for 200,000 jobs added, and for the unemployment rate to increase to 3.6%.
There were 263,000 jobs added in September, and the unemployment rate was at 3.5%.
This graph shows the job losses from the start of the employment recession, in percentage terms.
The current employment recession was by far the worst recession since WWII in percentage terms. However, all of the jobs have returned.


