 RSS Feed
 by Calculated Risk on 10/31/2022 08:42:00 AM
Monday, October 31, 2022
Housing October 31st Weekly Update: Inventory Increased, New High for 2022
Active inventory increased again, hitting another new peak for the year. Here are the same week inventory changes for the last four years (usually inventory is declining at this time of year):
2022: +5.2K (still increasing!)
2021: -9.1K
2020: -6.6K
2019: -9.9K
Inventory bottomed seasonally at the beginning of March 2022 and is now up 139% since then. Altos reports inventory is up 0.9% week-over-week.
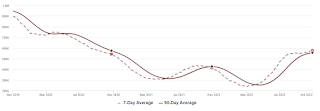 Click on graph for larger image.
This inventory graph is courtesy of Altos Research.
 Click on graph for larger image.
This inventory graph is courtesy of Altos Research.
As of October 28th, inventory was at 577 thousand (7-day average), compared to 572 thousand the prior week.
Compared to the same week in 2021, inventory is up 39.5% from 414 thousand, and compared to the same week in 2020 inventory is up 6.3% from 543 thousand. Compared to 3 years ago, inventory is down 37.2% from 919 thousand.
Here are the inventory milestones I’ve been watching for with the Altos data:
1. The seasonal bottom (happened on March 4, 2022, for Altos) ✅
2. Inventory up year-over-year (happened on May 20, 2022, for Altos) ✅
3. Inventory up compared to 2020 (happened on October 7, 2022, for Altos) ✅
4. Inventory up compared to 2019 (currently down 37.2%).
1. The seasonal bottom (happened on March 4, 2022, for Altos) ✅
2. Inventory up year-over-year (happened on May 20, 2022, for Altos) ✅
3. Inventory up compared to 2020 (happened on October 7, 2022, for Altos) ✅
4. Inventory up compared to 2019 (currently down 37.2%).

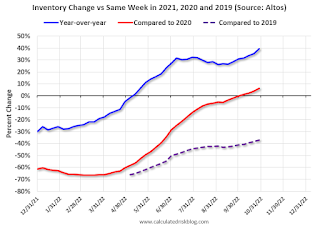
Here is a graph of the inventory change vs 2021 (milestone 2 above), 2020 (milestone 3) and 2019 (milestone 4).
The blue line is the year-over-year data, the red line is compared to two years ago, and dashed purple is compared to 2019.
A key will be if inventory continues to increase in the Fall.
Mike Simonsen discusses this data regularly on Youtube.


