 RSS Feed
 by Calculated Risk on 10/24/2022 08:54:00 PM
Monday, October 24, 2022
Tuesday: Case-Shiller and FHFA House Prices, Richmond Fed Mfg
 From Matthew Graham at Mortgage News Daily: A Rare Winning Streak For Rates, But Don't Get Excited
Now here's a rare thing! Mortgage rates managed to move lower, on average, for the 2nd consecutive business day on Monday. That hasn't happened for roughly 3 weeks, and you'd need to go back another 3 weeks to see the previous example. ... [30 year fixed 7.29%]Tuesday:
emphasis added
• At 9:00 AM ET, S&P/Case-Shiller House Price Index for August. The consensus is for the Composite 20 index to be up 16.1% year-over-year.
• Also at 9:00 AM, FHFA House Price Index for August. This was originally a GSE only repeat sales, however there is also an expanded index.
• At 10:00 AM, Richmond Fed Survey of Manufacturing Activity for October.
October Vehicle Sales Forecast: "Signs of Life"
by Calculated Risk on 10/24/2022 01:54:00 PM
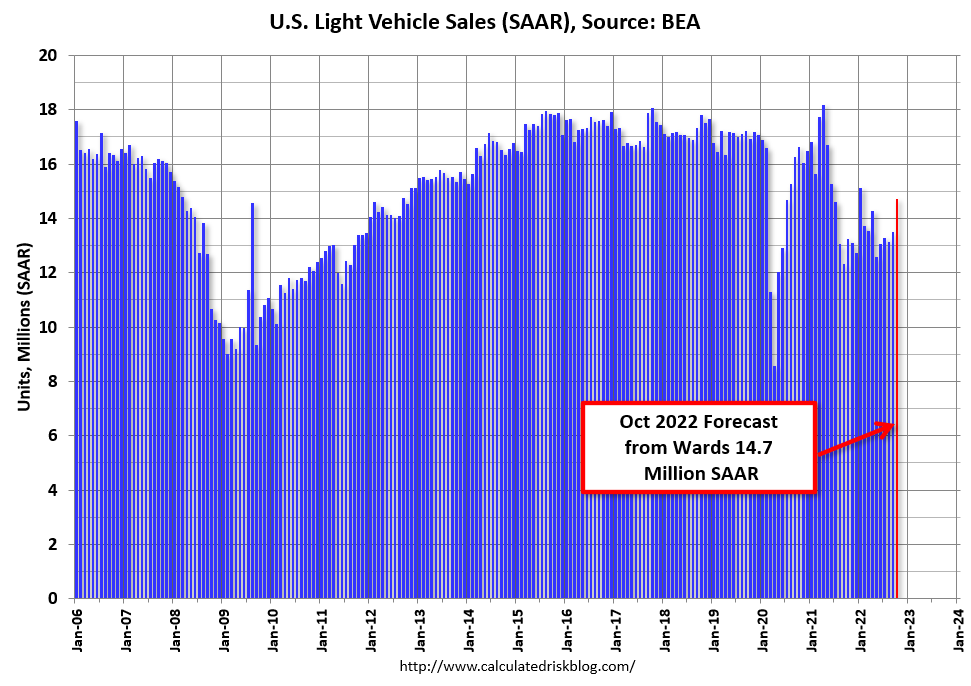
From WardsAuto: October U.S. Light-Vehicle Sales Show Signs of Life (pay content). Brief excerpt:
"The fourth-quarter SAAR is pegged at 14.2 million units, an improvement on Q2’s 13.3 million and Q3’s 13.4 million, but also meaning November-December results will weaken from October, with the primary reason being stiffer economic headwinds expected. Still, inventory will continue rising through the end of November, creating upside to the outlook"
 Click on graph for larger image.
This graph shows actual sales from the BEA (Blue), and Wards forecast for October (Red).
The Wards forecast of 14.7 million SAAR, would be up 9% from last month, and up 11% from a year ago (sales weakened in the second half of 2021, due to supply chain issues).
Vehicle sales are usually a transmission mechanism for Federal Open Market Committee (FOMC) policy, far behind housing. However, this time, vehicle sales have been suppressed by supply chain issues, and sales will probably not be significantly impacted by higher interest rates.
Final Look at Local Housing Markets in September
by Calculated Risk on 10/24/2022 11:36:00 AM
Today, in the Calculated Risk Real Estate Newsletter: Final Look at Local Housing Markets in September
A brief excerpt:
The big story for September existing home sales was the sharp year-over-year (YoY) decline in sales. Another key story was that new listings were down YoY in September as many potential sellers are locked into their current home (low mortgage rate).There is much more in the article. You can subscribe at https://calculatedrisk.substack.com/
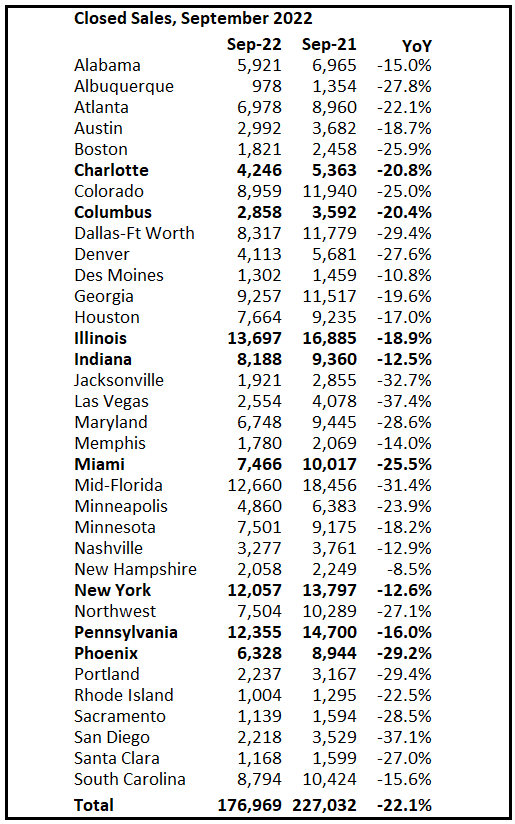
This is the final look at local markets in September. I’m tracking about 35 local housing markets in the US. Some of the 35 markets are states, and some are metropolitan areas. I update these tables throughout the month as additional data is released.
Important: Closed sales in September were mostly for contracts signed in July and August when 30-year mortgage rates averaged about 5.3%. Rates increased to around 6% in September and that will impact closed sales in October and November. In October 30-year mortgage rates have jumped to over 7%, negatively impacting closed sales in November and December.
...
And a table of September sales. In September, sales were down 22.1% YoY Not Seasonally Adjusted (NSA) for these markets. The NAR reported sales were down 21.6% NSA YoY.
Sales in some of the hottest markets are down around 30% YoY (all of California was down 30%), whereas in other markets, sales are only down in the teens YoY.
More local data coming in November for activity in October! We should expect even larger YoY declines in the next few months due to the recent increase in mortgage rates.
Four High Frequency Indicators for the Economy
by Calculated Risk on 10/24/2022 09:23:00 AM
These indicators are mostly for travel and entertainment. It is interesting to watch these sectors recover as the pandemic subsides.
The TSA is providing daily travel numbers.
This data is as of October 23rd.
 Click on graph for larger image.
This data shows the 7-day average of daily total traveler throughput from the TSA for 2019 (Light Blue), 2020 (Black), 2021 (Blue) and 2022 (Red).
The dashed line is the percent of 2019 for the seven-day average.
The 7-day average is down 3.9% from the same day in 2019 (96.1% of 2019). (Dashed line)
Air travel - as a percent of 2019 - seems to be picking up a little, but overall, still below 2019 levels.
----- Movie Tickets: Box Office Mojo -----
 This data shows domestic box office for each week and the median for the years 2016 through 2019 (dashed light blue).
 This data shows domestic box office for each week and the median for the years 2016 through 2019 (dashed light blue).
 Black is 2020, Blue is 2021 and Red is 2022.
The data is from BoxOfficeMojo through October 20th.
Note that the data is usually noisy week-to-week and depends on when blockbusters are released.
Movie ticket sales were at $96 million last week, down about 42% from the median for the week.
Note that the data is usually noisy week-to-week and depends on when blockbusters are released.
Movie ticket sales were at $96 million last week, down about 42% from the median for the week.
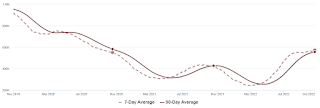
 This graph shows the seasonal pattern for the hotel occupancy rate using the four-week average.
 The red line is for 2022, black is 2020, blue is the median, and dashed light blue is for 2021. Dashed purple is 2019 (STR is comparing to a strong year for hotels).
This data is through Oct 15th. The occupancy rate was down 2.7% compared to the same week in 2019.
The 4-week average of the occupancy rate is above the median rate for the previous 20 years (Blue).
Notes: Y-axis doesn't start at zero to better show the seasonal change.
Notes: Y-axis doesn't start at zero to better show the seasonal change.

This graph, based on weekly data from the U.S. Energy Information Administration (EIA), shows gasoline supplied compared to the same week of 2019.
Blue is for 2020. Purple is for 2021, and Red is for 2022.
As of October 14th, gasoline supplied was down 7.2% compared to the same week in 2019.
Recently gasoline supplied has been running below 2019 and 2021 levels - and sometimes below 2020.
Housing October 24th Weekly Update: Inventory Increased, New High for 2022
by Calculated Risk on 10/24/2022 08:15:00 AM
Active inventory increased again, hitting another new peak for the year. Here are the same week inventory changes for the last four years (usually inventory is declining at this time of year):
2022: +5.7K (still increasing!)
2021: -0.8K
2020: -4.7K
2019: -7.0K
Inventory bottomed seasonally at the beginning of March 2022 and is now up 137% since then. Altos reports inventory is up 1.0% week-over-week.
 Click on graph for larger image.
This inventory graph is courtesy of Altos Research.
 Click on graph for larger image.
This inventory graph is courtesy of Altos Research.
As of October 21st, inventory was at 572 thousand (7-day average), compared to 566 thousand the prior week.
Compared to the same week in 2021, inventory is up 35.3% from 423 thousand, and compared to the same week in 2020 inventory is up 4.0% from 559 thousand. Compared to 3 years ago, inventory is down 38.4% from 929 thousand.
Here are the inventory milestones I’ve been watching for with the Altos data:
1. The seasonal bottom (happened on March 4, 2022, for Altos) ✅
2. Inventory up year-over-year (happened on May 20, 2022, for Altos) ✅
3. Inventory up compared to 2020 (happened on October 7, 2022, for Altos) ✅
4. Inventory up compared to 2019 (currently down 38.4%).

1. The seasonal bottom (happened on March 4, 2022, for Altos) ✅
2. Inventory up year-over-year (happened on May 20, 2022, for Altos) ✅
3. Inventory up compared to 2020 (happened on October 7, 2022, for Altos) ✅
4. Inventory up compared to 2019 (currently down 38.4%).

Here is a graph of the inventory change vs 2021 (milestone 2 above), 2020 (milestone 3) and 2019 (milestone 4).
The blue line is the year-over-year data, the red line is compared to two years ago, and dashed purple is compared to 2019.
A key will be if inventory continues to increase in the Fall.
Mike Simonsen discusses this data regularly on Youtube.
Sunday, October 23, 2022
Sunday Night Futures
by Calculated Risk on 10/23/2022 06:40:00 PM
Weekend:
• Schedule for Week of October 23, 2022
Monday:
• At 8:30 AM ET, Chicago Fed National Activity Index for September. This is a composite index of other data.
From CNBC: Pre-Market Data and Bloomberg futures S&P 500 are up 38 and DOW futures are up 244 (fair value).
Oil prices were down over the last week with WTI futures at $85.05 per barrel and Brent at $93.50 per barrel. A year ago, WTI was at $85, and Brent was at $85 - so WTI oil prices are unchanged year-over-year.
Here is a graph from Gasbuddy.com for nationwide gasoline prices. Nationally prices are at $3.76 per gallon. A year ago, prices were at $3.35 per gallon, so gasoline prices are up $0.41 per gallon year-over-year.
Retail: October Seasonal Hiring vs. Holiday Retail Sales
by Calculated Risk on 10/23/2022 10:38:00 AM
Every year I track seasonal retail hiring for hints about holiday retail sales. At the bottom of this post is a graph showing the correlation between October seasonal hiring and holiday retail sales.
Here is a graph of retail hiring for previous years based on the BLS employment report:
 Click on graph for larger image.
This graph shows the historical net retail jobs added for October, November and December by year.
Retailers hired about 700 thousand seasonal workers last year (using BLS data, Not Seasonally Adjusted), and 224 thousand seasonal workers last October.
Note that in the early '90s, retailers started hiring seasonal workers earlier - and the trend towards hiring earlier has continued.
The following scatter graph is for the years 2005 through 2021 and compares October retail hiring with the real increase (inflation adjusted) for retail sales (Q4 over previous Q4).
 In general October hiring is a pretty good indicator of seasonal sales. R-square is 0.82 for this small sample. Note: This uses retail sales in Q4, and excludes autos, gasoline and restaurants.
NOTE: The dot in the upper right - with real Retail sales up almost 10% YoY is for 2020 - when retail sales soared due to the pandemic spending on goods (service spending was soft).
When the October employment report is released on November 4th, I'll be looking at seasonal retail hiring for hints on what the retailers actually expect for the holiday season.
Saturday, October 22, 2022
Real Estate Newsletter Articles this Week: Record Number of Housing Units Under Construction
by Calculated Risk on 10/22/2022 02:11:00 PM
At the Calculated Risk Real Estate Newsletter this week:
• NAR: Existing-Home Sales Decreased to 4.71 million SAAR in September
• September Housing Starts: Record Number of Housing Units Under Construction
• Monthly Mortgage Payments Up Record Year-over-year
• 3rd Look at Local Housing Markets in September, California Sales off 30% YoY
• Lawler: Early Read on Existing Home Sales in September; CAR Predicts Home Prices to Decline 8.8% in 2023!
• Some "Good News" for Homebuilders
This is usually published 4 to 6 times a week and provides more in-depth analysis of the housing market.
You can subscribe at https://calculatedrisk.substack.com/
Most content is available for free (and no Ads), but please subscribe!
Schedule for Week of October 23, 2022
by Calculated Risk on 10/22/2022 08:11:00 AM
The key reports this week are the advance estimate of Q3 GDP and September New Home sales.
Other key indicators include Personal Income and Outlays for September and Case-Shiller house prices for August.
For manufacturing, the Richmond and Kansas City Fed manufacturing surveys will be released this week.
8:30 AM ET: Chicago Fed National Activity Index for September. This is a composite index of other data.
 9:00 AM ET: S&P/Case-Shiller House Price Index for August. The consensus is for the Composite 20 index to be up 16.1% year-over-year.
This graph shows the year-over-year change in the nominal seasonally adjusted National Index, Composite 10 and Composite 20 indexes through the most recent report (the Composite 20 was started in January 2000).
9:00 AM: FHFA House Price Index for August. This was originally a GSE only repeat sales, however there is also an expanded index.
10:00 AM: Richmond Fed Survey of Manufacturing Activity for October.
7:00 AM ET: The Mortgage Bankers Association (MBA) will release the results for the mortgage purchase applications index.
 10:00 AM: New Home Sales for September from the Census Bureau.
 This graph shows New Home Sales since 1963. The dashed line is the sales rate for last month.
The consensus is for 590 thousand SAAR, down from 685 thousand in August.
8:30 AM: The initial weekly unemployment claims report will be released. The consensus is for an increase to 225 thousand from 214 thousand last week.
8:30 AM: Gross Domestic Product, 3rd quarter 2022 (advance estimate). The consensus is that real GDP increased 2.4% annualized in Q3, up from -0.6% in Q2.
8:30 AM ET: Durable Goods Orders for September from the Census Bureau. The consensus is for a 0.5% increase in durable goods orders.
11:00 AM: Kansas City Fed Survey of Manufacturing Activity for October.
8:30 AM ET: Personal Income and Outlays for September. The consensus is for a 0.3% increase in personal income, and for a 0.4% increase in personal spending. And for the Core PCE price index to increase 0.5%. PCE prices are expected to be up 6.2% YoY, and core PCE prices up 5.2% YoY.
10:00 AM: Pending Home Sales Index for September. The consensus is 5.0% decrease in the index.
10:00 AM: University of Michigan's Consumer sentiment index (Final for October). The consensus is for a reading of 59.8.
Friday, October 21, 2022
COVID Oct 21, 2022: Update on Cases, Hospitalizations and Deaths
by Calculated Risk on 10/21/2022 09:11:00 PM
 30-year mortgage rates at a 20-year high.
NOTE: COVID stats are updated on Fridays.
On COVID (focus on hospitalizations and deaths). Data has switched to weekly.
Weekly deaths bottomed in July 2021 at 1,666.
| COVID Metrics | ||||
|---|---|---|---|---|
| Now | Week Ago | Goal | ||
| New Cases per Week2 | 260,808 | 265,175 | ≤35,0001 | |
| Hospitalized2🚩 | 21,062 | 19,625 | ≤3,0001 | |
| Deaths per Week2 | 2,566 | 2,582 | ≤3501 | |
| 1my goals to stop weekly posts, 2Weekly for Cases, Currently Hospitalized, and Deaths 🚩 Increasing number weekly for Cases, Hospitalized, and Deaths ✅ Goal met. | ||||
 Click on graph for larger image.
This graph shows the weekly (columns) number of deaths reported.


