 RSS Feed
 by Calculated Risk on 8/30/2022 09:12:00 AM
Tuesday, August 30, 2022
Case-Shiller: National House Price Index "Decelerated" to 18.0% year-over-year increase in June
S&P/Case-Shiller released the monthly Home Price Indices for June ("June" is a 3-month average of April, May and June closing prices).
This release includes prices for 20 individual cities, two composite indices (for 10 cities and 20 cities) and the monthly National index.
From S&P: S&P Corelogic Case-Shiller Index Decelerated in June
The S&P CoreLogic Case-Shiller U.S. National Home Price NSA Index, covering all nine U.S. census divisions, reported an 18.0% annual gain in June, down from 19.9% in the previous month. The 10-City Composite annual increase came in at 17.4%, down from 19.1% in the previous month. The 20-City Composite posted an 18.6% year-over-year gain, down from 20.5% in the previous month.
Tampa, Miami, and Dallas reported the highest year-over-year gains among the 20 cities in June. Tampa led the way with a 35.0% year-over-year price increase, followed by Miami in second with a 33.0% increase, and Dallas in third with a 28.2% increase. Only one of the 20 cities reported higher price increases in the year ending June 2022 versus the year ending May 2022.
...
Before seasonal adjustment, the U.S. National Index posted a 0.6% month-over-month increase in June, while the 10-City and 20-City Composites both posted increases of 0.4%.
After seasonal adjustment, the U.S. National Index posted a month-over-month increase of 0.3%, and the 10-City and 20-City Composites posted increases of 0.3% and 0.4%, respectively.
In June, 13 cities reported increases before and after seasonal adjustments.
“The deceleration in U.S. housing prices that we began to observe several months ago continued in June 2022, as the National Composite Index rose by 18.0% on a year-over-year basis,” says Craig J. Lazzara, Managing Director at S&P DJI. “Relative to May’s 19.9% gain (and April’s 20.6%), prices are clearly increasing at a slower rate. This pattern is consistent with our 10-City Composite (up 17.4% in June vs. 19.1% in May) and our 20-City Composite (up 18.6% in June vs. 20.5% in May). It’s important to bear in mind that deceleration and decline are two entirely different things, and that prices are still rising at a robust clip. June’s growth rates for all three composites are at or above the 95th percentile of historical experience. For the first six months of 2022, in fact, the National Composite is up 10.6%. In the last 35 years, only four complete years have witnessed increases that large."
emphasis added
 Click on graph for larger image.
 The first graph shows the nominal seasonally adjusted Composite 10, Composite 20 and National indices (the Composite 20 was started in January 2000).
The Composite 10 index is up 0.3% in June (SA).
The Composite 20 index is up 0,4% (SA) in June.
The National index is 66% above the bubble peak (SA), and up 0.3% (SA) in June. The National index is up 136% from the post-bubble low set in February 2012 (SA).
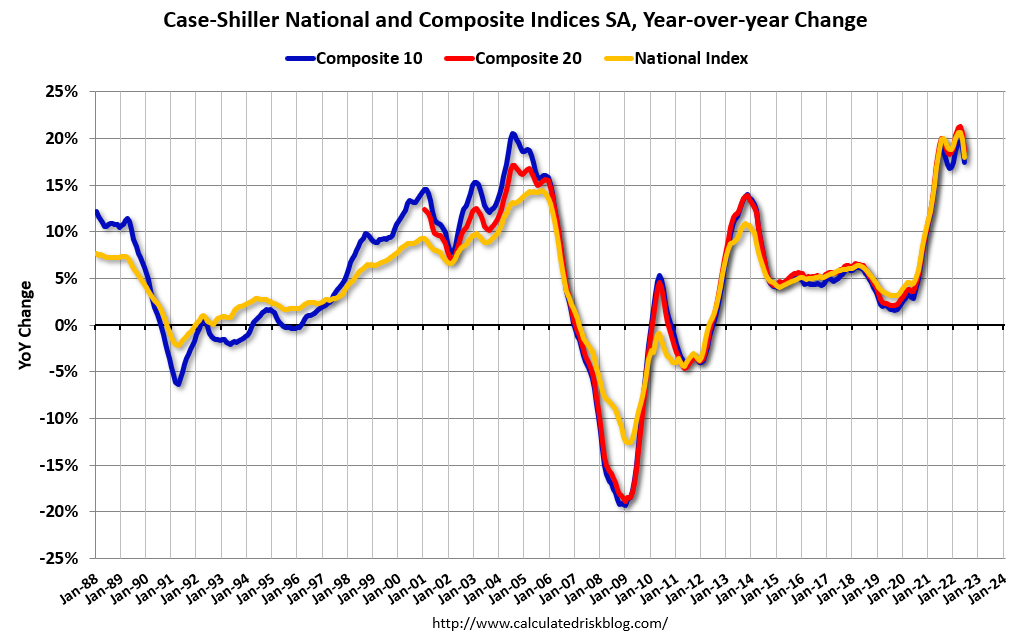 The second graph shows the year-over-year change in all three indices.
The Composite 10 SA is up 17.4% year-over-year. The Composite 20 SA is up 18.6% year-over-year.
The National index SA is up 18.0% year-over-year.
Price increases were lower than expectations. I'll have more later.
Monday, August 29, 2022
Pace of Rent Increases Continues to Slow
by Calculated Risk on 8/29/2022 11:39:00 PM
Today, in the Calculated Risk Real Estate Newsletter: Pace of Rent Increases Continues to Slow
A brief excerpt:
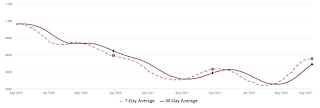
Here is a graph of the year-over-year (YoY) change for these measures since January 2015. All of these measures are through July 2022 (Apartment List through August 2022).There is much more in the article. You can subscribe at https://calculatedrisk.substack.com/
Note that new lease measures (Zillow, Apartment List) dipped early in the pandemic, whereas the BLS measures were steady. Then new leases took off, and the BLS measures are picking up.
...
The Zillow measure is up 13.2% YoY in July, down from 14.9% YoY in June. This is down from a peak of 17.2% YoY in February.
The ApartmentList measure is up 10.0% YoY as of August, down from 12.3% in July. This is down from the peak of 18.0% YoY last November.
Rents are still increasing, and we should expect this to continue to spill over into measures of inflation in 2022. The Owners’ Equivalent Rent (OER) was up 5.8% YoY in July, from 5.5% YoY in June - and will likely increase further in the coming months.
...
My suspicion is rent increases will slow further over the coming months as the pace of household formation slows, and more supply comes on the market. For example, the National Multifamily Housing Council (NMHC) recently reported that markets tightness only increased slightly in their July survey.

Tuesday: Case-Shiller House Prices, Job Openings
by Calculated Risk on 8/29/2022 09:01:00 PM
Tuesday:
• At 9:00 AM ET, S&P/Case-Shiller House Price Index for June. The consensus is for a 20.6% year-over-year increase in the Comp 20 index for June.
• Also at 9:00 AM, FHFA House Price Index for June. This was originally a GSE only repeat sales, however there is also an expanded index.
• At 10:00 AM, Job Openings and Labor Turnover Survey for July from the BLS.
On COVID (focus on hospitalizations and deaths):
| COVID Metrics | ||||
|---|---|---|---|---|
| Now | Week Ago | Goal | ||
| New Cases per Day2 | 82,044 | 94,012 | ≤5,0001 | |
| Hospitalized2 | 29,548 | 34,153 | ≤3,0001 | |
| Deaths per Day2 | 396 | 436 | ≤501 | |
| 1my goals to stop daily posts, 27-day average for Cases, Currently Hospitalized, and Deaths 🚩 Increasing 7-day average week-over-week for Cases, Hospitalized, and Deaths ✅ Goal met. | ||||
 Click on graph for larger image.
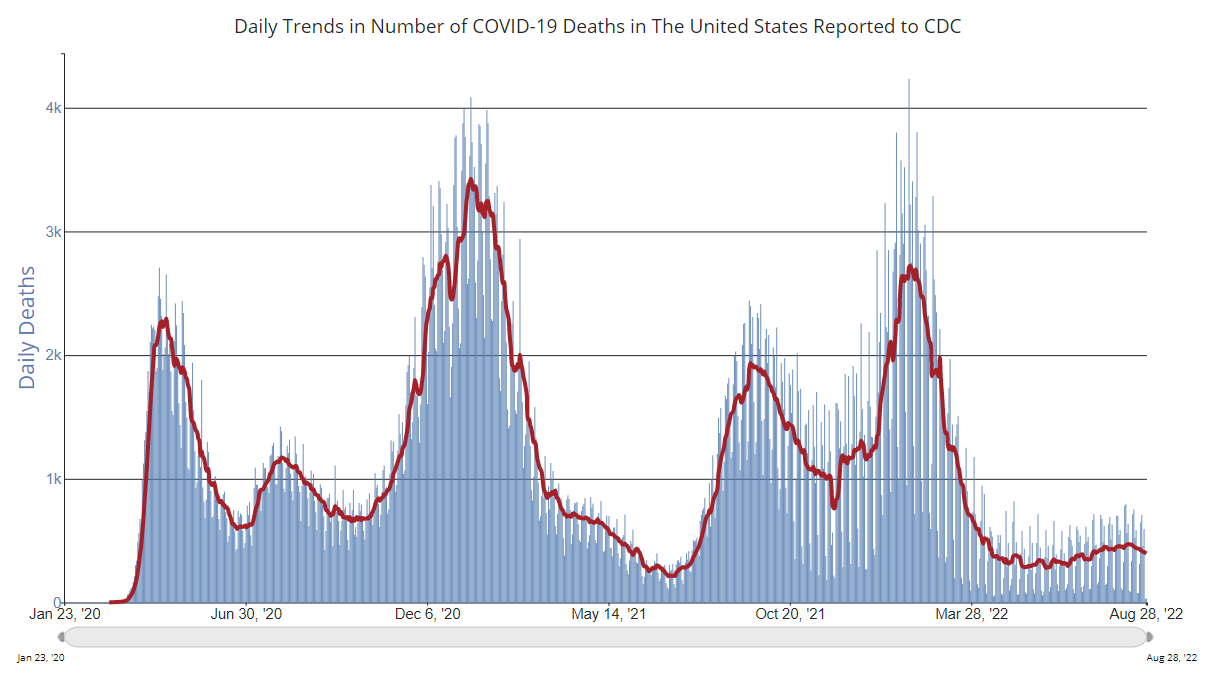
This graph shows the daily (columns) and 7-day average (line) of deaths reported.
Average daily deaths bottomed in July 2021 at 214 per day.
30-Year Mortgage Rates Pushing 6% Again
by Calculated Risk on 8/29/2022 03:59:00 PM
Today, in the Calculated Risk Real Estate Newsletter: 30-Year Mortgage Rates Pushing 6% Again
Excerpt:
After reaching 6.28% on June 14th, 30-year mortgage rates decreased to a low of 5.05% on August 1st according to Mortgagenewsdaily.com. Since then, rates have been moving up, and rates increased today to 5.95%, probably due to Fed Chair Powell’s speech on Friday.
... Not only was Powell suggesting that a 75bp rate hike was possible in September (although most analysts expect 50bp), but he also cautioned against the view of a “pivot” in 2023 with the Fed cutting rates.

There is much more in the article. You can subscribe at https://calculatedrisk.substack.com/
Update: Framing Lumber Prices Up Slightly Year-over-year
by Calculated Risk on 8/29/2022 12:28:00 PM
Here is another monthly update on framing lumber prices.
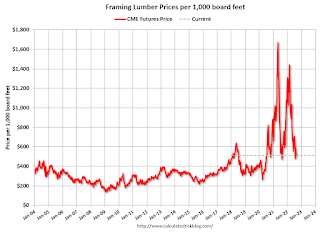
This graph shows CME random length framing futures through August 29th.
Lumber was at $511 per 1000 board feet this morning.
This is down from the peak of $1,733, and up 5% from $485 a year ago.
Prices are still up sharply from the pre-pandemic levels of around $400.
 Click on graph for larger image.
Prices are near the lows for 2021, and it is unlikely we will see a runup in prices as happened at the end of last year.
Prices are still up sharply from the pre-pandemic levels of around $400.
 Click on graph for larger image.
There is somewhat of a seasonal demand for lumber, and lumber prices usually peak in April or May, although peaked earlier this year due to the housing slowdown.
Prices are near the lows for 2021, and it is unlikely we will see a runup in prices as happened at the end of last year.
Housing Inventory August 29th Update
by Calculated Risk on 8/29/2022 09:31:00 AM
Inventory is still increasing, but the inventory build has slowed over the last two months. Still, inventory is increasing faster than in 2019 at this time of year. Here are the same week inventory changes for the last four years:
2022: +3.3K
2021: -0.4K
2020: -2.1K
2019: +2.8K
Inventory bottomed seasonally at the beginning of March 2022 and is now up 130% since then. More than double! Altos reports inventory is up 28.7% year-over-year and is now 26.8% above the peak last year.
 Click on graph for larger image.
This inventory graph is courtesy of Altos Research.
 Click on graph for larger image.
This inventory graph is courtesy of Altos Research.
As of August 26th, inventory was at 555 thousand (7-day average), compared to 551 thousand the prior week. Inventory was up 0.6% from the previous week.
Inventory is still historically low. Compared to the same week in 2021, inventory is up 28.7% from 431 thousand, however compared to the same week in 2020 inventory is down 6.2% from 592 thousand. Compared to 3 years ago, inventory is down 42.4% from 963 thousand.
Here are the inventory milestones I’m watching for with the Altos data:
1. The seasonal bottom (happened on March 4th for Altos) ✅
2. Inventory up year-over-year (happened on May 13th for Altos) ✅
3. Inventory up compared to two years ago (currently down 6.2% according to Altos)
4. Inventory up compared to 2019 (currently down 42.4%).

1. The seasonal bottom (happened on March 4th for Altos) ✅
2. Inventory up year-over-year (happened on May 13th for Altos) ✅
3. Inventory up compared to two years ago (currently down 6.2% according to Altos)
4. Inventory up compared to 2019 (currently down 42.4%).

Here is a graph of the inventory change vs 2021, 2020 (milestone 3 above) and 2019 (milestone 4).
The blue line is the year-over-year data, the red line is compared to two years ago, and dashed purple is compared to 2019.
Two years ago (in 2020) inventory was declining all year, so the two-year comparison will get easier all year.
Based on the recent increases in inventory, my current estimate is inventory will be up compared to 2020 in late September of this year.
A key will be if inventory keeps increasing in September.
Mike Simonsen discusses this data regularly on Youtube.
Four High Frequency Indicators for the Economy
by Calculated Risk on 8/29/2022 08:22:00 AM
These indicators are mostly for travel and entertainment. It is interesting to watch these sectors recover as the pandemic subsides. Notes: I've added back gasoline supplied to see if there is an impact from higher gasoline prices.
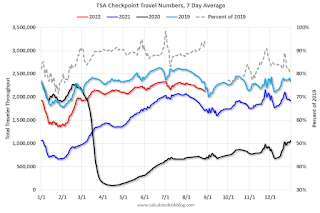
The TSA is providing daily travel numbers.
This data is as of August 28th.
 Click on graph for larger image.
This data shows the 7-day average of daily total traveler throughput from the TSA for 2019 (Light Blue), 2020 (Black), 2021 (Blue) and 2022 (Red).
The dashed line is the percent of 2019 for the seven-day average.
The 7-day average is down 4.9% from the same day in 2019 (90.9% of 2019). (Dashed line)
Air travel - as a percent of 2019 - has been moving sideways over the last several months, off about 10% from 2019 - with some ups and downs, usually related to the timing of holidays.
 This data shows domestic box office for each week and the median for the years 2016 through 2019 (dashed light blue).
 Black is 2020, Blue is 2021 and Red is 2022.
The data is from BoxOfficeMojo through August 25th.
Note that the data is usually noisy week-to-week and depends on when blockbusters are released.
Movie ticket sales were at $109 million last week, down about 41% from the median for the week.
Note that the data is usually noisy week-to-week and depends on when blockbusters are released.
Movie ticket sales were at $109 million last week, down about 41% from the median for the week.
 This graph shows the seasonal pattern for the hotel occupancy rate using the four-week average.
 The red line is for 2022, black is 2020, blue is the median, and dashed light blue is for 2021. Dashed purple is 2019 (STR is comparing to a strong year for hotels).
This data is through August 20th. The occupancy rate was down 2.8% compared to the same week in 2019.
The 4-week average of the occupancy rate is below the median rate for the previous 20 years (Blue).
Notes: Y-axis doesn't start at zero to better show the seasonal change.
Notes: Y-axis doesn't start at zero to better show the seasonal change.

This graph, based on weekly data from the U.S. Energy Information Administration (EIA), shows gasoline supplied compared to the same week of 2019.
Blue is for 2020. Purple is for 2021, and Red is for 2022.
As of August 19th, gasoline supplied was down 12.4% compared to the same week in 2019.
Recently gasoline supplied has been running somewhat below 2019 and 2021 levels - and sometimes below 2020.
Sunday, August 28, 2022
Sunday Night Futures
by Calculated Risk on 8/28/2022 08:03:00 PM
Weekend:
• Schedule for Week of August 28, 2022
Monday:
• At 10:30 AM ET, Dallas Fed Survey of Manufacturing Activity for August. This is the last of the regional Fed manufacturing surveys for August.
From CNBC: Pre-Market Data and Bloomberg futures S&P 500 are down 48 and DOW futures are down 308 (fair value).
Oil prices were up over the last week with WTI futures at $93.06 per barrel and Brent at $100.99 per barrel. A year ago, WTI was at $69, and Brent was at $72 - so WTI oil prices are up 35% year-over-year.
Here is a graph from Gasbuddy.com for nationwide gasoline prices. Nationally prices are at $3.82 per gallon. A year ago, prices were at $3.12 per gallon, so gasoline prices are up $0.70 per gallon year-over-year.
Hotels: Occupancy Rate Down 2.8% Compared to Same Week in 2019
by Calculated Risk on 8/28/2022 08:31:00 AM
Occupancy for the week ending Aug. 20 was 67.3%, 1.2 percentage points lower than the previous week. Nominal average daily rate fell 1.1% week over week to $151, which is 17% higher than in 2019 and 10% greater than a year ago. Nominal revenue per available room contracted 2.8% week over week to $102, but remained ahead of 2019 by 12% and was up 17% from a year ago. Inflation-adjusted, or real, ADR was ahead of 2019 levels by 1%, whereas real RevPAR was below that benchmark by 3%.The following graph shows the seasonal pattern for the hotel occupancy rate using the four-week average.
...
While hotel demand — the number of room nights sold — has decreased week over week, it is only 1% lower than 2019 levels. Occupancy is 2.8 percentage points lower than in the comparable week of 2019 and 3.7 percentage points higher than a year ago. The difference between the demand and occupancy comparisons to 2019 is supply, which has increased by 2.6%. emphasis added
Click on graph for larger image.The red line is for 2022, black is 2020, blue is the median, and dashed light blue is for 2021. Dashed purple is 2019 (STR is comparing to a strong year for hotels).
The 4-week average of the occupancy rate is just below the median rate for the previous 20 years (Blue).
Note: Y-axis doesn't start at zero to better show the seasonal change.
The 4-week average of the occupancy rate has peaked seasonally and will now decline into the Fall.
Saturday, August 27, 2022
Real Estate Newsletter Articles this Week
by Calculated Risk on 8/27/2022 02:11:00 PM
At the Calculated Risk Real Estate Newsletter this week:
• New Home Sales Decrease Sharply, Record Months of Unsold Inventory Under Construction
• The Sellers Strike and Housing Inventory
• Update: Housing Completions will Increase Sharply in Late 2022 and Early 2023
• Final Look at Local Housing Markets in July
• Black Knight: Median House Prices Declined in July; First Decline in 32 Months
This is usually published 4 to 6 times a week and provides more in-depth analysis of the housing market.
You can subscribe at https://calculatedrisk.substack.com/
Most content is available for free (and no Ads), but please subscribe!


