 RSS Feed
 by Calculated Risk on 8/30/2022 09:12:00 AM
Tuesday, August 30, 2022
Case-Shiller: National House Price Index "Decelerated" to 18.0% year-over-year increase in June
S&P/Case-Shiller released the monthly Home Price Indices for June ("June" is a 3-month average of April, May and June closing prices).
This release includes prices for 20 individual cities, two composite indices (for 10 cities and 20 cities) and the monthly National index.
From S&P: S&P Corelogic Case-Shiller Index Decelerated in June
The S&P CoreLogic Case-Shiller U.S. National Home Price NSA Index, covering all nine U.S. census divisions, reported an 18.0% annual gain in June, down from 19.9% in the previous month. The 10-City Composite annual increase came in at 17.4%, down from 19.1% in the previous month. The 20-City Composite posted an 18.6% year-over-year gain, down from 20.5% in the previous month.
Tampa, Miami, and Dallas reported the highest year-over-year gains among the 20 cities in June. Tampa led the way with a 35.0% year-over-year price increase, followed by Miami in second with a 33.0% increase, and Dallas in third with a 28.2% increase. Only one of the 20 cities reported higher price increases in the year ending June 2022 versus the year ending May 2022.
...
Before seasonal adjustment, the U.S. National Index posted a 0.6% month-over-month increase in June, while the 10-City and 20-City Composites both posted increases of 0.4%.
After seasonal adjustment, the U.S. National Index posted a month-over-month increase of 0.3%, and the 10-City and 20-City Composites posted increases of 0.3% and 0.4%, respectively.
In June, 13 cities reported increases before and after seasonal adjustments.
“The deceleration in U.S. housing prices that we began to observe several months ago continued in June 2022, as the National Composite Index rose by 18.0% on a year-over-year basis,” says Craig J. Lazzara, Managing Director at S&P DJI. “Relative to May’s 19.9% gain (and April’s 20.6%), prices are clearly increasing at a slower rate. This pattern is consistent with our 10-City Composite (up 17.4% in June vs. 19.1% in May) and our 20-City Composite (up 18.6% in June vs. 20.5% in May). It’s important to bear in mind that deceleration and decline are two entirely different things, and that prices are still rising at a robust clip. June’s growth rates for all three composites are at or above the 95th percentile of historical experience. For the first six months of 2022, in fact, the National Composite is up 10.6%. In the last 35 years, only four complete years have witnessed increases that large."
emphasis added
 Click on graph for larger image.
 The first graph shows the nominal seasonally adjusted Composite 10, Composite 20 and National indices (the Composite 20 was started in January 2000).
The Composite 10 index is up 0.3% in June (SA).
The Composite 20 index is up 0,4% (SA) in June.
The National index is 66% above the bubble peak (SA), and up 0.3% (SA) in June. The National index is up 136% from the post-bubble low set in February 2012 (SA).
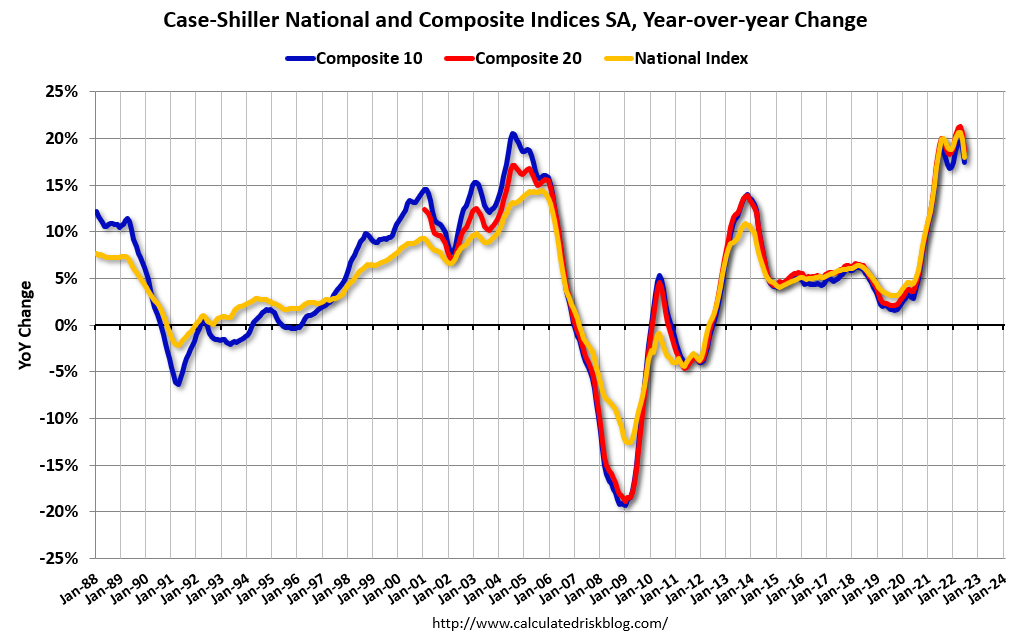 The second graph shows the year-over-year change in all three indices.
The Composite 10 SA is up 17.4% year-over-year. The Composite 20 SA is up 18.6% year-over-year.
The National index SA is up 18.0% year-over-year.
Price increases were lower than expectations. I'll have more later.


