 RSS Feed
 by Calculated Risk on 7/15/2022 09:48:00 PM
Friday, July 15, 2022
COVID July 15, 2022, Update on Cases, Hospitalizations and Deaths
On COVID (focus on hospitalizations and deaths):
Hospitalizations have almost quadrupled from the lows in April 2022.
 Click on graph for larger image.
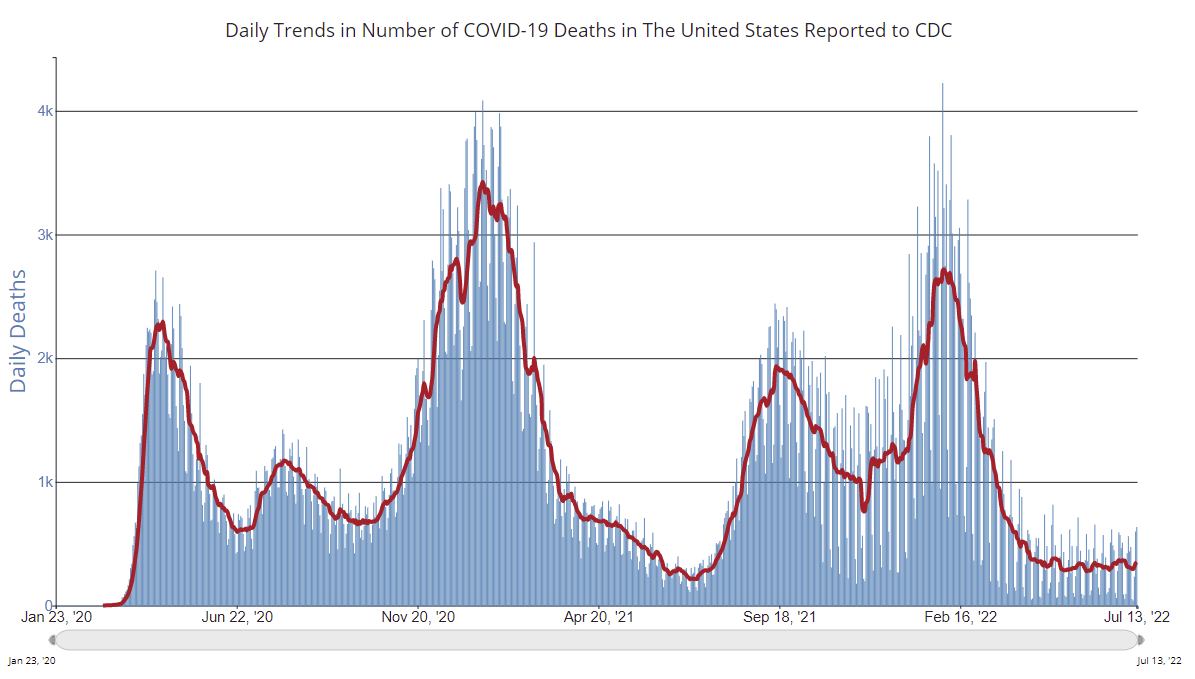
This graph shows the daily (columns) and 7-day average (line) of deaths reported.
| COVID Metrics | ||||
|---|---|---|---|---|
| Now | Week Ago | Goal | ||
| New Cases per Day2🚩 | 126,023 | 107,572 | ≤5,0001 | |
| Hospitalized2🚩 | 32,824 | 29,574 | ≤3,0001 | |
| Deaths per Day2🚩 | 348 | 320 | ≤501 | |
| 1my goals to stop daily posts, 27-day average for Cases, Currently Hospitalized, and Deaths 🚩 Increasing 7-day average week-over-week for Cases, Hospitalized, and Deaths ✅ Goal met. | ||||
 Click on graph for larger image.
This graph shows the daily (columns) and 7-day average (line) of deaths reported.
Average daily deaths bottomed in July 2021 at 214 per day.
Early Read on Existing Home Sales in June
by Calculated Risk on 7/15/2022 03:42:00 PM
Today, in the Calculated Risk Real Estate Newsletter: Early Read on Existing Home Sales in June
A brief excerpt:
From housing economist Tom Lawler:There is much more in the article. You can subscribe at https://calculatedrisk.substack.com/
Based on publicly available local realtor/MLS reports released across the country through today, I project that existing home sales as estimated by the National Association of Realtors ran at a seasonally adjusted annual rate of 5.12 million in June, down 5.4% from May’s preliminary pace and down 14.2% from last June’s seasonally adjusted pace.
...
CR Notes:
With a new holiday this year in June, Juneteenth, it is possible the seasonal adjustment will be off a little. However, the local markets I track suggest a significant year-over-year decline in NSA sales for June.
The National Association of Realtors® (NAR) is schedule to release June existing home sales on Wednesday, July 20th at 10:00 AM ET. The consensus is for 5.40 million SAAR, down from 5.41 million last month. Based on Tom Lawler’s estimate, we should expect a large negative surprise.
Q2 GDP Forecasts: Slightly Negative
by Calculated Risk on 7/15/2022 12:28:00 PM
Note: We've seen two consecutive quarters of negative GDP before without a recession (that isn't the definition). If Q2 is negative, it will mostly be due to inventory and trade issues. No worries. My view is the US economy is not currently in a recession, see: Predicting the Next Recession
From BofA:
Incoming data pushed our tracking estimate for 2Q growth lower by 0.3pp to -1.4% qoq saar [July 15 estimate]From Goldman:
emphasis added
We left our Q2 GDP tracking estimate unchanged at +0.7% (qoq ar). [July 15 estimate]And from the Altanta Fed: GDPNow
The GDPNow model estimate for real GDP growth (seasonally adjusted annual rate) in the second quarter of 2022 is -1.5 percent on July 15, down from -1.2 percent on July 8. [July 15 estimate]
Industrial Production Decreased 0.2 Percent in June
by Calculated Risk on 7/15/2022 09:21:00 AM
From the Fed: Industrial Production and Capacity Utilization
Total industrial production moved down 0.2 percent in June but advanced at an annual rate of 6.1 percent for the second quarter as a whole. Manufacturing output declined 0.5 percent for a second consecutive month in June; even so, it rose at an annual rate of 4.2 percent in the second quarter. In June, the index for mining advanced 1.7 percent, while the index for utilities fell 1.4 percent. At 104.4 percent of its 2017 average, total industrial production in June was 4.2 percent above its year-earlier level. Capacity utilization decreased 0.3 percentage point in June to 80.0 percent, a rate that is 0.4 percentage point above its long-run (1972–2021) average.
emphasis added
 Click on graph for larger image.
This graph shows Capacity Utilization. This series is up from the record low set in April 2020, and above the level in February 2020 (pre-pandemic).
Capacity utilization at 80.0% is 0.4% above the average from 1972 to 2021. This was below consensus expectations.
Note: y-axis doesn't start at zero to better show the change.
 The second graph shows industrial production since 1967.
Industrial production decreased in June to 105.7. This is above the pre-pandemic level.
The change in industrial production was below consensus expectations.
Retail Sales Increased 1.0% in June
by Calculated Risk on 7/15/2022 08:39:00 AM
On a monthly basis, retail sales increased 1.0% from May to June (seasonally adjusted), and sales were up 8.4 percent from June 2021.
From the Census Bureau report:
Advance estimates of U.S. retail and food services sales for June 2022, adjusted for seasonal variation and holiday and trading-day differences, but not for price changes, were $680.6 billion, an increase of 1.0 percent from the previous month, and 8.4 percent above June 2021. ... The April 2022 to May 2022 percent change was revised from down 0.3 percent to down 0.1 percent.
emphasis added
 Click on graph for larger image.
This graph shows retail sales since 1992. This is monthly retail sales and food service, seasonally adjusted (total and ex-gasoline).
Retail sales ex-gasoline were up 0.7% in June.
The second graph shows the year-over-year change in retail sales and food service (ex-gasoline) since 1993.
Retail and Food service sales, ex-gasoline, increased by 5.3% on a YoY basis.
 Sales in June were above expectations, and sales in April and May were revised up, combined.
Thursday, July 14, 2022
Friday: Retail Sales, Industrial Production, NY Fed Mfg
by Calculated Risk on 7/14/2022 09:06:00 PM
Friday:
• At 8:30 AM ET, Retail sales for June is scheduled to be released. The consensus is for 0.8% increase in retail sales.
• Also, at 8:30 AM, The New York Fed Empire State manufacturing survey for July. The consensus is for a reading of -2.6, down from -1.2.
• At 9:15 AM, The Fed will release Industrial Production and Capacity Utilization for June. The consensus is for a no change in Industrial Production, and for Capacity Utilization to decrease to 80.4%.
• At 10:00 AM, University of Michigan's Consumer sentiment index (Preliminary for July).
On COVID (focus on hospitalizations and deaths):
Hospitalizations have almost quadrupled from the lows earlier this year.
Click on graph for larger image.
This graph shows the daily (columns) and 7-day average (line) of deaths reported.
| COVID Metrics | ||||
|---|---|---|---|---|
| Now | Week Ago | Goal | ||
| New Cases per Day2🚩 | 124,048 | 107,174 | ≤5,0001 | |
| Hospitalized2🚩 | 32,507 | 29,099 | ≤3,0001 | |
| Deaths per Day2🚩 | 351 | 312 | ≤501 | |
| 1my goals to stop daily posts, 27-day average for Cases, Currently Hospitalized, and Deaths 🚩 Increasing 7-day average week-over-week for Cases, Hospitalized, and Deaths ✅ Goal met. | ||||
Click on graph for larger image.This graph shows the daily (columns) and 7-day average (line) of deaths reported.
Average daily deaths bottomed in July 2021 at 214 per day.
Current State of the Housing Market
by Calculated Risk on 7/14/2022 01:59:00 PM
Today, in the Calculated Risk Real Estate Newsletter: Current State of the Housing Market
A brief excerpt:
This is a market overview for mid-July.There is much more in the article. You can subscribe at https://calculatedrisk.substack.com/
...
Here is a graph using the Altos inventory data of the trend comparing to 2020 and 2019. The dotted red line is the recent trend compared to 2020 - and at the current pace, inventory will be up compared to 2020 in late August. The dashed grey line is comparing to 2019, and based on the current trend, it is possible inventory will be back to 2019 levels by the beginning of 2023.
...We are seeing a clear slowing in the housing market, with more price reductions, more inventory, and fewer sales. It will take some time to see the impact on house price growth, but that is coming too.
Next week, existing home sales will likely show a sharp year-over-year decline in sales for June, and housing starts will probably show further declines (and still a record number of homes under construction).
It is important to remember that housing is a key transmission mechanism for Federal Open Market Committee (FOMC) policy. As long as inflation remains elevated, the Fed will keep raising rates - and that will impact the housing market (although mortgage rates have already jumped in anticipation of the FOMC actions).

Hotels: Occupancy Rate Down 14.5% Compared to Same Week in 2019
by Calculated Risk on 7/14/2022 12:57:00 PM
As expected on the negative side of a holiday calendar shift, U.S. hotel performance came in lower than the previous week, according to STR‘s latest data through July 9.The following graph shows the seasonal pattern for the hotel occupancy rate using the four-week average.
July 3-9 2022 (percentage change from comparable week in 2019*):
• Occupancy: 63.3% (-14.5%)
• Average daily rate (ADR): $153.71 (+15.7%)
• Revenue per available room (RevPAR): $97.37 (-1.1%)
Whereas the previous week’s percentage changes were elevated on the favorable side of the calendar shift, the most recent week was skewed downward due to a comparison with a non-holiday week in 2019. After two consecutive weeks of lower demand around the Fourth of July holiday, the metrics are expected to strengthen for the remaining weeks of July.
*Due to the pandemic impact, STR is measuring recovery against comparable time periods from 2019.
emphasis added
 Click on graph for larger image.
The red line is for 2022, black is 2020, blue is the median, and dashed light blue is for 2021. Dashed purple is 2019 (STR is comparing to a strong year for hotels).
The 4-week average of the occupancy rate is at the median rate for the previous 20 years (Blue).
Note: Y-axis doesn't start at zero to better show the seasonal change.
The 4-week average of the occupancy rate will increase further over the Summer.
LA Port Traffic: Mostly Steady in June
by Calculated Risk on 7/14/2022 10:17:00 AM
Notes: The expansion to the Panama Canal was completed in 2016 (As I noted a few years ago), and some of the traffic that used the ports of Los Angeles and Long Beach is probably going through the canal. This might be impacting TEUs on the West Coast.
Container traffic gives us an idea about the volume of goods being exported and imported - and usually some hints about the trade report since LA area ports handle about 40% of the nation's container port traffic.
The following graphs are for inbound and outbound traffic at the ports of Los Angeles and Long Beach in TEUs (TEUs: 20-foot equivalent units or 20-foot-long cargo container).
To remove the strong seasonal component for inbound traffic, the first graph shows the rolling 12-month average.
 Click on graph for larger image.
On a rolling 12-month basis, inbound traffic increased 0.4% in June compared to the rolling 12 months ending in May. Outbound traffic was down 0.1% compared to the rolling 12 months ending the previous month.
The 2nd graph is the monthly data (with a strong seasonal pattern for imports).
 Usually imports peak in the July to October period as retailers import goods for the Christmas holiday, and then decline sharply and bottom in February or March depending on the timing of the Chinese New Year.
Imports were up 4% YoY in June, and exports were down 2% YoY.
There is no impact - yet - on inbound traffic due to the shutdowns in China.
Weekly Initial Unemployment Claims Increase to 244,000
by Calculated Risk on 7/14/2022 08:33:00 AM
The DOL reported:
In the week ending July 9, the advance figure for seasonally adjusted initial claims was 244,000, an increase of 9,000 from the previous week's unrevised level of 235,000. The 4-week moving average was 235,750, an increase of 3,250 from the previous week's unrevised average of 232,500.The following graph shows the 4-week moving average of weekly claims since 1971.
emphasis added
 Click on graph for larger image.
The dashed line on the graph is the current 4-week average. The four-week average of weekly unemployment claims increased to 235,750.
The previous week was unrevised.
Weekly claims were higher than the consensus forecast


