 RSS Feed
 by Calculated Risk on 2/10/2022 10:44:00 AM
Thursday, February 10, 2022
MBA: "Mortgage Delinquencies Decrease in the Fourth Quarter of 2021"
From the MBA: Mortgage Delinquencies Decrease in the Fourth Quarter of 2021
The delinquency rate for mortgage loans on one-to-four-unit residential properties decreased to a seasonally adjusted rate of 4.65 percent of all loans outstanding at the end of the fourth quarter of 2021, according to the Mortgage Bankers Association’s (MBA) National Delinquency Survey.
For the purposes of the survey, MBA asks servicers to report loans in forbearance as delinquent if the payment was not made based on the original terms of the mortgage. The delinquency rate was down 23 basis points from the third quarter of 2021 and down 208 basis points from one year ago.
“Mortgage delinquencies descended in the final three months of 2021, reaching levels at or below MBA’s survey averages dating back to 1979,” said Marina Walsh, CMB, MBA’s Vice President of Industry Analysis. “The fourth-quarter delinquency rate of 4.65 percent was 67 basis points lower than MBA’s survey average of 5.32 percent. Furthermore, the seriously delinquent rate, the percentage of loans that are 90 days or more past due or in the process of foreclosure, was 2.83 percent in the fourth quarter, close to the long-term average of 2.80 percent.”
Added Walsh, “The quarters right before the COVID-19 pandemic represented some of the lowest delinquencies ever recorded. Delinquencies are now approaching levels not seen since the first quarter of 2020, which is a testament to the strength of the U.S. labor market.”
emphasis added
 Click on graph for larger image.
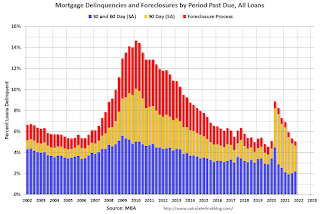
This graph shows the percent of loans delinquent by days past due. Overall delinquencies decreased in Q4.
From the MBA:
Compared to last quarter, the seasonally adjusted mortgage delinquency rate decreased for all loans outstanding. By stage, the 30-day delinquency rate increased 14 basis points to 1.65 percent, the 60-day delinquency rate increased 4 basis points to 0.56 percent, and the 90-day delinquency bucket decreased 41 basis points to 2.44 percent.This sharp increase in 2020 in the 90-day bucket was due to loans in forbearance (included as delinquent, but not reported to the credit bureaus).
...
The delinquency rate includes loans that are at least one payment past due but does not include loans in the process of foreclosure. The percentage of loans in the foreclosure process at the end of the fourth quarter was 0.42 percent, down 4 basis points from the third quarter of 2021 and 14 basis points lower than one year ago. This is the lowest foreclosure inventory rate since the third quarter of 1981. The percentage of loans on which foreclosure actions were started in the fourth quarter rose by 1 basis point to 0.04 percent, up from the survey low seen in third-quarter 2021 at 0.03 percent.
The percent of loans in the foreclosure process declined further and was at the lowest level since 1981.
Weekly Initial Unemployment Claims Decrease to 223,000
by Calculated Risk on 2/10/2022 08:40:00 AM
The DOL reported:
In the week ending February 5, the advance figure for seasonally adjusted initial claims was 223,000, a decrease of 16,000 from the previous week's revised level. The previous week's level was revised up by 1,000 from 238,000 to 239,000. The 4-week moving average was 253,250, a decrease of 2,000 from the previous week's revised average. The previous week's average was revised up by 250 from 255,000 to 255,250.The following graph shows the 4-week moving average of weekly claims since 1971.
emphasis added
 Click on graph for larger image.
The dashed line on the graph is the current 4-week average. The four-week average of weekly unemployment claims decreased to 253,250.
The previous week was revised up.
Weekly claims were lower than the consensus forecast.
BLS: CPI increased 0.6% in January; Core CPI increased 0.6%
by Calculated Risk on 2/10/2022 08:31:00 AM
The Consumer Price Index for All Urban Consumers (CPI-U) increased 0.6 percent in January on a seasonally adjusted basis, the U.S. Bureau of Labor Statistics reported today. Over the last 12 months, the all items index increased 7.5 percent before seasonal adjustment.Both CPI and core CPI were above expectations. I'll post a graph later today after the Cleveland Fed releases the median and trimmed-mean CPI.
Increases in the indexes for food, electricity, and shelter were the largest contributors to the seasonally adjusted all items increase. The food index rose 0.9 percent in January following a 0.5-percent increase in December. The energy index also increased 0.9 percent over the month, with an increase in the electricity index being partially offset by declines in the gasoline index and the natural gas index.
The index for all items less food and energy rose 0.6 percent in January, the same increase as in December. This was the seventh time in the last 10 months it has increased at least 0.5 percent. Along with the index for shelter, the indexes for household furnishings and operations, used cars and trucks, medical care, and apparel were among many indexes that increased over the month.
The all items index rose 7.5 percent for the 12 months ending January, the largest 12-month increase since the period ending February 1982. The all items less food and energy index rose 6.0 percent, the largest 12-month change since the period ending August 1982. The energy index rose 27.0 percent over the last year, and the food index increased 7.0 percent.
emphasis added
Wednesday, February 09, 2022
Thursday: CPI, Initial Unemployment Claims
by Calculated Risk on 2/09/2022 08:14:00 PM
Thursday:
• At 8:30 AM ET, the initial weekly unemployment claims report will be released. The consensus is for a decrease to 235 thousand from 238 thousand last week.
• Also, at 8:30 AM, The Consumer Price Index for January from the BLS. The consensus is for 0.5% increase in CPI, and a 0.5% increase in core CPI.
On COVID (focus on hospitalizations and deaths):
| COVID Metrics | ||||
|---|---|---|---|---|
| Now | Week Ago | Goal | ||
| Percent fully Vaccinated | 64.2% | --- | ≥70.0%1 | |
| Fully Vaccinated (millions) | 213.2 | --- | ≥2321 | |
| New Cases per Day3 | 230,602 | 413,730 | ≤5,0002 | |
| Hospitalized3 | 102,695 | 128,366 | ≤3,0002 | |
| Deaths per Day3 | 2,303 | 2,402 | ≤502 | |
| 1 Minimum to achieve "herd immunity" (estimated between 70% and 85%). 2my goals to stop daily posts, 37-day average for Cases, Currently Hospitalized, and Deaths 🚩 Increasing 7-day average week-over-week for Cases, Hospitalized, and Deaths ✅ Goal met. | ||||
 Click on graph for larger image.
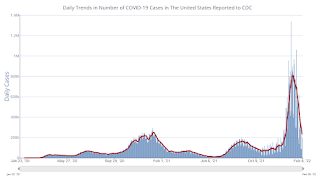
This graph shows the daily (columns) and 7-day average (line) of positive tests reported.
New cases, hospitalizations and deaths are now declining.
2nd Look at Local Housing Markets in January
by Calculated Risk on 2/09/2022 03:09:00 PM
Today, in the Calculated Risk Real Estate Newsletter: 2nd Look at Local Housing Markets in January
A brief excerpt:
Adding Houston, Memphis, Nashville, New Hampshire, North Texas and PortlandThere is much more in the article. You can subscribe at https://calculatedrisk.substack.com/
This is the second look at local markets in January. I’m tracking about 30 local housing markets in the US. Some of the 30 markets are states, and some are metropolitan areas. I’ll update these tables throughout the month as additional data is released.
My view is that if the housing market starts slowing, it will show up in inventory first (not yet!).
The following data is important, especially active inventory. One of the key factors for house prices is supply and tracking local inventory reports will help us understand what is happening with supply.
On a national basis, we are seeing record low inventory over the Winter. I’ll be watching to see if inventory follows the normal seasonal pattern and bottoms in February. Last year, inventory didn’t bottom until April.
...
Here is a summary of active listings for these housing markets in January. Inventory was down 9.5% in January month-over-month (MoM) from December, and down 25.7% year-over-year (YoY).
Inventory almost always declines seasonally during the Winter, so the MoM decline is not a surprise. Last month, these markets were down 24.8% YoY, so the YoY decline in January is slightly larger than in December. This isn’t indicating a slowing market.
Notes for all tables:
New additions to table in BOLD.
Northwest (Seattle), North Texas (Dallas)
Energy expenditures as a percentage of PCE
by Calculated Risk on 2/09/2022 09:25:00 AM
During the early stages of the pandemic, energy expenditures as a percentage of PCE hit an all-time low of 3.3% of PCE. Since then, energy expenditures have increased. Here is an update through the December PCE report.
Below is a graph of expenditures on energy goods and services as a percent of total personal consumption expenditures through December 2021.
This is one of the measures that Professor Hamilton at Econbrowser looks at to evaluate any drag on GDP from energy prices.
Click on graph for larger image.
Data source: BEA.
The huge spikes in energy prices during the oil crisis of 1973 and 1979 are obvious. As is the increase in energy prices during the 2001 through 2008 period.
In general, energy expenditures as a percent of PCE have been trending down for years.

In December 2021, energy expenditures as a percentage of PCE had increased and were at 4.3% of PCE.
This is above the pre-pandemic level in early 2020, but below the levels in 2018.
MBA: Mortgage Applications Decrease in Latest Weekly Survey
by Calculated Risk on 2/09/2022 07:00:00 AM
From the MBA: Mortgage Applications Decrease in Latest MBA Weekly Survey
Mortgage applications decreased 8.1 percent from one week earlier, according to data from the Mortgage Bankers Association’s (MBA) Weekly Mortgage Applications Survey for the week ending February 4, 2022.
... The Refinance Index decreased 7 percent from the previous week and was 52 percent lower than the same week one year ago. The seasonally adjusted Purchase Index decreased 10 percent from one week earlier. The unadjusted Purchase Index decreased 3 percent compared with the previous week and was 12 percent lower than the same week one year ago.
“Mortgage rates continued to edge higher last week, with the 30-year fixed rate climbing to 3.83 percent. Mortgage rates followed the U.S. 10-year yield and other sovereign bonds as the Federal Reserve and other key global central banks responded to growing inflationary pressures and signaled that they will start to remove accommodative policies. With rates 87 basis points higher than the same week a year ago, refinance applications continued to decrease,” said Joel Kan, MBA’s Associate Vice President of Economic and Industry Forecasting. “Purchase activity slowed after the previous week's gain. Both conventional and FHA purchase applications saw proportional declines, resulting in purchase activity overall dropping 10 percent. The average loan size again hit another record high at $446,000. Activity continues to be dominated by larger loan balances, as inventory remains tight for entry-level buyers.”
...
The average contract interest rate for 30-year fixed-rate mortgages with conforming loan balances ($647,200 or less) increased to 3.83 percent from 3.78 percent, with points decreasing to 0.40 from 0.41 (including the origination fee) for 80 percent loan-to-value ratio (LTV) loans.
emphasis added
 Click on graph for larger image.
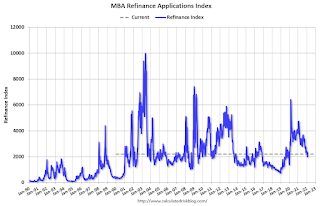
The first graph shows the refinance index since 1990.
With higher mortgage rates, the refinance index has declined sharply over the last several months.
The second graph shows the MBA mortgage purchase index
 According to the MBA, purchase activity is down 12% year-over-year unadjusted.
Note: Red is a four-week average (blue is weekly).
Tuesday, February 08, 2022
COVID February 8, 2022: New Cases and Hospitalizations Declining
by Calculated Risk on 2/08/2022 09:08:00 PM
On COVID (focus on hospitalizations and deaths):
| COVID Metrics | ||||
|---|---|---|---|---|
| Now | Week Ago | Goal | ||
| Percent fully Vaccinated | 64.2% | --- | ≥70.0%1 | |
| Fully Vaccinated (millions) | 213.1 | --- | ≥2321 | |
| New Cases per Day3 | 247,319 | 444,473 | ≤5,0002 | |
| Hospitalized3 | 105,449 | 131,099 | ≤3,0002 | |
| Deaths per Day3🚩 | 2,404 | 2,334 | ≤502 | |
| 1 Minimum to achieve "herd immunity" (estimated between 70% and 85%). 2my goals to stop daily posts, 37-day average for Cases, Currently Hospitalized, and Deaths 🚩 Increasing 7-day average week-over-week for Cases, Hospitalized, and Deaths ✅ Goal met. | ||||
 Click on graph for larger image.
This graph shows the daily (columns) and 7-day average (line) of positive tests reported.
New cases and hospitalizations are now declining.
Leading Index for Commercial Real Estate "Falls in January"
by Calculated Risk on 2/08/2022 04:00:00 PM
From Dodge Data Analytics: Dodge Momentum Index Falls in January
The Dodge Momentum Index declined 7% in January to a four-month low of 152.9 (2000=100), from the revised December reading of 163.7. The Momentum Index, issued by Dodge Construction Network, is a monthly measure of the initial report for nonresidential building projects in planning, which have been shown to lead construction spending for nonresidential buildings by a full year. In January, commercial planning fell 9%, and institutional planning slipped 1%.
The Dodge Momentum Index had a stellar 2021, rising 23% from 2020 and reaching levels not seen in nearly 14 years. The recent string of declines, however, may be blamed on rising costs, logistical problems and shortages of skilled labor. Still, even as it has decreased, the dollar value of projects in planning remains exceptionally strong, especially for education, warehouse and healthcare projects.
emphasis added
 Click on graph for larger image.
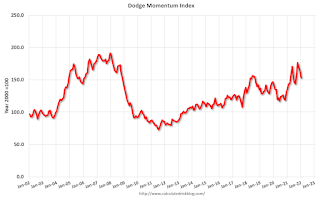
This graph shows the Dodge Momentum Index since 2002. The index was at 152.9 in January, down from 163.7 in December.
According to Dodge, this index leads "construction spending for nonresidential buildings by a full year". This index suggested a decline in Commercial Real Estate construction through most of 2021, but a solid pickup in 2022.
1st Look at Local Housing Markets in January
by Calculated Risk on 2/08/2022 12:26:00 PM
Today, in the Calculated Risk Real Estate Newsletter: 1st Look at Local Housing Markets in January
A brief excerpt:
From the Northwest MLS: Northwest MLS brokers see signs of busy spring market despite slow JanuaryThere is much more in the article. You can subscribe at https://calculatedrisk.substack.com/"When there's uncertainty, the default position for most sellers is to stay put, do nothing, and hunker down," suggested Mike Larson, managing broker at Compass Tacoma. He said many things are contributing to sellers' reluctance to put their homes on the market, "most notably, COVID, inflation, the economy, the holidays, and finding a replacement property. Security and certainty are more important than cashing in on record amounts of equity."And a table of January sales. Sales were down 11.2% YoY, Not Seasonally Adjusted (NSA).


