 RSS Feed
 by Calculated Risk on 10/08/2021 04:14:00 PM
Friday, October 08, 2021
October 8th COVID-19: Over 400 Million Doses Administered
The CDC is the source for all data.
According to the CDC, on Vaccinations. Total doses administered: 400,669,422, as of a week ago 393,756,866, or 0.99 million doses per day.
| COVID Metrics | ||||
|---|---|---|---|---|
| Today | Week Ago | Goal | ||
| Percent fully Vaccinated | 56.3% | 55.7% | ≥70.0%1 | |
| Fully Vaccinated (millions) | 186.9 | 184.9 | ≥2321 | |
| New Cases per Day3 | 93,605 | 106,447 | ≤5,0002 | |
| Hospitalized3 | 62,456 | 72,704 | ≤3,0002 | |
| Deaths per Day3 | 1,421 | 1,554 | ≤502 | |
| 1 Minimum to achieve "herd immunity" (estimated between 70% and 85%). 2my goals to stop daily posts, 37 day average for Cases, Currently Hospitalized, and Deaths 🚩 Increasing 7 day average week-over-week for Cases, Hospitalized, and Deaths ✅ Goal met. | ||||
IMPORTANT: For "herd immunity" most experts believe we need 70% to 85% of the total population fully vaccinated (or already had COVID).
KUDOS to the residents of Vermont that have achieved 70% of total population fully vaccinated: Vermont at 70.1%.
KUDOS also to the residents of the 13 states and D.C. that have achieved 60% of total population fully vaccinated: Connecticut at 69.3%, Maine, Rhode Island, Massachusetts, New Jersey, Maryland, New York, New Mexico, New Hampshire, Washington, Oregon, Virginia, District of Columbia and Colorado at 60.0%.
The following 21 states have between 50% and 59.9% fully vaccinated: California at 59.7%, Minnesota, Hawaii, Pennsylvania, Delaware, Florida, Wisconsin, Texas, Nebraska, Iowa, Illinois, Michigan, Kentucky, South Dakota, Arizona, Kansas, Nevada, Alaska, Utah, North Carolina and Ohio at 50.8%.
Next up (total population, fully vaccinated according to CDC) are Montana at 49.0%, Indiana at 48.9%, Missouri at 48.5% and Oklahoma at 48.3%.
 Click on graph for larger image.
This graph shows the daily (columns) and 7 day average (line) of positive tests reported.
2nd Look at Local Housing Markets in September: Memphis, Nashville, North Texas (Dallas), Northwest (Seattle), Sacramento and Santa Clara (San Jose)
by Calculated Risk on 10/08/2021 02:08:00 PM
Today, in the Newsletter: 2nd Look at Local Housing Markets in September Adding Memphis, Nashville, North Texas (Dallas), Northwest (Seattle), Sacramento and Santa Clara (San Jose)
Please subscribe!
Excerpt:
Excerpt:
Here is a summary of active listings for these housing markets in September. Inventory was up 0.1% in September MoM from August, and down 26.8% YoY.
Inventory in San Diego is at an all time low, whereas inventory in Denver and Sacramento is up more than double from the all time low earlier this year. Sacramento is one of the few areas with inventory up YoY.
Note: New additions to table in BOLD.

Q3 GDP Forecasts: Significant Downgrades
by Calculated Risk on 10/08/2021 12:34:00 PM
Here is a table of some of the forecasts over the last 2+ months. The significant downgrades during the quarter were primarily due to analysts initially underestimating the recent COVID wave, and also the impact of supply chain disruptions.
| Merrill | Goldman | GDPNow | |
|---|---|---|---|
| 7/30/21 | 7.0% | 9.0% | 6.1% |
| 8/20/21 | 4.5% | 5.5% | 6.1% |
| 9/10/21 | 4.5% | 3.5% | 3.7% |
| 9/17/21 | 4.5% | 4.5% | 3.6% |
| 9/24/21 | 4.5% | 4.5% | 3.7% |
| 10/1/21 | 4.1% | 4.25% | 2.3% |
| 10/8/21 | 2.0% | 3.25% | 1.3% |
From BofA Merrill Lynch:
We are taking down 3Q GDP tracking to 2% from 3.8% previously, reflecting a reassessment of equipment and inventories, and the likely soft retail sales data. [Oct 8 estimate]From Goldman Sachs:
emphasis added
Following today’s payroll miss and outright decline in education payrolls, we lowered our Q3 GDP tracking estimate by ¼pp to 3¼% (qoq ar). [Oct 8 estimate]And from the Altanta Fed: GDPNow
The GDPNow model estimate for real GDP growth (seasonally adjusted annual rate) in the third quarter of 2021 is 1.3 percent on October 8 [Oct 8 estimate]
Reis: Apartment Vacancy Rate Decreased Sharply in Q3
by Calculated Risk on 10/08/2021 11:08:00 AM
Reis reported that the apartment vacancy rate was at 4.7% in Q3 2021, down from 5.3% in Q2, and down from 5.1% in Q3 2020. The vacancy rate peaked at 8.0% at the end of 2009, and bottomed at 4.1% in 2016.
 Click on graph for larger image.
This graph shows the apartment vacancy rate starting in 1980. (Annual rate before 1999, quarterly starting in 1999).
Note: Reis is just for large cities.
Reis also reported the asking rents were up 7.5% year-over-year, compared to up 1.2% in Q2.
Reis also reported the asking rents were up 7.5% year-over-year, compared to up 1.2% in Q2.
For some cities, asking rents were up significantly more, especially in areas like Phoenix (up over 20% YoY), and many cities in California and Florida.
Apartment vacancy data courtesy of Reis.
Comments on September Employment Report
by Calculated Risk on 10/08/2021 09:12:00 AM
The headline jobs number in the September employment report was well below expectations, however employment for the previous two months was revised up significantly. The participation rate declined, and the unemployment rate decreased to 4.8%.
Leisure and hospitality gained 74 thousand jobs in September. In March and April of 2020, leisure and hospitality lost 8.2 million jobs, and are now down 1.6 million jobs since February 2020. So leisure and hospitality has now added back about 80% of the jobs lost in March and April 2020.
Construction employment increased 22 thousand, and manufacturing added 26 thousand jobs.
NOTE: State and Local education lost 161 thousand jobs, seasonally adjusted, versus expectations of a solid gain. This was a key contributor to the weak job report.
Earlier: September Employment Report: 194 Thousand Jobs, 4.8% Unemployment Rate
In September, the year-over-year employment change was 5.7 million jobs. This turned positive in April due to the sharp jobs losses in April 2020.
Permanent Job Losers
 Click on graph for larger image.
This graph shows permanent job losers as a percent of the pre-recession peak in employment through the report today. (ht Joe Weisenthal at Bloomberg).
This data is only available back to 1994, so there is only data for three recessions.
In September, the number of permanent job losers decreased to 2.251 million from 2.487 million in August.
In September, the number of permanent job losers decreased to 2.251 million from 2.487 million in August.
These jobs will likely be the hardest to recover, so it is a positive that the number of permanent job losers is declining rapidly.
Prime (25 to 54 Years Old) Participation
 Since the overall participation rate has declined due to cyclical (recession) and demographic (aging population, younger people staying in school) reasons, here is the employment-population ratio for the key working age group: 25 to 54 years old.
The prime working age will be key as the economy recovers.
The 25 to 54 participation rate decreased in September to 81.6% from 81.8% in August, and the 25 to 54 employment population ratio was unchanged at 78.0% from 78.0% in August.
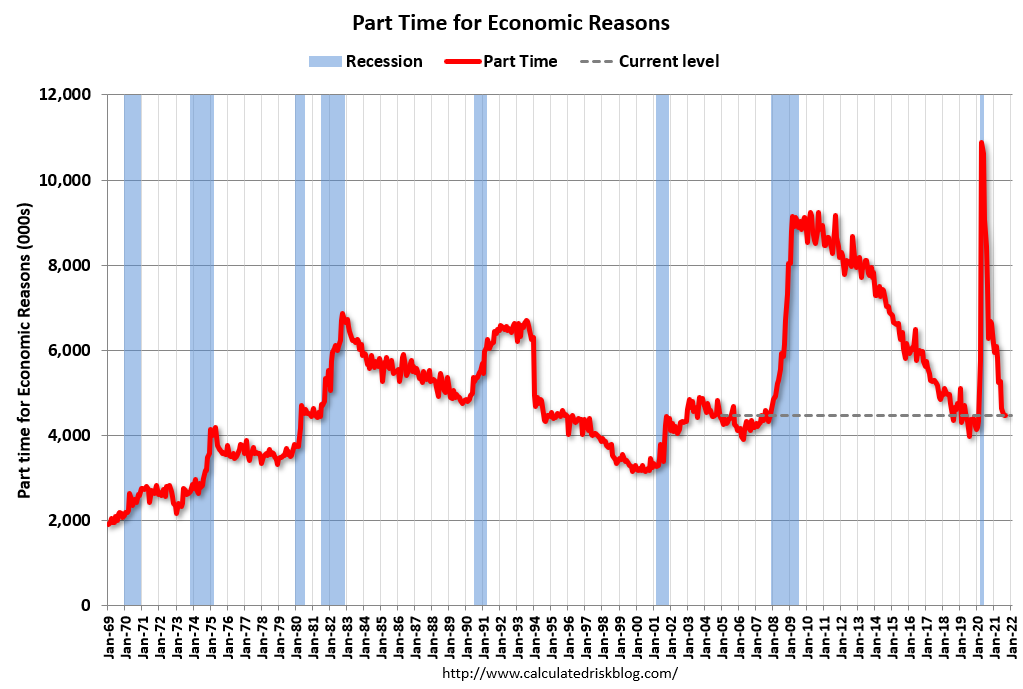
Part Time for Economic Reasons
 From the BLS report:
"In September, the number of persons employed part time for economic reasons, at 4.5 million, was essentially unchanged for the second month in a row. There were 4.4 million persons in this category in February 2020. These individuals, who would have preferred full-time employment, were working part time because their hours had been reduced or they were unable to find full-time jobs."The number of persons working part time for economic reasons was essentially unchanged in September at 4.468 million from 4.469 million in August. This is back close to pre-recession levels.
These workers are included in the alternate measure of labor underutilization (U-6) that decreased to 8.5% from 8.8% in August. This is down from the record high in April 22.9% for this measure since 1994. This measure was at 7.0% in February 2020 (pre-pandemic).
Unemployed over 26 Weeks
 This graph shows the number of workers unemployed for 27 weeks or more.
 According to the BLS, there are 2.683 million workers who have been unemployed for more than 26 weeks and still want a job, down from 3.179 million in August.
This does not include all the people that left the labor force.
Summary:
The headline monthly jobs number was well below expectations, however the previous two months were revised up by 169,000 combined. And the headline unemployment rate decreased to 4.8%.
There was some good news - the decline in the unemployment rate, the decline in permanent job losers, and the decline in long term unemployed - however, there are still 5.0 million fewer jobs than prior to the recession, and overall this was a disappointing report, probably due to the sharp increase in COVID cases in September.
September Employment Report: 194 Thousand Jobs, 4.8% Unemployment Rate
by Calculated Risk on 10/08/2021 08:41:00 AM
From the BLS:
Total nonfarm payroll employment rose by 194,000 in September, and the unemployment rate fell by 0.4 percentage point to 4.8 percent, the U.S. Bureau of Labor Statistics reported today. Notable job gains occurred in leisure and hospitality, in professional and business services, in retail trade, and in transportation and warehousing. Employment in public education declined over the month.
...
The change in total nonfarm payroll employment for July was revised up by 38,000, from +1,053,000 to +1,091,000, and the change for August was revised up by 131,000, from +235,000 to +366,000. With these revisions, employment in July and August combined is 169,000 higher than previously reported.
emphasis added
 Click on graph for larger image.
The first graph shows the year-over-year change in total non-farm employment since 1968.
In September, the year-over-year change was 5.7 million jobs. This was up significantly year-over-year.
Total payrolls increased by 194 thousand in August. Private payrolls increased by 317 thousand.
Payrolls for July and August were revised up 169 thousand, combined.
 The second graph shows the job losses from the start of the employment recession, in percentage terms.
The current employment recession was by far the worst recession since WWII in percentage terms, but currently is not as severe as the worst of the "Great Recession".
The third graph shows the employment population ratio and the participation rate.
 The Labor Force Participation Rate was declined to 61.6% in September, from 61.7% in August. This is the percentage of the working age population in the labor force.
 The Employment-Population ratio increased to 58.7% from 58.5% (black line).
I'll post the 25 to 54 age group employment-population ratio graph later.
 The fourth graph shows the unemployment rate.
 The unemployment rate decreased in September to 4.8% from 5.2% in August.
This was well below consensus expectations, however July and August were revised up by 169,000 combined.
I'll have more later ...
Black Knight: Number of Homeowners in COVID-19-Related Forbearance Plans "Largest Weekly Decline in 12 Months"
by Calculated Risk on 10/08/2021 08:18:00 AM
Note: Both Black Knight and the MBA (Mortgage Bankers Association) are putting out weekly estimates of mortgages in forbearance.
This data is as of October 5th.
From Andy Walden at Black Knight: Largest Weekly Forbearance Decline in 12 Months
We’ve been waiting for a sizable drop in the number of active forbearance plans, given the large number of plans both marked for either review (for extension/removal) or final expiration in September.
Well, this week has brought the first real signs of that. In fact, according to our McDash Flash daily forbearance tracking dataset, the population dropped by 11% since last Tuesday, marking the largest weekly decline in 12 months.
The number of active forbearance plans fell by 177,000 this week with declines seen across all investor classes, led by an 84,000 plan drop among FHA/VA loans. Plans among GSE loans and those held in bank portfolios and private label securities also fell, seeing 50,000 (-11%) and 43,000 (-8%) declines respectively.
As of October 5, 1.39 million mortgage holders remain in COVID-19 related forbearance plans, representing 2.6% of all active mortgages, including 1.4% of GSE, 4.3% of FHA/VA and 3.6% of portfolio held and privately securitized loans.
Click on graph for larger image.
Overall, forbearances have declined by 294,000 (-17%) over the past 30 days, the fastest monthly rate of improvement since October 2020. Plan exits surged then as the first wave of forbearance entrants reached their six-month mark. The folks who’d remained are now reaching the end of their allowable terms.
There are still more than 180,000 plans with September month-end review dates. Keep in mind that this data only covers the last business day in that month and the first three in October. Additional exits are likely in coming weeks as well as servicers continue to work through the large volumes of expirations.
emphasis added

Thursday, October 07, 2021
Friday: Employment Report
by Calculated Risk on 10/07/2021 08:26:00 PM
My August Employment Preview
Goldman September Payrolls Preview
Friday:
• At 8:30 AM, Employment Report for September. The consensus is for 460 thousand jobs added, and for the unemployment rate to decrease to 5.1%.
Hotels: Occupancy Rate Down 9.2% Compared to Same Week in 2019
by Calculated Risk on 10/07/2021 04:16:00 PM
Note: Since occupancy declined sharply at the onset of the pandemic, CoStar is comparing to 2019.
U.S. hotel performance dipped from the previous week, according to STR‘s latest data through Oct. 2.The following graph shows the seasonal pattern for the hotel occupancy rate using the four week average.
26 September through 2 October 2021 (percentage change from comparable week in 2019*):
• Occupancy: 61.7% (-9.2%)
• Average daily rate (ADR): US$130.87 (+1.2%)
• Revenue per available room (RevPAR): US$80.78 (-8.2%)
*Due to the steep, pandemic-driven performance declines of 2020, STR is measuring recovery against comparable time periods from 2019.
emphasis added
 Click on graph for larger image.
The red line is for 2021, black is 2020, blue is the median, dashed purple is 2019, and dashed light blue is for 2009 (the worst year on record for hotels prior to 2020).
Note: Y-axis doesn't start at zero to better show the seasonal change.
The Summer months had decent occupancy with solid leisure travel, and occupancy was only off about 7% in July and August compared to 2019.
But it is uncertain what will happen over the next couple of months with business travel. Usually weekly occupancy increases to around 70% in the weeks following Labor Day due to renewed business travel.
Goldman September Payrolls Preview
by Calculated Risk on 10/07/2021 04:07:00 PM
A few brief excerpts from a note by Goldman Sachs economist Spencer Hill:
We estimate nonfarm payrolls rose 600k in September ... we believe the nationwide expiration of enhanced unemployment benefits on September 5 boosted effective labor supply and job growth ... We are assuming a 200k boost in tomorrow’s numbers and a larger boost in October. We also believe the reopening of schools contributed to September job growth, by around 150k. ... We estimate a one-tenth drop in the unemployment rate to 5.1%CR Note: The consensus is for 460 thousand jobs added, and for the unemployment rate to decrease to 5.1%.
emphasis added


