 RSS Feed
 by Calculated Risk on 5/21/2021 02:31:00 PM
Friday, May 21, 2021
Homebuilder Comments in Mid-May: "Reducing Sales, Limiting Sales"
Some twitter comments from Rick Palacios Jr., Director of Research at John Burns Real Estate Consulting
Here's May mid-month home builder channel check I hinted at earlier. Builders are pushing prices w/little pushback, though some starting. Some builders are using price escalators & highest/best offer. Many limiting pre-sales, shifting to spec, & pricing home later in build cycle.
#Dallas builder: “Not selling build jobs in May, starting specs only, and not selling until drywall. Costs are too out of control for us to take the inflation risk on build jobs. So sales are way down.”
#SanAntonio builder: “Only selling specs at Sheetrock stage. Last month, it was frame stage.”
#Austin builder: “Stopped sales until we pour a foundation. Lumber too erratic to sell prior. I know others have gone to a bid process. I have heard all parties, including that people who win the bid, feel like they have lost.”
#LasVegas builder: “Reducing sales releases in attempt to moderate the impact of labor & material shortages. Homes are priced once a Truss delivery date is confirmed which triggers the lumber lock pricing. We are also considering online auctions, but appraisals are a concern.”
#Denver builder: “Limiting sales at all communities and gapping out on lots. Material availability is becoming more concerning.”
#Phoenix builder: “Metering sales. Could be higher if we released more, but construction can’t keep up & trades are raising costs post start of home, so we are delaying sales releases even further. Delaying release of to-be-built homes & selling only specs deeper in the cycle.”
#SaltLakeCity builder: “Very, very careful with home releases, generally 2 – 4 permits pulled for each subdivision each month. Those homes are not released for sale until the homes are 60-80 days into the construction schedule.”
#Charlotte builder: “No pre-sales as of now. Starting specs and will price at drywall. Sales are still strong but we are starting to see a little bit of a slowdown as we have pushed pricing considerably.”
#Nashville builder: “Prices are starting to flatten out. Sales are down by design as we are not offering presale contracts, & are not writing contracts on inventory homes until they have completed rough ins, with all remaining items confirmed as to availability."
#RaleighDurham builder: “Starting to see some reluctance/concern around home prices balance, to some extent, the buying frenzy that we have seen over the last few months. Continue to raise prices – we get material/labor cost increase notices EVERY SINGLE DAY!”
#Wilmington builder: “Presales are limited & have escalation clause. Not pricing specs until Sheetrock - then they are gone & we wait for next houses to get to drywall. Raising prices across all segments to keep up with cost until the market or appraisal stops us.”
#Atlanta builder: “Locking in costs with purchase orders at time of foundation. Cannot sell a home until foundations go in. Costs are crazy. We are hitting the top of the market in some places and can't push prices. We are seeing margin compression.”
#Birmingham builder: “We have presales turned off in about half our communities to burn through current backlog. We’re holding off sales and using escalation clauses.”
#Charleston builder: “Holding off on selling a home until framing, as that has been our most volatile cost from month to month. We aren't selling to-be-built homes in order to control costs and not commit to a sales price before some of our largest expenses are actualized.”
#Chicago builder: “Many builders are putting everything on hold or putting foundations in the ground and not going any further until they see where costs are headed. Trim, windows and doors supplier says they are starting to feel a slowdown and are preparing for a bigger one.”
#Indianapolis builder: “Not selling/pricing spec inventory until late in the construction process, to account for rising costs. We continue to raise prices on contract builds but have not added escalation clauses.”
#DC builder: “Capping sales by community with few exceptions. We cannot continue to sell further out to future. Limited sales at most communities and raised prices dramatically to keep pace with rising costs.”
#Philadelphia builder: “Holding off opening up some of the new sections until we can catch up to the sales backlog a bit.”
#Tampa builder: “We’re closed for the first half of May. Working on catching up to what we already have. We will significantly limit sales for the next several months.”
#Orlando builder: “Restricting releases to limit quantity of sales while production catches up. Increasing pricing every few sales.”
#Sarasota builder: “Everyone is starting construction on homes after permits are obtained and then quickly hitting unpredictable material shortages, masonry block as one primary example.”
#Jacksonville builder: “Revised all sales contracts, allowing us to adjust base price of home due to cost increases up until time slab is poured. Converting to spec sale program on single-family detached homes as new phases come online this summer.”
#LosAngeles builder: “Waiting to offer homes for sale until we have building permits in hand and can lock lumber pricing.”
#Riverside builder: “We sell out within a week of release. If sales volume drops it’s a result of no inventory. Banging prices each week. Scary high. Costs are stupid high. I’m not saying we’re out of buyers but sales team is telling me that their buyer list is getting smaller."
#SanJose builder: “Doing highest bidder approach at two communities. Seeing $100K over asking at one of them. Buying lumber sooner now, but may push out starting more units with the anticipation of lumber prices coming back down. Costs are eating up all price increases.”
#EastBayCA builder: “Holding back on releasing for sales until we have the phase contracted, so we know what our costs are going to be.”
#Reno builder: “We have gone to ‘Offer & Acceptance’ approach on sales releases where we are able to improve price and terms. This approach has been effective in maintaining our margins and keeping pace with all the increases we are getting." THE END
BLS: April Unemployment rates down in 12 States
by Calculated Risk on 5/21/2021 02:21:00 PM
From the BLS: Regional and State Employment and Unemployment Summary
Unemployment rates were lower in April in 12 states and the District of Columbia and stable in 38 states, the U.S. Bureau of Labor Statistics reported today. Forty-eight states and the District had jobless rate decreases from a year earlier and two states had little change. The national unemployment rate, 6.1 percent, was little changed over the month, but was 8.7 percentage points lower than in April 2020.Hawaii has been impacted by lower levels of tourism.
Nonfarm payroll employment increased in 9 states and the District of Columbia, decreased in 2 states, and was essentially unchanged in 39 states in April 2021. Over the year, nonfarm payroll employment increased in all states and the District.
...
Hawaii had the highest unemployment rate in April, 8.5 percent, followed by California, 8.3 percent, and New Mexico and New York, 8.2 percent each. Nebraska, New Hampshire, South Dakota, and Utah had the lowest rates, 2.8 percent each.
Q2 GDP Forecasts: Around 10%
by Calculated Risk on 5/21/2021 11:36:00 AM
From Merrill Lynch:
Our 2Q GDP tracking remains at 11% qoq saar. [May 21 estimate]From Goldman Sachs:
emphasis added
We left our Q2 GDP tracking estimate unchanged at +10.5% (qoq ar). [May 21 estimate]From the NY Fed Nowcasting Report
The New York Fed Staff Nowcast stands at 4.6% for 2021:Q2. [May 21 estimate]And from the Altanta Fed: GDPNow
The GDPNow model estimate for real GDP growth (seasonally adjusted annual rate) in the second quarter of 2021 is 10.1 percent on May 18, down from 10.5 percent on May 14. [May 18 estimate]
Comments on April Existing Home Sales
by Calculated Risk on 5/21/2021 11:25:00 AM
Earlier: NAR: Existing-Home Sales Decreased to 5.85 million in April
A few key points:
1) This was the highest sales rate for April since 2006, and the 4th highest sales rate for April on record (behind 2004, 2005, and 2006). Some of the increase over the last ten months was probably related to record low mortgage rates, a move away from multi-family rentals, strong second home buying (to escape the high-density cities), a strong stock market and favorable demographics.
Also, the delay in the 2020 buying season pushed the seasonally adjusted number to very high levels over the winter. This means there are going to be some difficult comparisons in the second half of 2021!
2) Inventory is very low, and was down 20.5% year-over-year (YoY) in April. Also, as housing economist Tom Lawler has noted, the local MLS data shows even a larger decline in active inventory (the NAR appears to include some pending sales in inventory). Lawler noted:
"As I’ve noted before, the inventory measure in most publicly-released local realtor/MLS reports excludes listings with pending contracts, but that is not the case for many of the reports sent to the NAR (referred to as the “NAR Report!”), Since the middle of last Spring inventory measures excluding pending listings have fallen much more sharply than inventory measures including such listings, and this latter inventory measure understates the decline in the effective inventory of homes for sale over the last several months."
It seems likely that active inventory is down close to 50% year-over-year.
3) As usual, housing economist Tom Lawler's forecast was closer to the NAR report than the Consensus. The NAR reported 5.85 million SAAR, Lawler estimated the NAR would report 5.96 million SAAR, and the consensus was 6.09 million SAAR.
 Click on graph for larger image.
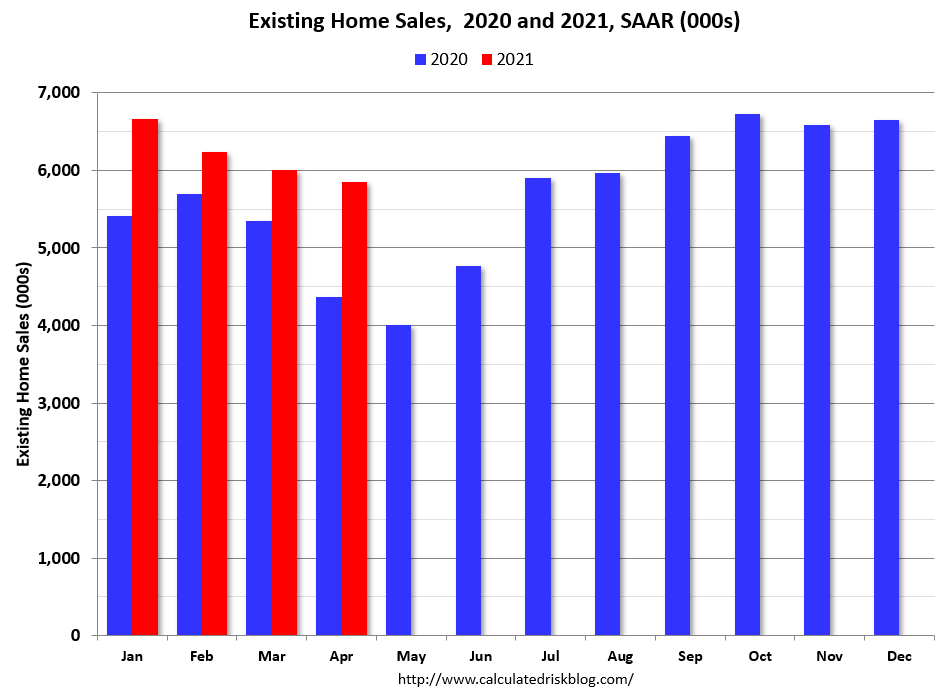
This graph shows existing home sales by month for 2020 and 2021.
The year-over-year comparisons will be easy in May and June, and then difficult in the second half of the year.
The second graph shows existing home sales for each month, Not Seasonally Adjusted (NSA), since 2005.
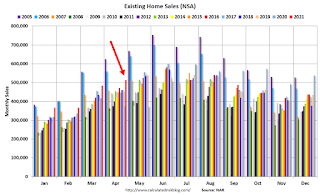 Sales NSA in April (513,000) were 37.5% above sales last year in April (373,000).
This was the highest sales for April (NSA) since 2006.
 Click on graph for larger image.
This graph shows existing home sales by month for 2020 and 2021.
The year-over-year comparisons will be easy in May and June, and then difficult in the second half of the year.
The second graph shows existing home sales for each month, Not Seasonally Adjusted (NSA), since 2005.
 Sales NSA in April (513,000) were 37.5% above sales last year in April (373,000).
This was the highest sales for April (NSA) since 2006.
NAR: Existing-Home Sales Decreased to 5.85 million in April
by Calculated Risk on 5/21/2021 10:13:00 AM
From the NAR: Existing-Home Sales Decline 2.7% in April
Existing-home sales waned in April, marking three straight months of declines, according to the National Association of Realtors®. All but one of the four major U.S. regions witnessed month-over-month drops in home sales, but each registered double-digit year-over-year gains for April.
Total existing-home sales, completed transactions that include single-family homes, townhomes, condominiums and co-ops, slipped 2.7% from March to a seasonally-adjusted annual rate of 5.85 million in April. Sales overall jumped year-over-year, up 33.9% from a year ago (4.37 million in April 2020).
...
Total housing inventory at the end of April amounted to 1.16 million units, up 10.5% from March's inventory and down 20.5% from one year ago (1.46 million). Unsold inventory sits at a 2.4-month supply at the current sales pace, slightly up from March's 2.1-month supply and down from the 4.0-month supply recorded in April 2020. These numbers continue to represent near-record lows. NAR first began tracking the single-family home supply in 1982.
emphasis added
 Click on graph for larger image.
This graph shows existing home sales, on a Seasonally Adjusted Annual Rate (SAAR) basis since 1993.
Sales in April (5.85 million SAAR) were down 2.7% from last month, and were 33.9% above the April 2020 sales rate.
The second graph shows nationwide inventory for existing homes.
 According to the NAR, inventory increased to 1.16 million in April from 1.05 million in March. Headline inventory is not seasonally adjusted, and inventory usually decreases to the seasonal lows in December and January, and peaks in mid-to-late summer.
The last graph shows the year-over-year (YoY) change in reported existing home inventory and months-of-supply. Since inventory is not seasonally adjusted, it really helps to look at the YoY change. Note: Months-of-supply is based on the seasonally adjusted sales and not seasonally adjusted inventory.
 Inventory was down 20.5% year-over-year in April compared to April 2020.
 Months of supply increased to 2.4 months in April from 2.1 months in March.
This was below the consensus forecast. I'll have more later.
Black Knight: Number of Homeowners in COVID-19-Related Forbearance Plans Increased Slightly
by Calculated Risk on 5/21/2021 08:10:00 AM
Note: Both Black Knight and the MBA (Mortgage Bankers Association) are putting out weekly estimates of mortgages in forbearance.
This data is as of May 18th.
From Black Knight: After Sustained Improvement, Forbearance Volumes Increase
This week, forbearance volumes rose by 16k (+0.74%), which marks only the second increase over the past twelve weeks. The rise this week is attributed to typical mid-month behavior, which had been suppressed in recent months due to strong declines. The 1k (-0.1%) weekly decline in forbearances among GSE loans was more than offset by a 4k (+0.5%) increase among FHA/VA loans and a 13k (+2.2%) increase among portfolio held and privately securitized mortgages.
Click on graph for larger image.
Plan starts were driven up this week thanks mostly to an increase in restart activity, which was expected for the middle of the month and amidst the large volume of removals we’ve seen in recent months. Removals also fell to their lowest level since February, driven by the low volume of review activity that took place this week.
Nearly 190k plans are still listed with May 2021 expirations, providing a moderate opportunity for additional improvements over the next two weeks and more acutely in early June. Another 830k plans are currently slated for review for extension or removal in June, the final quarterly review before early forbearance entrants begin to reach their 18-month plan expirations later this year.
As of May 18, 2.18 million (4.1% of) homeowners remain in COVID-19-related forbearance plans, including 2.4% of GSE loans, 7.3% of FHA/VA loans, and 4.7% of portfolio/PLS loans.
emphasis added

Thursday, May 20, 2021
Friday: Existing Home Sales
by Calculated Risk on 5/20/2021 09:00:00 PM
Friday:
• At 10:00 AM ET, Existing Home Sales for April from the National Association of Realtors (NAR). The consensus is for 6.09 million SAAR, up from 6.01 million. Housing economist Tom Lawler expects the NAR to report sales of 5.96 million SAAR for April.
• Also a10:00 AM, State Employment and Unemployment (Monthly) for April 2021
May 20th COVID-19 New Cases, Hospitalizations, Vaccinations
by Calculated Risk on 5/20/2021 03:41:00 PM
Hopefully everyone is part of the solution and is getting vaccinated!
According to the CDC, on Vaccinations. Total administered: 279,397,250, as of yesterday 277,290,173. Day: 2.11 million. (U.S. Capacity is around 4 million per day)
1) 60.5% of the population over 18 has had at least one dose (70% goal by July 4th).
2) 126.6 million Americans are fully vaccinated (160 million goal by July 4th)
Note: I'll stop posting this daily once all four of these criteria are met:
1) 70% of the population over 18 has had at least one dose of vaccine, and
2) new cases are under 5,000 per day, and
3) hospitalizations are below 3,000, and
4) average daily deaths under 50 (currently 497 per day).
And check out COVID Act Now to see how each state is doing.
Over 10,000 US deaths were reported so far in May due to COVID.
 Click on graph for larger image.
This graph shows the daily (columns) 7 day average (line) of positive tests reported.
This data is from the CDC.
 Click on graph for larger image.
This graph shows the daily (columns) 7 day average (line) of positive tests reported.
This data is from the CDC.
The 7-day average is 27,788, down from 28,881 yesterday, and down sharply from the recent peak of 69,881 on April 13, 2021. This is the lowest since June 18, 2020.
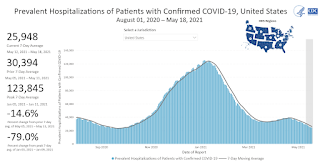
The second graph shows the number of people hospitalized.
 This data is also from the CDC.
The CDC cautions that due to reporting delays, the area in grey will probably increase.
The current 7-day average is 25,948, down from 26,415 reported yesterday, but still above the post-summer surge low of 23,000.
Quarterly Starts by Purpose and Design
by Calculated Risk on 5/20/2021 03:30:00 PM
Along with the monthly housing starts for April this week, the Census Bureau released Quarterly Starts by Purpose and Design through Q1 2021.
This graph shows the NSA quarterly intent for four start categories since 1975: single family built for sale, owner built (includes contractor built for owner), starts built for rent, and condos built for sale.
 Click on graph for larger image.
Single family starts built for sale (red) were up 23% in Q1 2021 compared to Q1 2020. This was the strongest first quarter since 2006.
Owner built starts (orange) were down 13% year-over-year.
Condos built for sale decreased, and are still low.
The 'units built for rent' (blue) and were down 10% in Q1 2021 compared to Q1 2020.
The housing boom has been mostly in single family homes.
Phoenix Real Estate in April: Sales Up 37% YoY, Active Inventory Down 67% YoY
by Calculated Risk on 5/20/2021 02:11:00 PM
Note: I'm tracking data for many local markets around the U.S. I think it is especially important to watch inventory this year. Remember sales were weak in April 2020 due to the pandemic, so the YoY sales comparison is easy.
The Arizona Regional Multiple Listing Service (ARMLS) reports ("Stats Report"):
1) Overall sales were at 9,476 in April, up 36.8% from 6,925 in April 2020.
2) Active inventory was at 4,541, down 67.3% from 13,889 in April 2020.
3) Months of supply decreased to 0.96 in April from 2.59 in April 2020. This is very low.
Inventory in April was up 3.6% from last month.


