 RSS Feed
 by Calculated Risk on 5/21/2021 11:36:00 AM
Friday, May 21, 2021
Q2 GDP Forecasts: Around 10%
From Merrill Lynch:
Our 2Q GDP tracking remains at 11% qoq saar. [May 21 estimate]From Goldman Sachs:
emphasis added
We left our Q2 GDP tracking estimate unchanged at +10.5% (qoq ar). [May 21 estimate]From the NY Fed Nowcasting Report
The New York Fed Staff Nowcast stands at 4.6% for 2021:Q2. [May 21 estimate]And from the Altanta Fed: GDPNow
The GDPNow model estimate for real GDP growth (seasonally adjusted annual rate) in the second quarter of 2021 is 10.1 percent on May 18, down from 10.5 percent on May 14. [May 18 estimate]
Comments on April Existing Home Sales
by Calculated Risk on 5/21/2021 11:25:00 AM
Earlier: NAR: Existing-Home Sales Decreased to 5.85 million in April
A few key points:
1) This was the highest sales rate for April since 2006, and the 4th highest sales rate for April on record (behind 2004, 2005, and 2006). Some of the increase over the last ten months was probably related to record low mortgage rates, a move away from multi-family rentals, strong second home buying (to escape the high-density cities), a strong stock market and favorable demographics.
Also, the delay in the 2020 buying season pushed the seasonally adjusted number to very high levels over the winter. This means there are going to be some difficult comparisons in the second half of 2021!
2) Inventory is very low, and was down 20.5% year-over-year (YoY) in April. Also, as housing economist Tom Lawler has noted, the local MLS data shows even a larger decline in active inventory (the NAR appears to include some pending sales in inventory). Lawler noted:
"As I’ve noted before, the inventory measure in most publicly-released local realtor/MLS reports excludes listings with pending contracts, but that is not the case for many of the reports sent to the NAR (referred to as the “NAR Report!”), Since the middle of last Spring inventory measures excluding pending listings have fallen much more sharply than inventory measures including such listings, and this latter inventory measure understates the decline in the effective inventory of homes for sale over the last several months."
It seems likely that active inventory is down close to 50% year-over-year.
3) As usual, housing economist Tom Lawler's forecast was closer to the NAR report than the Consensus. The NAR reported 5.85 million SAAR, Lawler estimated the NAR would report 5.96 million SAAR, and the consensus was 6.09 million SAAR.
 Click on graph for larger image.
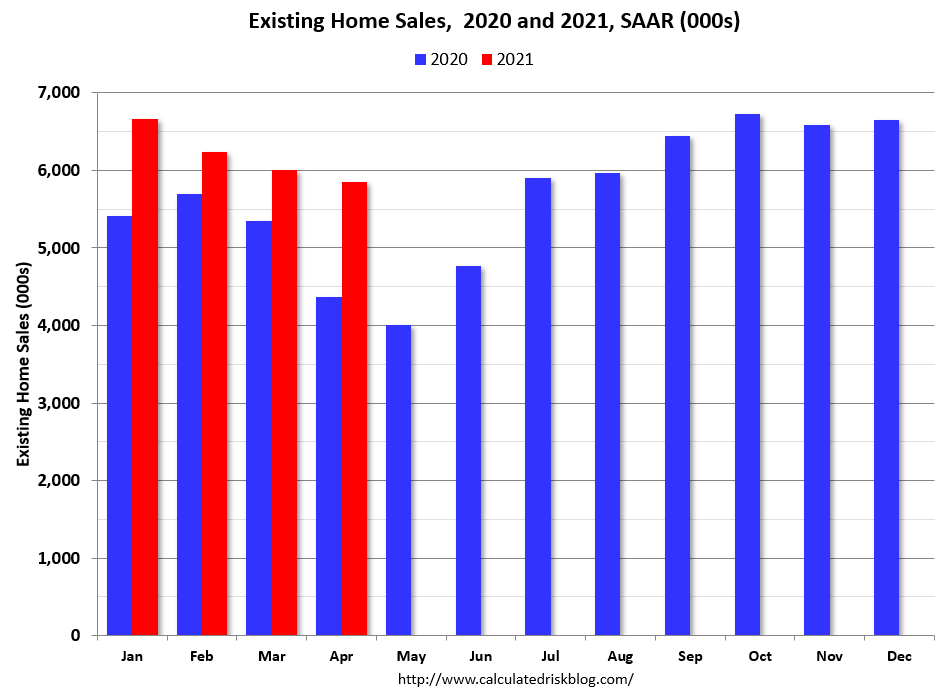
This graph shows existing home sales by month for 2020 and 2021.
The year-over-year comparisons will be easy in May and June, and then difficult in the second half of the year.
The second graph shows existing home sales for each month, Not Seasonally Adjusted (NSA), since 2005.
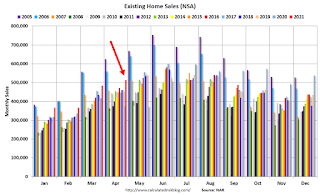 Sales NSA in April (513,000) were 37.5% above sales last year in April (373,000).
This was the highest sales for April (NSA) since 2006.
 Click on graph for larger image.
This graph shows existing home sales by month for 2020 and 2021.
The year-over-year comparisons will be easy in May and June, and then difficult in the second half of the year.
The second graph shows existing home sales for each month, Not Seasonally Adjusted (NSA), since 2005.
 Sales NSA in April (513,000) were 37.5% above sales last year in April (373,000).
This was the highest sales for April (NSA) since 2006.
NAR: Existing-Home Sales Decreased to 5.85 million in April
by Calculated Risk on 5/21/2021 10:13:00 AM
From the NAR: Existing-Home Sales Decline 2.7% in April
Existing-home sales waned in April, marking three straight months of declines, according to the National Association of Realtors®. All but one of the four major U.S. regions witnessed month-over-month drops in home sales, but each registered double-digit year-over-year gains for April.
Total existing-home sales, completed transactions that include single-family homes, townhomes, condominiums and co-ops, slipped 2.7% from March to a seasonally-adjusted annual rate of 5.85 million in April. Sales overall jumped year-over-year, up 33.9% from a year ago (4.37 million in April 2020).
...
Total housing inventory at the end of April amounted to 1.16 million units, up 10.5% from March's inventory and down 20.5% from one year ago (1.46 million). Unsold inventory sits at a 2.4-month supply at the current sales pace, slightly up from March's 2.1-month supply and down from the 4.0-month supply recorded in April 2020. These numbers continue to represent near-record lows. NAR first began tracking the single-family home supply in 1982.
emphasis added
 Click on graph for larger image.
This graph shows existing home sales, on a Seasonally Adjusted Annual Rate (SAAR) basis since 1993.
Sales in April (5.85 million SAAR) were down 2.7% from last month, and were 33.9% above the April 2020 sales rate.
The second graph shows nationwide inventory for existing homes.
 According to the NAR, inventory increased to 1.16 million in April from 1.05 million in March. Headline inventory is not seasonally adjusted, and inventory usually decreases to the seasonal lows in December and January, and peaks in mid-to-late summer.
The last graph shows the year-over-year (YoY) change in reported existing home inventory and months-of-supply. Since inventory is not seasonally adjusted, it really helps to look at the YoY change. Note: Months-of-supply is based on the seasonally adjusted sales and not seasonally adjusted inventory.
 Inventory was down 20.5% year-over-year in April compared to April 2020.
 Months of supply increased to 2.4 months in April from 2.1 months in March.
This was below the consensus forecast. I'll have more later.
Black Knight: Number of Homeowners in COVID-19-Related Forbearance Plans Increased Slightly
by Calculated Risk on 5/21/2021 08:10:00 AM
Note: Both Black Knight and the MBA (Mortgage Bankers Association) are putting out weekly estimates of mortgages in forbearance.
This data is as of May 18th.
From Black Knight: After Sustained Improvement, Forbearance Volumes Increase
This week, forbearance volumes rose by 16k (+0.74%), which marks only the second increase over the past twelve weeks. The rise this week is attributed to typical mid-month behavior, which had been suppressed in recent months due to strong declines. The 1k (-0.1%) weekly decline in forbearances among GSE loans was more than offset by a 4k (+0.5%) increase among FHA/VA loans and a 13k (+2.2%) increase among portfolio held and privately securitized mortgages.
Click on graph for larger image.
Plan starts were driven up this week thanks mostly to an increase in restart activity, which was expected for the middle of the month and amidst the large volume of removals we’ve seen in recent months. Removals also fell to their lowest level since February, driven by the low volume of review activity that took place this week.
Nearly 190k plans are still listed with May 2021 expirations, providing a moderate opportunity for additional improvements over the next two weeks and more acutely in early June. Another 830k plans are currently slated for review for extension or removal in June, the final quarterly review before early forbearance entrants begin to reach their 18-month plan expirations later this year.
As of May 18, 2.18 million (4.1% of) homeowners remain in COVID-19-related forbearance plans, including 2.4% of GSE loans, 7.3% of FHA/VA loans, and 4.7% of portfolio/PLS loans.
emphasis added

Thursday, May 20, 2021
Friday: Existing Home Sales
by Calculated Risk on 5/20/2021 09:00:00 PM
Friday:
• At 10:00 AM ET, Existing Home Sales for April from the National Association of Realtors (NAR). The consensus is for 6.09 million SAAR, up from 6.01 million. Housing economist Tom Lawler expects the NAR to report sales of 5.96 million SAAR for April.
• Also a10:00 AM, State Employment and Unemployment (Monthly) for April 2021
May 20th COVID-19 New Cases, Hospitalizations, Vaccinations
by Calculated Risk on 5/20/2021 03:41:00 PM
Hopefully everyone is part of the solution and is getting vaccinated!
According to the CDC, on Vaccinations. Total administered: 279,397,250, as of yesterday 277,290,173. Day: 2.11 million. (U.S. Capacity is around 4 million per day)
1) 60.5% of the population over 18 has had at least one dose (70% goal by July 4th).
2) 126.6 million Americans are fully vaccinated (160 million goal by July 4th)
Note: I'll stop posting this daily once all four of these criteria are met:
1) 70% of the population over 18 has had at least one dose of vaccine, and
2) new cases are under 5,000 per day, and
3) hospitalizations are below 3,000, and
4) average daily deaths under 50 (currently 497 per day).
And check out COVID Act Now to see how each state is doing.
Over 10,000 US deaths were reported so far in May due to COVID.
 Click on graph for larger image.
This graph shows the daily (columns) 7 day average (line) of positive tests reported.
This data is from the CDC.
 Click on graph for larger image.
This graph shows the daily (columns) 7 day average (line) of positive tests reported.
This data is from the CDC.
The 7-day average is 27,788, down from 28,881 yesterday, and down sharply from the recent peak of 69,881 on April 13, 2021. This is the lowest since June 18, 2020.
The second graph shows the number of people hospitalized.
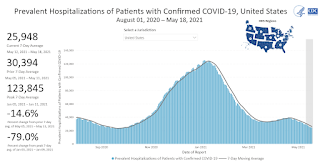 This data is also from the CDC.
The CDC cautions that due to reporting delays, the area in grey will probably increase.
The current 7-day average is 25,948, down from 26,415 reported yesterday, but still above the post-summer surge low of 23,000.
Quarterly Starts by Purpose and Design
by Calculated Risk on 5/20/2021 03:30:00 PM
Along with the monthly housing starts for April this week, the Census Bureau released Quarterly Starts by Purpose and Design through Q1 2021.
This graph shows the NSA quarterly intent for four start categories since 1975: single family built for sale, owner built (includes contractor built for owner), starts built for rent, and condos built for sale.
 Click on graph for larger image.
Single family starts built for sale (red) were up 23% in Q1 2021 compared to Q1 2020. This was the strongest first quarter since 2006.
Owner built starts (orange) were down 13% year-over-year.
Condos built for sale decreased, and are still low.
The 'units built for rent' (blue) and were down 10% in Q1 2021 compared to Q1 2020.
The housing boom has been mostly in single family homes.
Phoenix Real Estate in April: Sales Up 37% YoY, Active Inventory Down 67% YoY
by Calculated Risk on 5/20/2021 02:11:00 PM
Note: I'm tracking data for many local markets around the U.S. I think it is especially important to watch inventory this year. Remember sales were weak in April 2020 due to the pandemic, so the YoY sales comparison is easy.
The Arizona Regional Multiple Listing Service (ARMLS) reports ("Stats Report"):
1) Overall sales were at 9,476 in April, up 36.8% from 6,925 in April 2020.
2) Active inventory was at 4,541, down 67.3% from 13,889 in April 2020.
3) Months of supply decreased to 0.96 in April from 2.59 in April 2020. This is very low.
Inventory in April was up 3.6% from last month.
Hotels: Occupancy Rate Down 16% Compared to Same Week in 2019
by Calculated Risk on 5/20/2021 11:19:00 AM
Note: The year-over-year occupancy comparisons are easy, since occupancy declined sharply at the onset of the pandemic. However, occupancy is still down significantly from normal levels.
The occupancy rate is down 16.4% compared to the same week in 2019.
U.S. weekly hotel occupancy reached its second-highest level since the start of the pandemic, according to STR‘s latest data through May 15.The following graph shows the seasonal pattern for the hotel occupancy rate using the four week average.
May 9-15, 2021 (percentage change from comparable week in 2019*):
• Occupancy: 59.1% (-16.4%)
• Average daily rate (ADR): US$113.54 (-15.4%)
• Revenue per available room (RevPAR): US$67.05 (-29.2%)
Friday/Saturday occupancy came in higher than any weekend since Valentine’s Day weekend in 2020. Additionally, ADR reached its highest point of the pandemic but was still US$20 less than the corresponding week in 2019.
emphasis added
 Click on graph for larger image.
The red line is for 2021, black is 2020, blue is the median, and dashed light blue is for 2009 (the worst year on record for hotels prior to 2020).
Occupancy is now slightly above the horrible 2009 levels.
Note: Y-axis doesn't start at zero to better show the seasonal change.
Note: Y-axis doesn't start at zero to better show the seasonal change.
Black Knight: National Mortgage Delinquency Rate Decreased in April
by Calculated Risk on 5/20/2021 10:13:00 AM
Note: A year ago, in April 2020, the delinquency rate increased sharply (see table below). Loans in forbearance are counted as delinquent in this survey, but those loans are not reported as delinquent to the credit bureaus.
From Black Knight: Black Knight’s First Look: Mortgage Delinquencies Decline Another 7% in April; At Current Rate of Improvement, Delinquencies to Return to Pre-Pandemic Levels By Year’s End
• The number of past-due mortgages improved again in April, as the national delinquency rate fell to 4.66% from 5.02% in MarchAccording to Black Knight's First Look report, the percent of loans delinquent decreased 7.1% in April compared to March, and decreased 27% year-over-year.
• New delinquencies rose 23% from March's record lows, but are down 33% from April 2019, while more than 400,000 (14% of) homeowners past-due on their mortgages became current on payments
• Serious delinquencies (loans 90 or more days past due but not yet in foreclosure) saw strong improvement as well, falling by 151,000 for the month
• Nearly 1.8 million first-lien mortgages remain seriously delinquent, 1.3 million more than there were heading into the pandemic
• Both foreclosure starts and active foreclosure inventory hit new record lows once again in April as both moratoriums and borrower forbearance plan participation continue to limit activity
• Mortgage prepayments fell nearly 23% in April to their lowest level since May 2020, reflecting the impact on refinance activity of interest rate spikes earlier this year
• Black Knight’s April Originations Market Monitor report also showed that rate locks have fallen further over the past month, suggesting prepay volumes will likely be muted in the months to come
emphasis added
The percent of loans in the foreclosure process decreased 6.3% in April and were down 29% over the last year.
Black Knight reported the U.S. mortgage delinquency rate (loans 30 or more days past due, but not in foreclosure) was 4.66% in April, down from 5.02% in March.
The percent of loans in the foreclosure process decreased in April to 0.29%, from 0.30% in March.
The number of delinquent properties, but not in foreclosure, is down 900,000 properties year-over-year, and the number of properties in the foreclosure process is down 58,000 properties year-over-year.
| Black Knight: Percent Loans Delinquent and in Foreclosure Process | ||||
|---|---|---|---|---|
| Apr 2021 | Mar 2021 | Apr 2020 | Apr 2019 | |
| Delinquent | 4.66% | 5.02% | 6.45% | 3.47% |
| In Foreclosure | 0.29% | 0.30% | 0.40% | 0.50% |
| Number of properties: | ||||
| Number of properties that are delinquent, but not in foreclosure: | 2,500,000 | 2,676,000 | 3,400,000 | 1,812,000 |
| Number of properties in foreclosure pre-sale inventory: | 153,000 | 162,000 | 211,000 | 259,000 |
| Total Properties | 2,653,000 | 2,838,000 | 3,611,000 | 2,072,000 |


