 RSS Feed
 by Calculated Risk on 4/25/2021 06:21:00 PM
Sunday, April 25, 2021
Sunday Night Futures
Weekend:
• Schedule for Week of April 25, 2021
• FOMC Preview
Monday:
• At 8:30 AM ET, Durable Goods Orders for March from the Census Bureau. The consensus is for a 2.5% increase in durable goods orders.
• At 10:30 AM, Dallas Fed Survey of Manufacturing Activity for April.
From CNBC: Pre-Market Data and Bloomberg futures S&P 500 and DOW futures are down slightly (fair value).
Oil prices were down over the last week with WTI futures at $62.15 per barrel and Brent at $66.12 per barrel. A year ago, WTI was at $12, and Brent was at $15 - so WTI oil prices are UP sharply year-over-year (oil prices collapsed at the beginning of the pandemic).
Here is a graph from Gasbuddy.com for nationwide gasoline prices. Nationally prices are at $2.87 per gallon. A year ago prices were at $1.74 per gallon, so gasoline prices are up $1.13 per gallon year-over-year.
April 25th COVID-19 Vaccinations, New Cases, Hospitalizations; 7-Day Average Cases Lowest Since March 23rd
by Calculated Risk on 4/25/2021 03:54:00 PM
Note: I'm looking forward to not posting this daily! I've been posting this data daily for over a year, and I'll stop once all three of these criteria are met:
1) 70% of the population over 18 has had at least one dose of vaccine,
2) new cases are under 5,000 per day, and
3) hospitalizations are below 3,000.
According to the CDC, 228.7 million doses have been administered. 36.5% of the population over 18 is fully vaccinated, and 53.6% of the population over 18 has had at least one dose (138.3 million people over 18 have had at least one dose).
And check out COVID Act Now to see how each state is doing.
Over 16,500 US deaths were reported so far in April due to COVID.
 Click on graph for larger image.
This graph shows the daily (columns) 7 day average (line) of positive tests reported.
Note: The ups and downs during the Winter surge were related to reporting delays due to the Thanksgiving and Christmas holidays.
This data is from the CDC.
 Click on graph for larger image.
This graph shows the daily (columns) 7 day average (line) of positive tests reported.
Note: The ups and downs during the Winter surge were related to reporting delays due to the Thanksgiving and Christmas holidays.
This data is from the CDC.
The 7-day average is 57,123, down from 59,563 yesterday, and down from the recent peak of 69,878 on April 13, 2021. This is also below the summer surge peak of 67,337 on July 23, 2020.
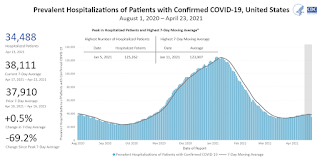
The second graph shows the number of people hospitalized.
 This data is also from the CDC.
The CDC cautions that due to reporting delays, the area in grey will probably increase.
The second graph shows the number of people hospitalized.
 This data is also from the CDC.
The CDC cautions that due to reporting delays, the area in grey will probably increase.
The current 7-day average is 38,111, down from 38,553 reported yesterday, and well above the post-summer surge low of 23,000.
FOMC Preview
by Calculated Risk on 4/25/2021 09:39:00 AM
Expectations are there will be no change to rate policy when the FOMC meets on Tuesday and Wednesday this week.
Here are some comments from Goldman Sachs economists:
"[W]e expect the April FOMC statement to feature a more upbeat description of recent economic activity. But beyond that, next week’s meeting should be uneventful. ...We expect the FOMC to start hinting at tapering in the second half of this year and to begin tapering in early 2022. Our working assumption is that the pace of tapering will be $15bn per meeting, in which case it would take eight meetings or one year to complete."And from Merrill Lynch economists:
emphasis added
At the April FOMC meeting, we expect Chair Powell and the FOMC to give a more positive view of the economy but reiterate that risks remain from the virus and further progress is needed before a shift in policy.No projections will be released at this meeting. However, for review, here are the March FOMC projections.
Wall Street forecasts are for GDP to increase at a 6.5% annual rate in Q1 (to be released this coming Thursday). For the year, from Goldman Sachs projects: "We have raised our GDP forecast to reflect the latest fiscal policy news and now expect 8% growth in 2021 (Q4/Q4) and an unemployment rate of 4% at end-2021". And Merrill Lynch expects Q4 2021 over Q4 2020 real growth of 7.5%.
So the FOMC projections are still on the low side compared to Wall Street.
1 Projections of change in real GDP and inflation are from the fourth quarter of the previous year to the fourth quarter of the year indicated.
The unemployment rate was at 6.0% in March.
| GDP projections of Federal Reserve Governors and Reserve Bank presidents, Change in Real GDP1 | ||||
|---|---|---|---|---|
| Projection Date | 2021 | 2022 | 2023 | |
| Mar 2021 | 5.8 to 6.6 | 3.0 to 3.8 | 2.0 to 2.5 | |
The unemployment rate was at 6.0% in March.
Note that the unemployment rate doesn't remotely capture the economic damage to the labor market. Not only are there 8.4 million people unemployed, over 4 million people have left the labor force since January 2020. And millions more are being supported by various provisions of the various disaster relief acts.
2 Projections for the unemployment rate are for the average civilian unemployment rate in the fourth quarter of the year indicated.
The decline in the unemployment rate depends on both job growth, and the participation rate. A strong labor market will probably encourage people to return to the labor force, and the improvements in the unemployment rate might be slower than some expect.
As of February 2021, PCE inflation was up 1.6% from February 2020.
PCE core inflation was up 1.4% in February year-over-year.
My guess is core PCE inflation (year-over-year) will increase in 2021, but I think too much inflation will NOT be a concern in 2021. Since we saw negative MoM PCE and core PCE reading in March and April, we should ignore a jump in YoY inflation in March, April and May! There are also supply constraints that will push up prices in the near term, but should be temporary.
| Unemployment projections of Federal Reserve Governors and Reserve Bank presidents, Unemployment Rate2 | ||||
|---|---|---|---|---|
| Projection Date | 2021 | 2022 | 2023 | |
| Mar 2021 | 4.2 to 4.7 | 3.6 to 4.0 | 3.2 to 3.8 | |
The decline in the unemployment rate depends on both job growth, and the participation rate. A strong labor market will probably encourage people to return to the labor force, and the improvements in the unemployment rate might be slower than some expect.
As of February 2021, PCE inflation was up 1.6% from February 2020.
| Inflation projections of Federal Reserve Governors and Reserve Bank presidents, PCE Inflation1 | ||||
|---|---|---|---|---|
| Projection Date | 2021 | 2022 | 2023 | |
| Mar 2021 | 2.2 to 2.4 | 1.8 to 2.1 | 2.0 to 2.2 | |
PCE core inflation was up 1.4% in February year-over-year.
| Core Inflation projections of Federal Reserve Governors and Reserve Bank presidents, Core Inflation1 | ||||
|---|---|---|---|---|
| Projection Date | 2021 | 2022 | 2023 | |
| Mar 2021 | 2.0 to 2.3 | 1.9 to 2.1 | 2.0 to 2.2 | |
My guess is core PCE inflation (year-over-year) will increase in 2021, but I think too much inflation will NOT be a concern in 2021. Since we saw negative MoM PCE and core PCE reading in March and April, we should ignore a jump in YoY inflation in March, April and May! There are also supply constraints that will push up prices in the near term, but should be temporary.
Saturday, April 24, 2021
April 24th COVID-19 Vaccinations, New Cases, Hospitalizations
by Calculated Risk on 4/24/2021 04:51:00 PM
Note: I'm looking forward to not posting this daily! I've been posting this data daily for over a year, and I'll stop once all three of these criteria are met:
1) 70% of the population over 18 has had at least one dose of vaccine,
2) new cases are under 5,000 per day, and
3) hospitalizations are below 3,000.
According to the CDC, 225.6 million doses have been administered. 35.9% of the population over 18 is fully vaccinated, and 53.1% of the population over 18 has had at least one dose (137.0 million people over 18 have had at least one dose).
And check out COVID Act Now to see how each state is doing.
16,000 US deaths were reported so far in April due to COVID.
 Click on graph for larger image.
This graph shows the daily (columns) 7 day average (line) of positive tests reported.
Note: The ups and downs during the Winter surge were related to reporting delays due to the Thanksgiving and Christmas holidays.
This data is from the CDC.
 Click on graph for larger image.
This graph shows the daily (columns) 7 day average (line) of positive tests reported.
Note: The ups and downs during the Winter surge were related to reporting delays due to the Thanksgiving and Christmas holidays.
This data is from the CDC.
The 7-day average is 59,563, down from 61,525 yesterday, and down from the recent peak of 69,878 on April 13, 2021. This is also below the summer surge peak of 67,337 on July 23, 2020.
The second graph shows the number of people hospitalized.
 This data is also from the CDC.
The CDC cautions that due to reporting delays, the area in grey will probably increase.
The second graph shows the number of people hospitalized.
 This data is also from the CDC.
The CDC cautions that due to reporting delays, the area in grey will probably increase.
The current 7-day average is 38,553, down from 38,683 reported yesterday, and well above the post-summer surge low of 23,000.
Schedule for Week of April 25, 2021
by Calculated Risk on 4/24/2021 08:11:00 AM
The key report scheduled for this week is Q1 GDP.
Other key reports include February Case-Shiller house prices, and Personal Income and Outlays for March.
For manufacturing, the April Dallas and Richmond manufacturing surveys will be released.
The FOMC meets this week, and no change to policy is expected at this meeting.
8:30 AM: Durable Goods Orders for March from the Census Bureau. The consensus is for a 2.5% increase in durable goods orders.
10:30 AM: Dallas Fed Survey of Manufacturing Activity for April.
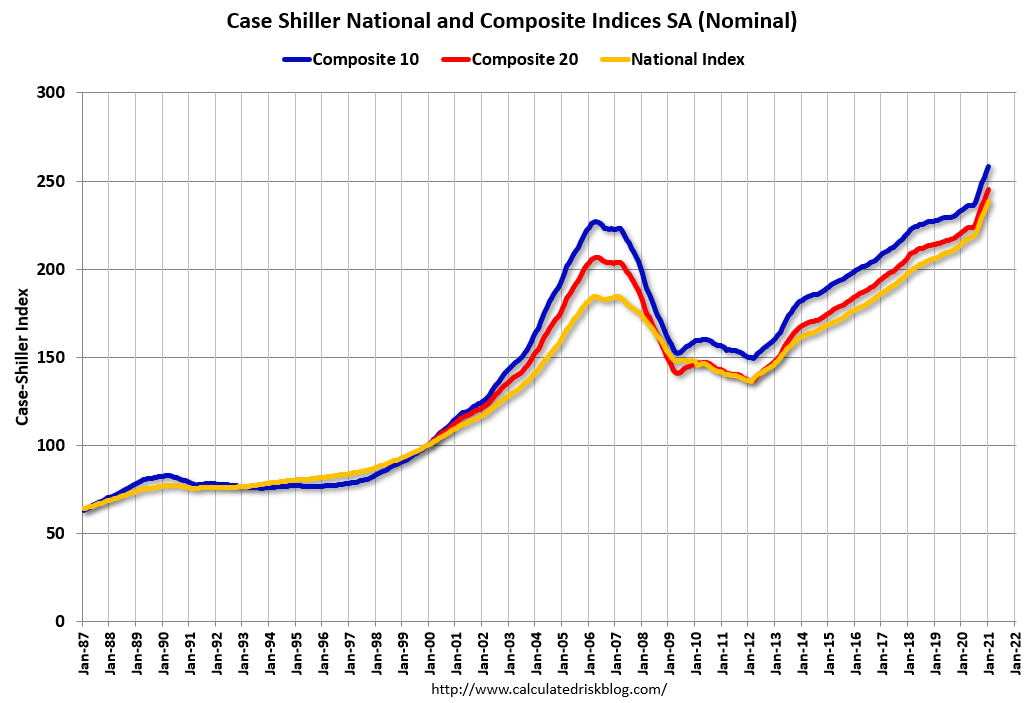 9:00 AM: S&P/Case-Shiller House Price Index for February.
This graph shows the nominal seasonally adjusted National Index, Composite 10 and Composite 20 indexes through the most recent report (the Composite 20 was started in January 2000).
The consensus is for a 11.6% year-over-year increase in the Comp 20 index for February.
9:00 AM: FHFA House Price Index for February. This was originally a GSE only repeat sales, however there is also an expanded index.
10:00 AM: Richmond Fed Survey of Manufacturing Activity for April. This is the last of regional manufacturing surveys for April.
10:00 AM: the Q1 2021 Housing Vacancies and Homeownership from the Census Bureau.
7:00 AM ET: The Mortgage Bankers Association (MBA) will release the results for the mortgage purchase applications index.
2:00 PM: FOMC Meeting Announcement. No change to policy is expected at this meeting.
2:30 PM: Fed Chair Jerome Powell holds a press briefing following the FOMC announcement.
8:30 AM: The initial weekly unemployment claims report will be released. The consensus is for a decrease to 525 thousand from 547 thousand last week.
8:30 AM: Gross Domestic Product, 1st quarter 2021 (Advance estimate). The consensus is that real GDP increased 6.5% annualized in Q1, up from 4.3% in Q4.
10:00 AM: Pending Home Sales Index for March. The consensus is for a 6.0% increase in the index.
8:30 AM ET: Personal Income and Outlays, March 2021. The consensus is for a 20.1% increase in personal income, and for a 4.2% increase in personal spending. And for the Core PCE price index to increase 0.3%.
9:45 AM: Chicago Purchasing Managers Index for April.
10:00 AM: University of Michigan's Consumer sentiment index (Final for April). The consensus is for a reading of 87.5.
Friday, April 23, 2021
April 23rd COVID-19 Vaccinations, New Cases, Hospitalizations
by Calculated Risk on 4/23/2021 05:03:00 PM
Note: I'm looking forward to not posting this daily! I've been posting this data daily for over a year, and I'll stop once all three of these criteria are met:
1) 70% of the population over 18 has had at least one dose of vaccine,
2) new cases are under 5,000 per day, and
3) hospitalizations are below 3,000.
According to the CDC, 222.3 million doses have been administered. 35.2% of the population over 18 is fully vaccinated, and 52.6% of the population over 18 has had at least one dose (135.7 million people over 18 have had at least one dose).
And check out COVID Act Now to see how each state is doing.
Over 15,000 US deaths were reported so far in April due to COVID.
 Click on graph for larger image.
This graph shows the daily (columns) 7 day average (line) of positive tests reported.
Note: The ups and downs during the Winter surge were related to reporting delays due to the Thanksgiving and Christmas holidays.
This data is from the CDC.
 Click on graph for larger image.
This graph shows the daily (columns) 7 day average (line) of positive tests reported.
Note: The ups and downs during the Winter surge were related to reporting delays due to the Thanksgiving and Christmas holidays.
This data is from the CDC.
The 7-day average is 61,303, down from 62,596 yesterday, and down from the recent peak of 69,878 on April 13, 2021. This is also below the summer surge peak of 67,337 on July 23, 2020.
The second graph shows the number of people hospitalized.
 This data is also from the CDC.
The CDC cautions that due to reporting delays, the area in grey will probably increase.
The second graph shows the number of people hospitalized.
 This data is also from the CDC.
The CDC cautions that due to reporting delays, the area in grey will probably increase.
The current 7-day average is 38,683, up from 38,541 reported yesterday, and well above the post-summer surge low of 23,000.
April Vehicle Sales Forecast: "Remain Strong"
by Calculated Risk on 4/23/2021 04:46:00 PM
From WardsAuto: April U.S. Light-Vehicle Sales Steadfastly Remain Strong (pay content)
 Click on graph for larger image.
This graph shows actual sales from the BEA (Blue), and Wards forecast for April (Red).
The Wards forecast of 17.9 million SAAR, would be up less than 1% from last month, and up 105% from a year ago (sales collapsed in March 2020).
Q1 GDP Forecasts: Around 7%
by Calculated Risk on 4/23/2021 11:56:00 AM
Q1 GDP will be released this coming Thursday. The consensus is for real GDP to increase 6.5%, quarter-over-quarter, on a Seasonally Adjusted Annual Rate (SAAR) basis.
Note that the forecasts of the automated systems (based on released data), have caught up with the forecasts of economists, as data for March is released.
From Merrill Lynch:
From Merrill Lynch:
We expect the advance estimate of 1Q 2021 GDP to show an acceleration in growth to an eye-popping 6.5% qoq saar from 4.1% in 4Q 2020 [Apr 23 estimate]From Goldman Sachs:
emphasis added
We left our Q1 GDP tracking estimate unchanged at +7.5% (qoq ar). [Apr 23 estimate]From the NY Fed Nowcasting Report
The New York Fed Staff Nowcast stands at 6.9% for 2021:Q1 and 4.6% for 2021:Q2. [Apr 23 estimate]And from the Altanta Fed: GDPNow
The GDPNow model estimate for real GDP growth (seasonally adjusted annual rate) in the first quarter of 2021 is 8.3 percent on April 16 [Apr 16 estimate]
A few Comments on March New Home Sales
by Calculated Risk on 4/23/2021 10:40:00 AM
New home sales for March were reported at 1,021,000 on a seasonally adjusted annual rate basis (SAAR). Sales for the previous three months were revised up significantly.
This was well above consensus expectations for March and the highest sales rate since 2006.
Clearly low mortgages rates, low existing home supply, and favorable demographics have boosted sales. A surging stock market has probably helped new home sales too.
Earlier: New Home Sales Increase to 1,021,000 Annual Rate in March; Highest Since 2006.
 Click on graph for larger image.
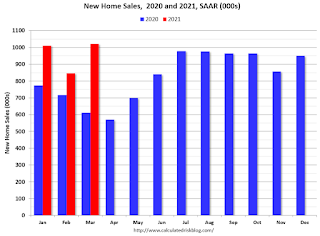
This graph shows new home sales for 2020 and 2021 by month (Seasonally Adjusted Annual Rate).
The year-over-year comparisons are easy in the first half of 2021 - especially in March and April.
However, sales will likely be down year-over-year in August through October - since the selling season was delayed in 2020.
And on inventory: note that completed inventory (3rd graph in previous post) is at record lows, but inventory under construction is closer to normal.
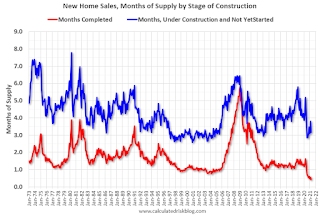 This graph shows the months of supply by stage of construction.
The inventory of completed homes for sale was at 37 thousand in March tying the record low of 37 thousand in 2013 (when sales were much lower). That is about 0.4 months of completed supply (record low).
Earlier: New Home Sales Increase to 1,021,000 Annual Rate in March; Highest Since 2006.
 Click on graph for larger image.
This graph shows new home sales for 2020 and 2021 by month (Seasonally Adjusted Annual Rate).
The year-over-year comparisons are easy in the first half of 2021 - especially in March and April.
However, sales will likely be down year-over-year in August through October - since the selling season was delayed in 2020.
And on inventory: note that completed inventory (3rd graph in previous post) is at record lows, but inventory under construction is closer to normal.
 This graph shows the months of supply by stage of construction.
The inventory of completed homes for sale was at 37 thousand in March tying the record low of 37 thousand in 2013 (when sales were much lower). That is about 0.4 months of completed supply (record low).
The inventory of new homes under construction, and not started, is about 3.2 months - at the low end of normal.
New Home Sales Increase to 1,021,000 Annual Rate in March; Highest Since 2006
by Calculated Risk on 4/23/2021 10:16:00 AM
The Census Bureau reports New Home Sales in March were at a seasonally adjusted annual rate (SAAR) of 1.021 million.
The previous three months were revised up sharply.
Sales of new single-family houses in March 2021 were at a seasonally adjusted annual rate of 1,021,000, according to estimates released jointly today by the U.S. Census Bureau and the Department of Housing and Urban Development. This is 20.7 percent above the revised February rate of 846,000 and is 66.8 percent above the March 2020 estimate of 612,000.
emphasis added
 Click on graph for larger image.
The first graph shows New Home Sales vs. recessions since 1963. The dashed line is the current sales rate.
This was the highest sales rate since 2006.
The second graph shows New Home Months of Supply.
 The months of supply decreased in March to 3.6 months from 4.4 months in February.
 The all time record high was 12.1 months of supply in January 2009. The all time record low is 3.5 months, most recently in October 2020.
This is below the low end of the normal range (about 4 to 6 months supply is normal).
"The seasonally-adjusted estimate of new houses for sale at the end of March was 307,000. This represents a supply of 3.6 months at the current sales rate."
 On inventory, according to the Census Bureau:
 "A house is considered for sale when a permit to build has been issued in permit-issuing places or work has begun on the footings or foundation in nonpermit areas and a sales contract has not been signed nor a deposit accepted."Starting in 1973 the Census Bureau broke this down into three categories: Not Started, Under Construction, and Completed.
The third graph shows the three categories of inventory starting in 1973.
The inventory of completed homes for sale is at a record low, and the combined total of completed and under construction is a little lower than normal.
 The last graph shows sales NSA (monthly sales, not seasonally adjusted annual rate).
In March 2021 (red column), 97 thousand new homes were sold (NSA). Last year, 59 thousand homes were sold in March.
The all time high for March was 127 thousand in 2005, and the all time low for March was 28 thousand in 2011.
This was well above expectations, and sales in the three previous months were revised up sharply. I'll have more later today.


