 RSS Feed
 by Calculated Risk on 4/18/2021 04:26:00 PM
Sunday, April 18, 2021
April 18th COVID-19 Vaccinations, New Cases, Hospitalizations; Over Half of People Over 18 Have Had at Least One Dose
Note: I'm looking forward to not posting this daily! I've been posting this data daily for over a year, and I'll stop once all three of these criteria are met:
1) 70% of the population over 18 has had at least one dose of vaccine,
2) new cases are under 5,000 per day, and
3) hospitalizations are below 3,000.
According to the CDC, 209.4 million doses have been administered. 32.5% of the population over 18 is fully vaccinated, and 50.4% of the population over 18 has had at least one dose (130.0 million people over 18 have had at least one dose).
And check out COVID Act Now to see how each state is doing.
Almost 12,000 US deaths were reported so far in April due to COVID.
 Click on graph for larger image.
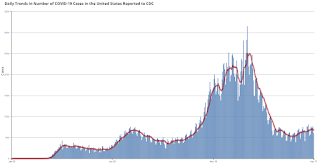
This graph shows the daily (columns) 7 day average (line) of positive tests reported.
Note: The ups and downs during the Winter surge were related to reporting delays due to the Thanksgiving and Christmas holidays.
This data is from the CDC.
 Click on graph for larger image.
This graph shows the daily (columns) 7 day average (line) of positive tests reported.
Note: The ups and downs during the Winter surge were related to reporting delays due to the Thanksgiving and Christmas holidays.
This data is from the CDC.
The 7-day average is 67,442, down from 68,509 yesterday, but above the summer surge peak of 67,337 on July 23, 2020.
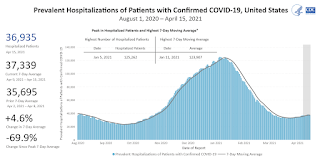
The second graph shows the number of people hospitalized.
 This data is also from the CDC.
The CDC cautions that due to reporting delays, the area in grey will probably increase.
The second graph shows the number of people hospitalized.
 This data is also from the CDC.
The CDC cautions that due to reporting delays, the area in grey will probably increase.
The current 7-day average is 36,976, down from 37,339 reported yesterday, and well above the post-summer surge low of 23,000.
Existing Home Sales: Lawler vs. the Consensus
by Calculated Risk on 4/18/2021 01:36:00 PM
Housing economist Tom Lawler has been sending me his predictions of what the NAR will report for 11 years. And he has graciously allowed me to share his predictions with the readers of this blog.
The table below shows the consensus for each month, Lawler's predictions, and the NAR's initially reported level of sales.
Lawler hasn't always been closer than the consensus, but usually when there has been a fairly large spread between Lawler's estimate and the "consensus", Lawler has been closer.
For example, last month Lawler estimated the NAR would report sales of 6.29 million SAAR, the consensus was 6.51 million SAAR, and the NAR reported 6.22 million SAAR.
The NAR is scheduled to release Existing Home Sales for March at 10:00 AM, Thursday, April 22nd.
The consensus is for 6.17 million SAAR in March, down from 6.22 million in Febuary. Tom Lawler estimates the NAR will report sales of 6.02 million SAAR. Based on Lawler's estimate, I expect existing home sales to be below the consensus in March.
NOTE: There have been times when Lawler "missed", but then he pointed out an apparent error in the NAR data - and the subsequent revision corrected that error. As an example, see: The “Curious Case” of Existing Home Sales in the South in April
Over the last 11 years, the consensus average miss was 147 thousand, and Lawler's average miss was 73 thousand.
| Existing Home Sales, Forecasts and NAR Report millions, seasonally adjusted annual rate basis (SAAR) | |||
|---|---|---|---|
| Month | Consensus | Lawler | NAR reported1 |
| May-10 | 6.20 | 5.83 | 5.66 |
| Jun-10 | 5.30 | 5.30 | 5.37 |
| Jul-10 | 4.66 | 3.95 | 3.83 |
| Aug-10 | 4.10 | 4.10 | 4.13 |
| Sep-10 | 4.30 | 4.50 | 4.53 |
| Oct-10 | 4.50 | 4.46 | 4.43 |
| Nov-10 | 4.85 | 4.61 | 4.68 |
| Dec-10 | 4.90 | 5.13 | 5.28 |
| Jan-11 | 5.20 | 5.17 | 5.36 |
| Feb-11 | 5.15 | 5.00 | 4.88 |
| Mar-11 | 5.00 | 5.08 | 5.10 |
| Apr-11 | 5.20 | 5.15 | 5.05 |
| May-11 | 4.75 | 4.80 | 4.81 |
| Jun-11 | 4.90 | 4.71 | 4.77 |
| Jul-11 | 4.92 | 4.69 | 4.67 |
| Aug-11 | 4.75 | 4.92 | 5.03 |
| Sep-11 | 4.93 | 4.83 | 4.91 |
| Oct-11 | 4.80 | 4.86 | 4.97 |
| Nov-11 | 5.08 | 4.40 | 4.42 |
| Dec-11 | 4.60 | 4.64 | 4.61 |
| Jan-12 | 4.69 | 4.66 | 4.57 |
| Feb-12 | 4.61 | 4.63 | 4.59 |
| Mar-12 | 4.62 | 4.59 | 4.48 |
| Apr-12 | 4.66 | 4.53 | 4.62 |
| May-12 | 4.57 | 4.66 | 4.55 |
| Jun-12 | 4.65 | 4.56 | 4.37 |
| Jul-12 | 4.50 | 4.47 | 4.47 |
| Aug-12 | 4.55 | 4.87 | 4.82 |
| Sep-12 | 4.75 | 4.70 | 4.75 |
| Oct-12 | 4.74 | 4.84 | 4.79 |
| Nov-12 | 4.90 | 5.10 | 5.04 |
| Dec-12 | 5.10 | 4.97 | 4.94 |
| Jan-13 | 4.90 | 4.94 | 4.92 |
| Feb-13 | 5.01 | 4.87 | 4.98 |
| Mar-13 | 5.03 | 4.89 | 4.92 |
| Apr-13 | 4.92 | 5.03 | 4.97 |
| May-13 | 5.00 | 5.20 | 5.18 |
| Jun-13 | 5.27 | 4.99 | 5.08 |
| Jul-13 | 5.13 | 5.33 | 5.39 |
| Aug-13 | 5.25 | 5.35 | 5.48 |
| Sep-13 | 5.30 | 5.26 | 5.29 |
| Oct-13 | 5.13 | 5.08 | 5.12 |
| Nov-13 | 5.02 | 4.98 | 4.90 |
| Dec-13 | 4.90 | 4.96 | 4.87 |
| Jan-14 | 4.70 | 4.67 | 4.62 |
| Feb-14 | 4.64 | 4.60 | 4.60 |
| Mar-14 | 4.56 | 4.64 | 4.59 |
| Apr-14 | 4.67 | 4.70 | 4.65 |
| May-14 | 4.75 | 4.81 | 4.89 |
| Jun-14 | 4.99 | 4.96 | 5.04 |
| Jul-14 | 5.00 | 5.09 | 5.15 |
| Aug-14 | 5.18 | 5.12 | 5.05 |
| Sep-14 | 5.09 | 5.14 | 5.17 |
| Oct-14 | 5.15 | 5.28 | 5.26 |
| Nov-14 | 5.20 | 4.90 | 4.93 |
| Dec-14 | 5.05 | 5.15 | 5.04 |
| Jan-15 | 5.00 | 4.90 | 4.82 |
| Feb-15 | 4.94 | 4.87 | 4.88 |
| Mar-15 | 5.04 | 5.18 | 5.19 |
| Apr-15 | 5.22 | 5.20 | 5.04 |
| May-15 | 5.25 | 5.29 | 5.35 |
| Jun-15 | 5.40 | 5.45 | 5.49 |
| Jul-15 | 5.41 | 5.64 | 5.59 |
| Aug-15 | 5.50 | 5.54 | 5.31 |
| Sep-15 | 5.35 | 5.56 | 5.55 |
| Oct-15 | 5.41 | 5.33 | 5.36 |
| Nov-15 | 5.32 | 4.97 | 4.76 |
| Dec-15 | 5.19 | 5.36 | 5.46 |
| Jan-16 | 5.32 | 5.36 | 5.47 |
| Feb-16 | 5.30 | 5.20 | 5.08 |
| Mar-16 | 5.27 | 5.27 | 5.33 |
| Apr-16 | 5.40 | 5.44 | 5.45 |
| May-16 | 5.64 | 5.55 | 5.53 |
| Jun-16 | 5.48 | 5.62 | 5.57 |
| Jul-16 | 5.52 | 5.41 | 5.39 |
| Aug-16 | 5.44 | 5.49 | 5.33 |
| Sep-16 | 5.35 | 5.55 | 5.47 |
| Oct-16 | 5.44 | 5.47 | 5.60 |
| Nov-16 | 5.54 | 5.60 | 5.61 |
| Dec-16 | 5.54 | 5.55 | 5.49 |
| Jan-17 | 5.55 | 5.60 | 5.69 |
| Feb-17 | 5.55 | 5.41 | 5.48 |
| Mar-17 | 5.61 | 5.74 | 5.71 |
| Apr-17 | 5.67 | 5.56 | 5.57 |
| May-17 | 5.55 | 5.65 | 5.62 |
| Jun-17 | 5.58 | 5.59 | 5.52 |
| Jul-17 | 5.57 | 5.38 | 5.44 |
| Aug-17 | 5.48 | 5.39 | 5.35 |
| Sep-17 | 5.30 | 5.38 | 5.39 |
| Oct-17 | 5.30 | 5.60 | 5.48 |
| Nov-17 | 5.52 | 5.77 | 5.81 |
| Dec-17 | 5.75 | 5.66 | 5.57 |
| Jan-18 | 5.65 | 5.48 | 5.38 |
| Feb-18 | 5.42 | 5.44 | 5.54 |
| Mar-18 | 5.28 | 5.51 | 5.60 |
| Apr-18 | 5.60 | 5.48 | 5.46 |
| May-18 | 5.56 | 5.47 | 5.43 |
| Jun-18 | 5.45 | 5.35 | 5.38 |
| Jul-18 | 5.43 | 5.40 | 5.34 |
| Aug-18 | 5.36 | 5.36 | 5.34 |
| Sep-18 | 5.30 | 5.20 | 5.15 |
| Oct-18 | 5.20 | 5.31 | 5.22 |
| Nov-18 | 5.19 | 5.23 | 5.32 |
| Dec-18 | 5.24 | 4.97 | 4.99 |
| Jan-19 | 5.05 | 4.92 | 4.94 |
| Feb-19 | 5.08 | 5.46 | 5.51 |
| Mar-19 | 5.30 | 5.40 | 5.21 |
| Apr-19 | 5.36 | 5.31 | 5.19 |
| May-19 | 5.29 | 5.40 | 5.34 |
| Jun-19 | 5.34 | 5.25 | 5.27 |
| Jul-19 | 5.39 | 5.40 | 5.42 |
| Aug-19 | 5.38 | 5.42 | 5.49 |
| Sep-19 | 5.45 | 5.36 | 5.38 |
| Oct-19 | 5.49 | 5.36 | 5.46 |
| Nov-19 | 5.45 | 5.43 | 5.35 |
| Dec-19 | 5.43 | 5.40 | 5.54 |
| Jan-20 | 5.45 | 5.42 | 5.46 |
| Feb-20 | 5.50 | 5.58 | 5.77 |
| Mar-20 | 5.30 | 5.25 | 5.27 |
| Apr-20 | 4.30 | 4.17 | 4.33 |
| May-20 | 4.38 | 3.80 | 3.91 |
| Jun-20 | 4.86 | 4.65 | 4.72 |
| Jul-20 | 5.39 | 5.85 | 5.86 |
| Aug-20 | 6.00 | 5.92 | 6.00 |
| Sep-20 | 6.25 | 6.38 | 6.54 |
| Oct-20 | 6.45 | 6.63 | 6.85 |
| Nov-20 | 6.70 | 6.50 | 6.69 |
| Dec-20 | 6.55 | 6.62 | 6.76 |
| Jan-20 | 6.60 | 6.48 | 6.69 |
| Feb-20 | 6.51 | 6.29 | 6.22 |
| Mar-20 | 6.17 | 6.02 | NA |
| 1NAR initially reported before revisions. | |||
Saturday, April 17, 2021
April 17th COVID-19 Vaccinations, New Cases, Hospitalizations
by Calculated Risk on 4/17/2021 07:29:00 PM
Note: I'm looking forward to not posting this daily! I've been posting this data daily for over a year, and I'll stop once all three of these criteria are met:
1) 70% of the population over 18 has had at least one dose of vaccine,
2) new cases are under 5,000 per day, and
3) hospitalizations are below 3,000.
According to the CDC, 205.9 million doses have been administered. 31.8% of the population over 18 is fully vaccinated, and 49.7% of the population over 18 has had at least one dose (128.3 million people over 18 have had at least one dose).
And check out COVID Act Now to see how each state is doing.
Over 11,000 US deaths were reported so far in April due to COVID.
 Click on graph for larger image.
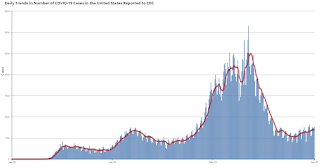
This graph shows the daily (columns) 7 day average (line) of positive tests reported.
Note: The ups and downs during the Winter surge were related to reporting delays due to the Thanksgiving and Christmas holidays.
This data is from the CDC.
 Click on graph for larger image.
This graph shows the daily (columns) 7 day average (line) of positive tests reported.
Note: The ups and downs during the Winter surge were related to reporting delays due to the Thanksgiving and Christmas holidays.
This data is from the CDC.
The 7-day average is 68509, down from 69182 yesterday, but above the summer surge peak of 67,337 on July 23, 2020.
The second graph shows the number of people hospitalized.
 This data is also from the CDC.
The CDC cautions that due to reporting delays, the area in grey will probably increase.
The second graph shows the number of people hospitalized.
 This data is also from the CDC.
The CDC cautions that due to reporting delays, the area in grey will probably increase.
The current 7-day average is 37,339, up from 37,246 reported yesterday, and well above the post-summer surge low of 23,000.
Schedule for Week of April 18, 2021
by Calculated Risk on 4/17/2021 08:11:00 AM
The key reports this week are March New and Existing Home Sales.
For manufacturing, the April Kansas City manufacturing survey will be released.
No major economic releases scheduled.
No major economic releases scheduled.
7:00 AM ET: The Mortgage Bankers Association (MBA) will release the results for the mortgage purchase applications index.
During the day: The AIA's Architecture Billings Index for March (a leading indicator for commercial real estate).
8:30 AM: The initial weekly unemployment claims report will be released. The consensus is for a increase to 625 thousand from 576 thousand last week.
8:30 AM ET: Chicago Fed National Activity Index for March. This is a composite index of other data.
 10:00 AM: Existing Home Sales for March from the National Association of Realtors (NAR). The consensus is for 6.17 million SAAR, down from 6.22 million.
The graph shows existing home sales from 1994 through the report last month.
Housing economist Tom Lawler expects the NAR to report sales of 6.02 million SAAR for March.
11:00 AM: the Kansas City Fed manufacturing survey for April.
 10:00 AM: New Home Sales for March from the Census Bureau.
 This graph shows New Home Sales since 1963. The dashed line is the sales rate for last month.
The consensus is for 885 thousand SAAR, up from 775 thousand in February.
Friday, April 16, 2021
Lawler: Early Read on Existing Home Sales in March
by Calculated Risk on 4/16/2021 04:25:00 PM
From housing economist Tom Lawler:
Based on publicly-available local realtor/MLS reports released across the country through today, I project that existing home sales as estimated by the National Association of Realtors ran at a seasonally adjusted annual rate of 6.02 million in March, down 3.2% from February’s preliminary pace but up 12.5% from last March’s seasonally adjusted pace.
Local realtor reports, as well as reports from national inventory trackers, suggest that the YOY decline in the inventory of existing homes for sale last month was greater than the big decline in February.
One moderately interesting thing to note is that most realtors that break out sales by type showed substantially larger YOY increases in condo sales than in SF detached sales.
Finally, local realtor/MLS data suggest that the median existing single-family home sales price last month was up by about 15.5% from last March.
CR Note: The National Association of Realtors (NAR) is scheduled to release March existing home sales on Thursday, April 22, 2021 at 10:00 AM ET. The consensus is for 6.17 million SAAR.
April 16th COVID-19 Vaccinations, New Cases, Hospitalizations; Over 200 Million Doses Administered
by Calculated Risk on 4/16/2021 03:48:00 PM
Note: I'm looking forward to not posting this daily! I've been posting this data daily for over a year, and I'll stop once all three of these criteria are met:
1) 70% of the population over 18 has had at least one dose of vaccine,
2) new cases are under 5,000 per day, and
3) hospitalizations are below 3,000.
According to the CDC, 202.3 million doses have been administered. 31.1% of the population over 18 is fully vaccinated, and 49.1% of the population over 18 has had at least one dose (126.6 million people over 18 have had at least one dose).
And check out COVID Act Now to see how each state is doing.
Over 10,000 US deaths were reported so far in April due to COVID.
 Click on graph for larger image.
This graph shows the daily (columns) 7 day average (line) of positive tests reported.
Note: The ups and downs during the Winter surge were related to reporting delays due to the Thanksgiving and Christmas holidays.
This data is from the CDC.
 Click on graph for larger image.
This graph shows the daily (columns) 7 day average (line) of positive tests reported.
Note: The ups and downs during the Winter surge were related to reporting delays due to the Thanksgiving and Christmas holidays.
This data is from the CDC.
The 7-day average is 69,405, down from 69,577 yesterday, and above the summer surge peak of 67,337 on July 23, 2020.
The second graph shows the number of people hospitalized.
 This data is also from the CDC.
The CDC cautions that due to reporting delays, the area in grey will probably increase.
The second graph shows the number of people hospitalized.
 This data is also from the CDC.
The CDC cautions that due to reporting delays, the area in grey will probably increase.
The current 7-day average is 37,246, up from 37,125 reported yesterday, and well above the post-summer surge low of 23,000.
California March Housing: Sales up 20% YoY, Active Listings down 51% YoY
by Calculated Risk on 4/16/2021 12:41:00 PM
The CAR reported: California median home price reaches new all-time high in March as nearly two-thirds of homes sell above asking price, C.A.R. reports
Fierce competition drove California’s median home price to reach a new record high in March, while the state’s housing market continued its momentum with sales remaining solid heading into the spring homebuying season, the CALIFORNIA ASSOCIATION OF REALTORS® (C.A.R.) said today.CR Note: Existing home sales are reported when the transaction closes, so this was mostly for contracts signed in January and February.
Closed escrow sales of existing, single-family detached homes in California totaled a seasonally adjusted annualized rate of 462,720 in February, according to information collected by C.A.R. from more than 90 local REALTOR® associations and MLSs statewide. The statewide annualized sales figure represents what would be the total number of homes sold during 2021 if sales maintained the February pace throughout the year. It is adjusted to account for seasonal factors that typically influence home sales.
Closed escrow sales of existing, single-family detached homes in California totaled a seasonally adjusted annualized rate of 446,410 in March, according to information collected by C.A.R. from more than 90 local REALTOR® associations and MLSs statewide. The statewide annualized sales figure represents what would be the total number of homes sold during 2021 if sales maintained the March pace throughout the year. It is adjusted to account for seasonal factors that typically influence home sales.
March home sales decreased 3.5 percent from 462,720 in February and were up 19.7 percent from a year ago, when 373,070 homes were sold on an annualized basis. While still solid, the monthly sales decline was the third in a row, and the sales pace was the lowest since last July. The near-20 percent sales gain can be attributed partly to weak home sales a year ago as the Coronavirus outbreak abruptly halted the real estate market and economy.
“While intense homebuying interest is the engine that continues to drive housing demand, a shortage of homes for sales is the rocket fuel pushing prices higher across the state. A lack of homes for sale is creating unprecedented market competition, leading to a record share of homes selling above asking price in March,” said C.A.R. President Dave Walsh, vice president and manager of the Compass San Jose office. “With more of the state’s COVID-19 restrictions being lifted in the coming months as we move into the spring home buying season, we should see home sales improve as more prospective home sellers feel comfortable listing their homes for sale.”
...
The Unsold Inventory Index (UII) dropped to 1.6 months in March from 2.0 months in February and was down sharply from a year ago, when there was 2.7 months of housing inventory. The index indicates the number of months it would take to sell the supply of homes on the market at the current rate of sales.
Active listings fell 51.1 percent in March from last year — the third consecutive month that listings declined more than 50 percent. On a month-to-month basis, for-sale properties inched up by 5.3 percent in March and should climb further in the coming months as the market moves into the spring homebuying season, while the economy continues to improve.
emphasis added
Black Knight: Number of Homeowners in COVID-19-Related Forbearance Plans Decreased Slightly
by Calculated Risk on 4/16/2021 12:31:00 PM
Note: Both Black Knight and the MBA (Mortgage Bankers Association) are putting out weekly estimates of mortgages in forbearance.
This data is as of April 13th.
From Black Knight: Forbearances Improve for Seventh Straight Week
The country saw a modest decrease in the number of active forbearance plans this week, falling by just 1,000 but still marking the seventh consecutive week of improvement.The number of loans in forbearance continues to decline.
This mid-month lull in improvement was expected – they’ve become commonplace during the recovery, with the strongest rates of improvement seen early and late in the month as mortgages are reviewed for extension/removal from forbearance. With 380,000 loans still slated for these reviews by the end of this month, we could still see additional forbearance improvement in late April/early May.
Click on graph for larger image.
Plan starts hit their highest level in three weeks, but this was primarily due to re-starts, as a portion of the nearly 500,000 homeowners who’d left forbearance in recent weeks likely reached out to their servicers to reinstate their plans. New plan starts remain near post-pandemic lows.
Despite the marginal improvement this week, the number of outstanding plans is still down by 296,000 (-11.4% month-over-month) marking considerable improvement in recent weeks. As of April 13, there are now 2.3 million homeowners in COVID-19-related forbearance plans, representing 4.4% of all mortgage-holders.
We’ll continue to monitor the situation, and will have another report published here next Friday, April 23.
emphasis added

Q1 GDP Forecasts: Around 7%
by Calculated Risk on 4/16/2021 11:19:00 AM
Note that the forecasts of the automated systems (based on released data), have caught up with the forecasts of economists, as data for March is released.
From Merrill Lynch:
Despite robust retail sales growth, it was less bullish than our forecast, resulting in a 0.5pp reduction to our 1Q GDP tracking estimate, to 6.5% qoq saar. [Apr 16 estimate]From Goldman Sachs:
emphasis added
We left our Q1 GDP tracking estimate unchanged on a rounded basis at +7.5% (qoq ar). [Apr 16 estimate]From the NY Fed Nowcasting Report
The New York Fed Staff Nowcast stands at 6.8% for 2021:Q1 and 4.4% for 2021:Q2. [Apr 16 estimate]And from the Altanta Fed: GDPNow
The GDPNow model estimate for real GDP growth (seasonally adjusted annual rate) in the first quarter of 2021 is 8.3 percent on April 16, unchanged from April 15 after rounding. After this morning's housing starts report from the U.S. Census Bureau, the nowcast of first-quarter real residential investment growth decreased from 10.6 percent to 10.2 percent. [Apr 16 estimate]
Comments on March Housing Starts
by Calculated Risk on 4/16/2021 09:36:00 AM
Earlier: Housing Starts increased to 1.739 Million Annual Rate in March
This was the highest level for starts since June 2006.
Total housing starts in March were above expectations, and starts in January and February were revised up. Single family starts increased in March, and were up 41% year-over-year (starts declined at the beginning of the pandemic).
The volatile multi-family sector is up year-over-year (apartments were under pressure from COVID).
The housing starts report showed total starts were up 19.4% in March compared to February, and total starts were up 37.0% year-over-year compared to March 2020.
The housing starts report showed total starts were up 19.4% in March compared to February, and total starts were up 37.0% year-over-year compared to March 2020.
Low mortgage rates and limited existing home inventory have given a boost to single family housing starts.
The first graph shows the month to month comparison for total starts between 2020 (blue) and 2021 (red).
 Click on graph for larger image.
Starts were up 37.0% in March compared to March 2020. The year-over-year comparison will be easy again in April, May and June.
2020 was off to a strong start before the pandemic, and with low interest rates and little competing existing home inventory, starts finished 2020 strong. Starts have started 2021 strong (February was impacted by the harsh weather).
Below is an update to the graph comparing multi-family starts and completions. Since it usually takes over a year on average to complete a multi-family project, there is a lag between multi-family starts and completions. Completions are important because that is new supply added to the market, and starts are important because that is future new supply (units under construction is also important for employment).
These graphs use a 12 month rolling total for NSA starts and completions.
 The blue line is for multifamily starts and the red line is for multifamily completions.
The rolling 12 month total for starts (blue line) increased steadily for several years following the great recession - then mostly moved sideways. Completions (red line) had lagged behind - then completions caught up with starts- then starts picked up a little again late last year, but have fallen off with the pandemic.
 The last graph shows single family starts and completions. It usually only takes about 6 months between starting a single family home and completion - so the lines are much closer. The blue line is for single family starts and the red line is for single family completions.
Single family starts are getting back to more normal levels, but I still expect some further increases in single family starts and completions on a rolling 12 month basis - especially given the low level of existing home inventory.
These graphs use a 12 month rolling total for NSA starts and completions.
 The blue line is for multifamily starts and the red line is for multifamily completions.
 The rolling 12 month total for starts (blue line) increased steadily for several years following the great recession - then mostly moved sideways. Completions (red line) had lagged behind - then completions caught up with starts- then starts picked up a little again late last year, but have fallen off with the pandemic.
 The last graph shows single family starts and completions. It usually only takes about 6 months between starting a single family home and completion - so the lines are much closer. The blue line is for single family starts and the red line is for single family completions.
Single family starts are getting back to more normal levels, but I still expect some further increases in single family starts and completions on a rolling 12 month basis - especially given the low level of existing home inventory.


