 RSS Feed
 by Calculated Risk on 1/01/2021 09:06:00 AM
Friday, January 01, 2021
Black Knight: Number of Homeowners in COVID-19-Related Forbearance Plans Increased Slightly
Note: Both Black Knight and the MBA (Mortgage Bankers Association) are putting out weekly estimates of mortgages in forbearance.
This data is as of December 29th.
From Black Knight: The U.S. Sees its Third Consecutive Week of Forbearance Plans Increases
In the past week, our McDash Flash Forbearance Tracker found that forbearance plan volumes ticked upwards for the third week in a row, rising by 15,000 from the prior week and pushing the number of active plans to its highest level since early November.
We saw FHA/VA forbearances increase by 11,000 this week, with portfolio/PLS forbearances increasing by 4,000 while GSE volumes remained flat.
...
Click on graph for larger image.
This week’s increase was primarily the result of limited forbearance plan removal activity, with removals falling to their lowest level since the start of the pandemic, likely due (at least in part) to the holiday week.
On a bright note, forbearance plan starts also hit their lowest level since the pandemic began, a number also likely impacted by the holidays. Forbearance start volumes have now fallen in each of the last three weeks running.
Despite three consecutive weekly rises, the number of active plans only stands 13,000 higher than the same point last month, and with nearly 270,000 forbearance plans still set to expire at the end of December, it’s possible that we could see an inflow of forbearance plan removals over the first week of January, a situation Black Knight experts will continue to monitor.
As of Dec. 29, some 2.83 million (5.3% of) homeowners remain in COVID-19-related forbearance plans, including 3.5% (964,000) of GSE mortgages, 9.6% (1.16 million) of FHA/VA loans and 5.4% (700,000) of portfolio-held and privately securitized loans.
emphasis added

Thursday, December 31, 2020
December 31 COVID-19 Test Results; Record Hospitalizations
by Calculated Risk on 12/31/2020 06:51:00 PM
Wishing everyone a safe, healthy and Happy New Year!
Note: Expect a dip in the data over the holidays. The week-over-week growth in positive cases slowed prior to the holidays. Hopefully that continues after the holidays.
The US is now averaging close to 2 million tests per day. Based on the experience of other countries, for adequate test-and-trace (and isolation) to reduce infections, the percent positive needs to be under 5% (probably close to 1%), so the US has far too many daily cases - and percent positive - to do effective test-and-trace.
There were 1,719,181 test results reported over the last 24 hours.
There were 221,444 positive tests.
Over 77,000 US deaths were reported in December, far surpassing April as the deadliest month. See the graph on US Daily Deaths here.
 Click on graph for larger image.
This data is from the COVID Tracking Project.
The percent positive over the last 24 hours was 12.9% (red line is 7 day average). The percent positive is calculated by dividing positive results by total tests (including pending).
And check out COVID Act Now to see how each state is doing. (updated link to new site)
 The second graph shows the 7 day average of positive tests reported and daily hospitalizations.
• Record Hospitalizations
Question #4 for 2021: Will the overall participation rate increase to pre-pandemic levels (63.4% in February 2020) , or will it will only partially recover in 2021?
by Calculated Risk on 12/31/2020 02:31:00 PM
Earlier I posted some questions for next year: Ten Economic Questions for 2021. I'm adding some thoughts, and maybe some predictions for each question.
4) Participation Rate: In November 2020, the overall participation rate was at 61.5%, down year-over-year from 63.2% in November 2019. Long term, the BLS has been projecting the overall participation rate will decline to 61.2% by 2029 due to demographics. Will the overall participation rate increase to pre-pandemic levels (63.4% in February 2020) , or will it will only partially recover in 2021?
The overall labor force participation rate is the percentage of the working age population (16 + years old) in the labor force. A large portion of the decline in the participation rate since 2000 was due to demographics and long term trends.
 Click on graph for larger image.
The Labor Force Participation Rate in November 2020 was at 61.5% (red), down from the pre-pandemic level of 63.4% in February, and up from the pandemic low of 60.2% in April 2020. (Blue is the employment population ratio).
In April, 8.1 million people had left the labor force due to the pandemic. By November, about half of these people had returned to the labor force, and there were 4.1 million fewer people in the labor force than at the beginning of the year.
When we look at the age groups that haven't returned to the workforce, a large number are younger (the largest number are in the 25 to 29 age cohort), and mostly prime age workers. This suggests most of these people will eventually return to the labor force.
My guess, based on the pandemic ending around mid-year, is that most of these people will return to the labor force. I don't expect that participation rate to increase to pre-pandemic levels (63.4%), but it seems reason the participation rate will increase to the mid-to-high 62s by year end.
Here are the Ten Economic Questions for 2021 and a few predictions:
• Question #1 for 2021: How much will the economy grow in 2021?
• Question #2 for 2021: Will all the jobs lost in 2020 return in 2021, or will job growth be sluggish?
• Question #3 for 2021: What will the unemployment rate be in December 2021?
• Question #4 for 2021: Will the overall participation rate increase to pre-pandemic levels (63.4% in February 2020) , or will it will only partially recover in 2021?
• Question #5 for 2021: Will the core inflation rate increase in 2021? Will too much inflation be a concern in 2021?
• Question #6 for 2021: Will the Fed raise rates in 2021? What about the asset purchase program?
• Question #7 for 2021: How much will RI increase in 2021? How about housing starts and new home sales in 2021?
• Question #8 for 2021: What will happen with house prices in 2021?
• Question #9 for 2021: Will inventory increase as the pandemic subsides, or will inventory decrease further in 2021?
• Question #10 for 2021: How much damage did the pandemic do to certain sectors?
When we look at the age groups that haven't returned to the workforce, a large number are younger (the largest number are in the 25 to 29 age cohort), and mostly prime age workers. This suggests most of these people will eventually return to the labor force.
In September, the BLS released their updated Labor Force projections through 2029. Their projections show the overall Labor Force Participation Rate (LFPR) declining to 61.2% in 2029. We need to remember this demographic trend.
My guess, based on the pandemic ending around mid-year, is that most of these people will return to the labor force. I don't expect that participation rate to increase to pre-pandemic levels (63.4%), but it seems reason the participation rate will increase to the mid-to-high 62s by year end.
Here are the Ten Economic Questions for 2021 and a few predictions:
• Question #1 for 2021: How much will the economy grow in 2021?
• Question #2 for 2021: Will all the jobs lost in 2020 return in 2021, or will job growth be sluggish?
• Question #3 for 2021: What will the unemployment rate be in December 2021?
• Question #4 for 2021: Will the overall participation rate increase to pre-pandemic levels (63.4% in February 2020) , or will it will only partially recover in 2021?
• Question #5 for 2021: Will the core inflation rate increase in 2021? Will too much inflation be a concern in 2021?
• Question #6 for 2021: Will the Fed raise rates in 2021? What about the asset purchase program?
• Question #7 for 2021: How much will RI increase in 2021? How about housing starts and new home sales in 2021?
• Question #8 for 2021: What will happen with house prices in 2021?
• Question #9 for 2021: Will inventory increase as the pandemic subsides, or will inventory decrease further in 2021?
• Question #10 for 2021: How much damage did the pandemic do to certain sectors?
Question #5 for 2021: Will the core inflation rate increase in 2021? Will too much inflation be a concern in 2021?
by Calculated Risk on 12/31/2020 01:43:00 PM
Earlier I posted some questions for next year: Ten Economic Questions for 2021. I'm adding some thoughts, and maybe some predictions for each question.
5) Inflation: Core PCE was only up 1.4% YoY through November. Will the core inflation rate increase in 2021? Will too much inflation be a concern in 2021?
Although there are different measure for inflation they mostly show inflation at or below the Fed's 2% inflation target.
Note: I follow several measures of inflation, median CPI and trimmed-mean CPI from the Cleveland Fed. Core PCE prices (monthly from the BEA) and core CPI (from the BLS).
 Click on graph for larger image.
This graph shows the year-over-year change for these four key measures of inflation. On a year-over-year basis, the median CPI rose 2.3%, the trimmed-mean CPI rose 2.1%, and the CPI less food and energy rose 1.6%. Core PCE is for October and increased 1.4% year-over-year.
The Fed is projecting core PCE inflation will increase to 1.7% to 1.8% by Q4 2021.
We will likely see some year-over-year jumps in some measures of inflation, since we saw some deflation in 2020. For example, we saw negative Month-to-month (MoM) core CPI and CPI readings in March, April and May. Assuming positive readings in those months in 2021, the YoY change in CPI and core CPI will jump.
We also saw negative MoM PCE and core PCE reading in March and April. IMPORTANT: Ignore a jump in YoY inflation in March, April and May!
My guess is core PCE inflation (year-over-year) will increase in 2021 (from the current 1.4%), but I think too much inflation will NOT be a concern in 2021.
Here are the Ten Economic Questions for 2021 and a few predictions:
• Question #1 for 2021: How much will the economy grow in 2021?
• Question #2 for 2021: Will all the jobs lost in 2020 return in 2021, or will job growth be sluggish?
• Question #3 for 2021: What will the unemployment rate be in December 2021?
• Question #4 for 2021: Will the overall participation rate increase to pre-pandemic levels (63.4% in February 2020) , or will it will only partially recover in 2021?
• Question #5 for 2021: Will the core inflation rate increase in 2021? Will too much inflation be a concern in 2021?
• Question #6 for 2021: Will the Fed raise rates in 2021? What about the asset purchase program?
• Question #7 for 2021: How much will RI increase in 2021? How about housing starts and new home sales in 2021?
• Question #8 for 2021: What will happen with house prices in 2021?
• Question #9 for 2021: Will inventory increase as the pandemic subsides, or will inventory decrease further in 2021?
• Question #10 for 2021: How much damage did the pandemic do to certain sectors?
Hotels: Occupancy Rate Declined 33.0% Year-over-year, 2020 Worst Year on Record
by Calculated Risk on 12/31/2020 09:57:00 AM
This is the end of the worst year on record for hotel occupancy. The average weekly occupancy rate was 44.2%, far below the occupancy rate for the previous worst year of 55.0% in 2009. The normal annual average weekly occupancy rate is around 63%.
U.S. weekly hotel occupancy fell to its lowest level since early May, according to STR‘s latest data for the week of Christmas.The following graph shows the seasonal pattern for the hotel occupancy rate using the four week average.
20-26 December 2020 (percentage change from comparable week in 2019):
• Occupancy: 32.5% (-33.0%)
• Average daily rate (ADR): US$92.08 (-28.8%)
• Revenue per available room (RevPAR): US$29.94 (-52.3%)
emphasis added
 Click on graph for larger image.
The red line is for 2020, dash light blue is 2019, blue is the median, and black is for 2009 (the worst year since the Great Depression for hotels - before 2020).
Seasonally we'd expect the occupancy rate to decline into the new year, and then, usually, business travel would start to pick up in the new year.
Note: Y-axis doesn't start at zero to better show the seasonal change.
Since there is a seasonal pattern to the occupancy rate - see graph above - we can track the year-over-year change in occupancy to look for any improvement. This table shows the year-over-year change since the week ending Sept 19, 2020:
This suggests no improvement over the last several months.
| Week Ending | YoY Change, Occupancy Rate |
|---|---|
| 9/19 | -31.9% |
| 9/26 | -31.5% |
| 10/3 | -29.6% |
| 10/10 | -29.2% |
| 10/17 | -30.7% |
| 10/24 | -31.7% |
| 10/31 | -29.0% |
| 11/7 | -35.9% |
| 11/14 | -32.7% |
| 11/21 | -32.6% |
| 11/28 | -28.5% |
| 12/5 | -37.9% |
| 12/12 | -37.4% |
| 12/19 | -26.4% |
| 12/26 | -33.0% |
Weekly Initial Unemployment Claims decreased to 787,000
by Calculated Risk on 12/31/2020 08:37:00 AM
The DOL reported:
In the week ending December 26, the advance figure for seasonally adjusted initial claims was 787,000, a decrease of 19,000 from the previous week's revised level. The previous week's level was revised up by 3,000 from 803,000 to 806,000. The 4-week moving average was 836,750, an increase of 17,750 from the previous week's revised average. The previous week's average was revised up by 750 from 818,250 to 819,000.This does not include the 308,262 initial claims for Pandemic Unemployment Assistance (PUA) that was down from 396,948 the previous week.
emphasis added
The following graph shows the 4-week moving average of weekly claims since 1971.
 Click on graph for larger image.
The dashed line on the graph is the current 4-week average. The four-week average of weekly unemployment claims increased to 836,750.
The previous week was revised up.
The second graph shows seasonally adjust continued claims since 1967 (lags initial by one week).
 At the worst of the Great Recession, continued claims peaked at 6.635 million, but then steadily declined.
Continued claims decreased to 5,393,440 (SA) from 5,457,941 (SA) last week and will likely stay at a high level until the crisis abates.
Note: There are an additional 8,459,647 receiving Pandemic Unemployment Assistance (PUA) that decreased from 9,271,112 the previous week (there are questions about these numbers). This is a special program for business owners, self-employed, independent contractors or gig workers not receiving other unemployment insurance.
An additional 4,772,853 are receiving Pandemic Emergency Unemployment Compensation (PEUC) that decreased from 4,793,230 the previous week.
This was close to expectations.
Wednesday, December 30, 2020
December 30 COVID-19 Test Results; Record Hospitalizations
by Calculated Risk on 12/30/2020 07:17:00 PM
Note: Expect a dip in the data over the holidays. The week-over-week growth in positive cases has slowed. Hopefully that continues after the holidays.
The US is now averaging close to 2 million tests per day. Based on the experience of other countries, for adequate test-and-trace (and isolation) to reduce infections, the percent positive needs to be under 5% (probably close to 1%), so the US has far too many daily cases - and percent positive - to do effective test-and-trace.
There were 1,559,541 test results reported over the last 24 hours.
There were 224,638 positive tests.
Almost 74,000 US deaths have been reported so far in December, far surpassing April as the deadliest month. See the graph on US Daily Deaths here.
 Click on graph for larger image.
This data is from the COVID Tracking Project.
The percent positive over the last 24 hours was 14.4% (red line is 7 day average). The percent positive is calculated by dividing positive results by total tests (including pending).
And check out COVID Act Now to see how each state is doing. (updated link to new site)
 The second graph shows the 7 day average of positive tests reported and daily hospitalizations.
• Record Hospitalizations
Fannie Mae: Mortgage Serious Delinquency Rate Decreased in November
by Calculated Risk on 12/30/2020 05:25:00 PM
Fannie Mae reported that the Single-Family Serious Delinquency decreased to 2.96% in November, from 3.05% in October. The serious delinquency rate is up from 0.66% in November 2019.
These are mortgage loans that are "three monthly payments or more past due or in foreclosure".
The Fannie Mae serious delinquency rate peaked in February 2010 at 5.59%.
 Click on graph for larger image
By vintage, for loans made in 2004 or earlier (2% of portfolio), 5.87% are seriously delinquent (up from 5.82% in October). For loans made in 2005 through 2008 (3% of portfolio), 10.00% are seriously delinquent (up from 9.84%), For recent loans, originated in 2009 through 2018 (95% of portfolio), 2.48% are seriously delinquent (down from 2.57%). So Fannie is still working through a few poor performing loans from the bubble years.
Mortgages in forbearance are counted as delinquent in this monthly report, but they will not be reported to the credit bureaus.
This is very different from the increase in delinquencies following the housing bubble. Lending standards have been fairly solid over the last decade, and most of these homeowners have equity in their homes - and they will be able to restructure their loans once they are employed.
Note: Freddie Mac reported earlier.
Question #6 for 2021: Will the Fed raise rates in 2021? What about the asset purchase program?
by Calculated Risk on 12/30/2020 12:51:00 PM
Earlier I posted some questions for next year: Ten Economic Questions for 2021. I'm adding some thoughts, and maybe some predictions for each question.
6) Monetary Policy: The Fed cut rates to zero in 2020 in response to the pandemic, and has signaled they will be on hold for some time. Will the Fed raise rates in 2021? Will the Fed end - or taper - the asset purchase program?
In March, in response to the pandemic, the Fed cut rates to essentially zero:
"Effective March 23, 2020, the Federal Open Market Committee directs the Desk to undertake open market operations as necessary to maintain the federal funds rate in a target range of 0 to 1/4 percent."In addition, the Fed has been buying assets, from the December statement:
"the Federal Reserve will continue to increase its holdings of Treasury securities by at least $80 billion per month and of agency mortgage-backed securities by at least $40 billion per month until substantial further progress has been made toward the Committee's maximum employment and price stability goals."An important point: The Fed will look through any blip in inflation in 2021 (there will be some weird distortions in the numbers).
emphasis added
As of December, looking at the "dot plot", the FOMC participants see the following number of rate hikes in 2021 and 2022:
Clearly the main view of the FOMC is no change in policy in 2021.
Here are the Ten Economic Questions for 2021 and a few predictions:
• Question #1 for 2021: How much will the economy grow in 2021?
• Question #2 for 2021: Will all the jobs lost in 2020 return in 2021, or will job growth be sluggish?
• Question #3 for 2021: What will the unemployment rate be in December 2021?
• Question #4 for 2021: Will the overall participation rate increase to pre-pandemic levels (63.4% in February 2020) , or will it will only partially recover in 2021?
• Question #5 for 2021: Will the core inflation rate increase in 2021? Will too much inflation be a concern in 2021?
• Question #6 for 2021: Will the Fed raise rates in 2021? What about the asset purchase program?
• Question #7 for 2021: How much will RI increase in 2021? How about housing starts and new home sales in 2021?
• Question #8 for 2021: What will happen with house prices in 2021?
• Question #9 for 2021: Will inventory increase as the pandemic subsides, or will inventory decrease further in 2021?
• Question #10 for 2021: How much damage did the pandemic do to certain sectors?
| FOMC Members 2021 | FOMC Members 2022 | |
|---|---|---|
| No Change | 17 | 16 |
| One Rate Hike | 0 | 1 |
Clearly the main view of the FOMC is no change in policy in 2021.
As far as asset purchases, from Professor Tim Duy: Four Points to Know About the FOMC Meeting
the Fed explicitly intends to hold the size of purchase at or above the current pace until the Fed achieves clear further progress toward its economic objective. Note though that “further progress” is not complete progress. The Fed will pull back on the asset purchase program before raising interest rates. When and under what conditions? Powell declined to answer that question but did promise there would be advance notice. Look for that notice to begin next year if the economy looks to rebound strongly as expected by mid-2021.There will be no rate hike in 2021, and since I'm assuming the pandemic will subside by mid-year 2021, it seems likely the Fed will taper asset purchases sometime in the second half of 2021.
Here are the Ten Economic Questions for 2021 and a few predictions:
• Question #1 for 2021: How much will the economy grow in 2021?
• Question #2 for 2021: Will all the jobs lost in 2020 return in 2021, or will job growth be sluggish?
• Question #3 for 2021: What will the unemployment rate be in December 2021?
• Question #4 for 2021: Will the overall participation rate increase to pre-pandemic levels (63.4% in February 2020) , or will it will only partially recover in 2021?
• Question #5 for 2021: Will the core inflation rate increase in 2021? Will too much inflation be a concern in 2021?
• Question #6 for 2021: Will the Fed raise rates in 2021? What about the asset purchase program?
• Question #7 for 2021: How much will RI increase in 2021? How about housing starts and new home sales in 2021?
• Question #8 for 2021: What will happen with house prices in 2021?
• Question #9 for 2021: Will inventory increase as the pandemic subsides, or will inventory decrease further in 2021?
• Question #10 for 2021: How much damage did the pandemic do to certain sectors?
Question #7 for 2021: How much will RI increase in 2021? How about housing starts and new home sales in 2021?
by Calculated Risk on 12/30/2020 11:41:00 AM
Earlier I posted some questions for next year: Ten Economic Questions for 2021. I'm adding some thoughts, and maybe some predictions for each question.
7) Residential Investment: Residential investment (RI) was solid in 2020, and housing was a strong sector during the pandemic. Through November, starts were up 7.0% year-over-year compared to the same period in 2019. New home sales were up 19.1% year--to-date through November. Note: RI is mostly investment in new single family structures, multifamily structures, home improvement and commissions on existing home sales. How much will RI increase in 2021? How about housing starts and new home sales in 2021?
First a graph of RI as a percent of Gross Domestic Product (GDP) through Q3 2020:
 Click on graph for larger image.
Residential investment (RI) increased at a 59.3% annual rate in Q3. And RI, as percent of GDP, increased sharply in Q3.
We don't have the data yet for Q4 2020 yet, but it appears RI will make a strong contribution to GDP in 2020.
Note that RI as a percent of GDP is still fairly low and not far above the lows of previous recessions.
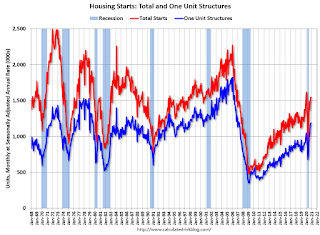 The second graph shows total and single family housing starts through November 2020.
Starts, year-to-date, are up 7.0% compared to the same period in 2019. Note that starts were up solidly prior to the pandemic, and then bounced back strong.
Even after the significant increase over the last several years, and the solid increase in 2020, the approximately 1.38 million housing starts in 2020 will still be the 34th highest on an annual basis since the Census Bureau started tracking starts in 1959 (34 out of 62 total years - middle of the pack).
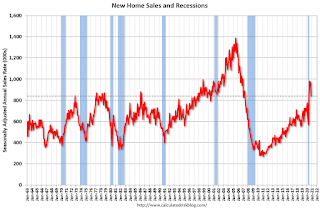 The third graph shows New Home Sales since 1963 through November 2020. The dashed line is the November sales rate.
New home sales in 2020, through November, were up 19.1% compared to the same period in 2019. This will be the strongest year for new home sales since 2006.
Clearly low mortgages rates, low existing home supply, and low sales in March and April (due to the pandemic) have led to a strong increase in sales. Favorable demographics and a surging stock market have probably helped new home sales too.
Here is a table showing housing starts and new home sales since 2005. No one should expect an increase to 2005 levels, however demographics and household formation suggest starts will increase further this cycle.
Most analysts are looking for starts and new home sales to increase further in 2021. For example, Fannie Mae expects new home sales to increase to 872 thousand, and the MBA is forecasting 960 thousand in 2021.
Here is a table showing housing starts and new home sales since 2005. No one should expect an increase to 2005 levels, however demographics and household formation suggest starts will increase further this cycle.
| Housing Starts and New Home Sales (000s) | ||||
|---|---|---|---|---|
| Housing Starts | Change | New Home Sales | Change | |
| 2005 | 2,068 | --- | 1,283 | --- |
| 2006 | 1,801 | -12.9% | 1,051 | -18.1% |
| 2007 | 1,355 | -24.8% | 776 | -26.2% |
| 2008 | 906 | -33.2% | 485 | -37.5% |
| 2009 | 554 | -38.8% | 375 | -22.7% |
| 2010 | 587 | 5.9% | 323 | -13.9% |
| 2011 | 609 | 3.7% | 306 | -5.3% |
| 2012 | 781 | 28.2% | 368 | 20.3% |
| 2013 | 925 | 18.5% | 429 | 16.6% |
| 2014 | 1,003 | 8.5% | 437 | 1.9% |
| 2015 | 1,112 | 10.8% | 501 | 14.6% |
| 2016 | 1,174 | 5.6% | 561 | 12.0% |
| 2017 | 1,203 | 2.5% | 613 | 9.3% |
| 2018 | 1,249 | 3.9% | 617 | 0.7% |
| 2019 | 1,290 | 3.2% | 683 | 10.7% |
| 20201 | 1,380 | 7.0% | 810 | 18.6% |
| 12020 estimated | ||||
Most analysts are looking for starts and new home sales to increase further in 2021. For example, Fannie Mae expects new home sales to increase to 872 thousand, and the MBA is forecasting 960 thousand in 2021.
And for housing starts, Fannie Mae is forecasting 1.44 million, and Merrill Lynch is forecasting 1.50 million.
Note that New Home sales have averaged 941 thousand over the last five months on seasonally adjust annual rate (SAAR) basis. So most forecasts are for sales to be relatively flat relative to the last five months.
Note that New Home sales have averaged 941 thousand over the last five months on seasonally adjust annual rate (SAAR) basis. So most forecasts are for sales to be relatively flat relative to the last five months.
And housing starts have averaged 1.47 million over the same period. So once again, analysts are expecting starts to be at about the same level in 2021 as the last 5 months.
My guess is starts will be up year-over-year in 2021 by high single digits. However, my guess is new home sales will soften in the second half of 2021 (based on my expectation of more existing home inventory), and will be up mid single digits (a decline from the sales rate over the last 5 months). It is even possible that sales will be flat to slightly down in 2021, but that will depend on inventory and the course of the pandemic.
Here are the Ten Economic Questions for 2021 and a few predictions:
• Question #1 for 2021: How much will the economy grow in 2021?
• Question #2 for 2021: Will all the jobs lost in 2020 return in 2021, or will job growth be sluggish?
• Question #3 for 2021: What will the unemployment rate be in December 2021?
• Question #4 for 2021: Will the overall participation rate increase to pre-pandemic levels (63.4% in February 2020) , or will it will only partially recover in 2021?
• Question #5 for 2021: Will the core inflation rate increase in 2021? Will too much inflation be a concern in 2021?
• Question #6 for 2021: Will the Fed raise rates in 2021? What about the asset purchase program?
• Question #7 for 2021: How much will RI increase in 2021? How about housing starts and new home sales in 2021?
• Question #8 for 2021: What will happen with house prices in 2021?
• Question #9 for 2021: Will inventory increase as the pandemic subsides, or will inventory decrease further in 2021?
• Question #10 for 2021: How much damage did the pandemic do to certain sectors?

In Memoriam: Doris "Tanta" Dungey


| Privacy Policy |
| Copyright © 2007 - 2025 CR4RE LLC |
| Excerpts NOT allowed on x.com |