 RSS Feed
 by Calculated Risk on 12/11/2020 07:08:00 PM
Friday, December 11, 2020
December 11 COVID-19 Test Results; Record 7-Day Cases and Deaths, Record Hospitalizations
I'm looking forward to not posting this data in a few months. Please stay healthy!
The US is now averaging well over 1 million tests per day. Based on the experience of other countries, for adequate test-and-trace (and isolation) to reduce infections, the percent positive needs to be under 5% (probably close to 1%), so the US has far too many daily cases - and percent positive - to do effective test-and-trace.
There were 1,682,010 test results reported over the last 24 hours.
There were 232,105 positive tests.
Over 27,000 US deaths have been reported so far in December. See the graph on US Daily Deaths here.
 Click on graph for larger image.
This data is from the COVID Tracking Project.
The percent positive over the last 24 hours was 13.8% (red line is 7 day average). The percent positive is calculated by dividing positive results by the sum of negative and positive results (I don't include pending).
And check out COVID Exit Strategy to see how each state is doing.
 The second graph shows the 7 day average of positive tests reported and daily hospitalizations.
Note that there were very few tests available in March and April, and many cases were missed, so the hospitalizations was higher relative to the 7-day average of positive tests in July.
• Record Hospitalizations (Over 108,000)
• Record 7 Day Average Cases
• Record 7 Day Average Deaths
Sacramento Housing in November: Sales increase 22% YoY, Active Inventory down 47% YoY
by Calculated Risk on 12/11/2020 03:30:00 PM
Note that November sales are for contracts typically signed in September and October.
From SacRealtor.org: November sales volume up 21% over 2019, demand remains
November ended with 1,511 sales, down 9.8% from the 1,676 sales in October. Compared to one year ago (1,242), the current figure is up 21.7%.
...
The Active Listing Inventory decreased 9.8% from October to November, from 1,253 units to 959 units. Compared with November 2019 (2,803), inventory is down 46.8%. The Months of Inventory dropped from .7 Months to .6 Months. This figure represents the amount of time (in months) it would take for the current rate of sales to deplete the total active listing inventory.
...
The Median DOM (days on market) increased from 6 to 7 and the Average DOM increased from 15 to 16. “Days on market” represents the days between the initial listing of the home as “active” and the day it goes “pending.” Of the 1,511 sales this month, 86.2% (1,302) were on the market for 30 days or less and 95.1% (1,436) were on the market for 60 days or less.
emphasis added
Houston Real Estate in November: Sales Up 28% YoY, Inventory Down 27% YoY
by Calculated Risk on 12/11/2020 01:15:00 PM
From the HAR: Houston Housing Blazes its Way Through November
Homes across the greater Houston area continued selling at a record pace despite historically low inventory, the start of the holiday season and the lingering coronavirus pandemic. A low supply of homes for sale and strong demand from homebuyers combined to push the average price to record territory. Once again, the high end of the market generated the strongest increase in consumer activity with mid-range homes also selling briskly.Inventory declined 27.0% year-over-year from 41,022 in November 2019 to 29,948 in November 2020.
According to the latest Houston Association of Realtors (HAR) Market Update, 7,990 single-family homes sold in November compared to 6,359 a year earlier. That translates to a 25.6 percent increase and marks the sixth straight month of positive sales.
...
Sales of all property types totaled 9,660 – up 28.1 percent from November 2019. Total dollar volume for the month rose 43.9 percent to $3.1 billion. The lease market recorded an 11.1 percent decline in single-family housing while townhouse/condo leases fell 4.0 percent.
“In my 50 years in the real estate business, I have never seen a market defy supply and seasonality the way Houston has – amid a pandemic, no less,” said HAR Chairman John Nugent with RE/MAX Space Center. “It’s quite extraordinary to watch consumers take advantage of historically low interest rates and be able to choose their dream homes from among the tightest housing inventory this market has ever experienced.”
emphasis added
Note that the closed sales in November were for contracts that were mostly signed in September and October.
Q4 GDP Forecasts
by Calculated Risk on 12/11/2020 11:34:00 AM
Economic activity in the fourth quarter is dependent on the impact of the pandemic. With the number of new cases per day of COVID over 200,000, hospitalizations at record levels (over 100,000), and deaths per day at new record highs (over 3,000 the last two days), it is clear that economic activity will slow in December. Most of the slowdown will be related to individuals being more cautious, and some will be related to government actions.
Initial unemployment claims for last week showed a sharp increase to 853,000, suggesting that layoffs are increasing. The current week is the BLS reference week for December, and with the new restrictions on activity, it seems likely there will be another sharp increase in layoffs this week (reported next Thursday).
However, economic activity was solid in October, and that would suggest PCE growth of close to 6% in Q4, even if November and December see no month-over-month growth. No one expects a lockdown like at the end of March and in April, but it is possible that activity slowed in November and will decline in December.
From Goldman Sachs:
We left our Q4 GDP tracking estimate unchanged at +5.0% (qoq ar) [Dec 9 estimate]From Merrill Lynch:
We continue to track 33.1% for 3Q GDP and 6.0% for 4Q GDP. [Dec 11 estimate]From the NY Fed Nowcasting Report
The New York Fed Staff Nowcast stands at 2.5% for 2020:Q4 and 5.9% for 2021:Q1. [Dec 11 estimate]And from the Altanta Fed: GDPNow
The GDPNow model estimate for real GDP growth (seasonally adjusted annual rate) in the fourth quarter of 2020 is 11.2 percent on December 9, unchanged from December 4 after rounding. [Dec 9 estimate]
Mortgage Equity Withdrawal Increased in Q3
by Calculated Risk on 12/11/2020 09:31:00 AM
Note: This is not Mortgage Equity Withdrawal (MEW) data from the Fed. The last MEW data from Fed economist Dr. Kennedy was for Q4 2008.
The following data is calculated from the Fed's Flow of Funds data (released yesterday) and the BEA supplement data on single family structure investment. This is an aggregate number, and is a combination of homeowners extracting equity - hence the name "MEW" - and normal principal payments and debt cancellation (modifications, short sales, and foreclosures).
For Q3 2020, the Net Equity Extraction was $100 billion, or a 2.26% of Disposable Personal Income (DPI) . This is the highest level of MEW since 2007, but nothing like the amount of equity extraction during the housing bubble (as a percent of DPI).
 Click on graph for larger image.
This graph shows the net equity extraction, or mortgage equity withdrawal (MEW), results, using the Flow of Funds (and BEA data) compared to the Kennedy-Greenspan method.
Note: This data is impacted by debt cancellation and foreclosures, but much less than a few years ago.
MEW has been mostly positive for the last four years.
The Fed's Flow of Funds report showed that the amount of mortgage debt outstanding increased by $158 billion in Q3.
For reference:
Dr. James Kennedy also has a simple method for calculating equity extraction: "A Simple Method for Estimating Gross Equity Extracted from Housing Wealth". Here is a companion spread sheet (the above uses my simple method).
For those interested in the last Kennedy data included in the graph, the spreadsheet from the Fed is available here.
Black Knight: Number of Homeowners in COVID-19-Related Forbearance Plans Decreased Slightly, New Starts Increased
by Calculated Risk on 12/11/2020 08:43:00 AM
Note: Both Black Knight and the MBA (Mortgage Bankers Association) are putting out weekly estimates of mortgages in forbearance.
This data is as of December 8th.
From Black Knight: New Forbearance Starts Increase as Overall Volumes See First Monthly Rise Since Early June
In the past week, our McDash Flash Forbearance Tracker found that forbearance volumes in the U.S. edged lower (-12,000), including an improvement of 13,000 among portfolio/PLS loans in forbearance and 2,000 among GSE loans. These improvements were partially offset by a rise of 3,000 among FHA/VA forbearance plans.
As of Dec. 8, 5.2% (2.75 million) of all mortgages were in active forbearance, including 3.5% of GSE loans, 9.3% of FHA/VA loans, and 5.1% of PLS/portfolio loans.
...
Click on graph for larger image.
Despite the marginal weekly improvement, forbearance volumes are now up 21,000 month-over-month, marking the first monthly increase since the onset of the recovery in late May/early June. This increase is due in part to limited forbearance expiration activity in November, which has resulted in reduced forbearance removal activity in early December compared to previous months.
More noticeably – and potentially concerning – is the fact that forbearance plan starts have begun to trend upward. There were more than 40,000 first-time starts over the past week, representing homeowners who had not yet been in a COVID-19 forbearance plan, the highest such number of first-time starts since the beginning of September.
The increase suggests that rising COVID-19 case rates and measures undertaken to try to control the spread may be contributing to an increased need for forbearance assistance. New starts are now up 19% over the past two weeks, while overall starts (including restarts) are up 5% over the same period.
Black Knight will keep a close eye on this trend, which – should it continue – could alter expectations about the length of recovery.
emphasis added

Thursday, December 10, 2020
December 10 COVID-19 Test Results; Record 7-Day Cases, Hospitalizations, Deaths
by Calculated Risk on 12/10/2020 07:35:00 PM
I'm looking forward to not posting this data in a few months. Please stay healthy!
The US is now averaging well over 1 million tests per day. Based on the experience of other countries, for adequate test-and-trace (and isolation) to reduce infections, the percent positive needs to be under 5% (probably close to 1%), so the US has far too many daily cases - and percent positive - to do effective test-and-trace.
There were 1,532,713 test results reported over the last 24 hours.
There were 214,118 positive tests.
Over 24,000 US deaths have been reported so far in December. See the graph on US Daily Deaths here.
 Click on graph for larger image.
This data is from the COVID Tracking Project.
The percent positive over the last 24 hours was 14.0% (red line is 7 day average). The percent positive is calculated by dividing positive results by the sum of negative and positive results (I don't include pending).
And check out COVID Exit Strategy to see how each state is doing.
 The second graph shows the 7 day average of positive tests reported and daily hospitalizations.
Note that there were very few tests available in March and April, and many cases were missed, so the hospitalizations was higher relative to the 7-day average of positive tests in July.
• Record Hospitalizations (Over 107,000)
• Record 7 Day Average Cases
• Record 7 Day Average Deaths
Fed's Flow of Funds: Household Net Worth Increased $3.8 Trillion in Q3
by Calculated Risk on 12/10/2020 01:25:00 PM
The Federal Reserve released the Q3 2020 Flow of Funds report today: Flow of Funds.
The net worth of households and nonprofits rose to $123.5 trillion in the third quarter of 2020. The value of directly and indirectly held corporate equities increased $2.8 trillion and the value of real estate increased $0.4 trillion.
Household debt increased 5.6 percent at an annual rate in the third quarter of 2020. Consumer credit grew at an annual rate of 1.9 percent, while mortgage debt (excluding charge-offs) grew at an annual rate of 5.6 percent.
 Click on graph for larger image.
The first graph shows Households and Nonprofit net worth as a percent of GDP.
With the sharp decline in GDP in Q2, net worth as a percent of GDP increased sharply. This reversed somewhat in Q3 as GDP bounced back (even as net worth increased)
This includes real estate and financial assets (stocks, bonds, pension reserves, deposits, etc) net of liabilities (mostly mortgages). Note that this does NOT include public debt obligations.
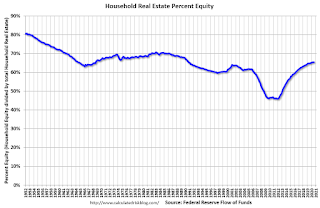 This graph shows homeowner percent equity since 1952.
Household percent equity (as measured by the Fed) collapsed when house prices fell sharply in 2007 and 2008.
In Q3 2020, household percent equity (of household real estate) was at 65.5% - unchanged from Q2.
Note: about 30.3% of owner occupied households had no mortgage debt as of April 2010. So the approximately 50+ million households with mortgages have less than 65.5% equity - and about 1.6 million homeowners still have negative equity.
 The third graph shows household real estate assets and mortgage debt as a percent of GDP. Note this graph was impacted by the sharp decline in Q2 GDP.
Mortgage debt increased by $158 billion in Q3.
Mortgage debt is still down from the peak during the housing bubble, and, as a percent of GDP is at 51.0% - down from Q2 - and down from a peak of 73.5% of GDP during the housing bubble.
The value of real estate, as a percent of GDP, decreased in Q3 as GDP bounced back, and is above the average of the last 30 years.
 This graph shows homeowner percent equity since 1952.
 Household percent equity (as measured by the Fed) collapsed when house prices fell sharply in 2007 and 2008.
In Q3 2020, household percent equity (of household real estate) was at 65.5% - unchanged from Q2.
Note: about 30.3% of owner occupied households had no mortgage debt as of April 2010. So the approximately 50+ million households with mortgages have less than 65.5% equity - and about 1.6 million homeowners still have negative equity.
 The third graph shows household real estate assets and mortgage debt as a percent of GDP. Note this graph was impacted by the sharp decline in Q2 GDP.
Mortgage debt increased by $158 billion in Q3.
Mortgage debt is still down from the peak during the housing bubble, and, as a percent of GDP is at 51.0% - down from Q2 - and down from a peak of 73.5% of GDP during the housing bubble.
The value of real estate, as a percent of GDP, decreased in Q3 as GDP bounced back, and is above the average of the last 30 years.
Hotels: Occupancy Rate Declined 37.9% Year-over-year
by Calculated Risk on 12/10/2020 12:32:00 PM
From HotelNewsNow.com: STR: US hotel results for week ending 5 December
U.S. weekly hotel occupancy increased slightly from the previous week, according to the latest data from STR through 5 December.Since there is a seasonal pattern to the occupancy rate - see graph below - we can track the year-over-year change in occupancy to look for any improvement. This table shows the year-over-year change since the week ending Sept 19, 2020:
29 November through 5 December 2020 (percentage change from comparable week in 2019):
• Occupancy: 37.4% (-37.9%)
• Average daily rate (ADR): US$86.21 (-33.1%)
• Revenue per available room (RevPAR): US$32.23 (-58.4%)
With slightly higher demand after Thanksgiving, occupancy improved after several weeks of lowering levels. With a tougher year-over-year comparable, however, the country’s RevPAR decline was its worst since late June.
emphasis added
| Week Ending | YoY Change, Occupancy Rate |
|---|---|
| 9/19 | -31.9% |
| 9/26 | -31.5% |
| 10/3 | -29.6% |
| 10/10 | -29.2% |
| 10/17 | -30.7% |
| 10/24 | -31.7% |
| 10/31 | -29.0% |
| 11/7 | -35.9% |
| 11/14 | -32.7% |
| 11/21 | -32.6% |
| 11/28 | -28.5% |
| 11/28 | -37.9% |
This suggests no improvement over the last 3 months.
The following graph shows the seasonal pattern for the hotel occupancy rate using the four week average.
 Click on graph for larger image.
The red line is for 2020, dash light blue is 2019, blue is the median, and black is for 2009 (the worst year since the Great Depression for hotels - before 2020).
Seasonally we'd expect the occupancy rate to decline into the new year.
Note: Y-axis doesn't start at zero to better show the seasonal change.
Cleveland Fed: Key Measures Show Inflation Softened in November
by Calculated Risk on 12/10/2020 11:08:00 AM
The Cleveland Fed released the median CPI and the trimmed-mean CPI this morning:
According to the Federal Reserve Bank of Cleveland, the median Consumer Price Index rose 0.1% November. The 16% trimmed-mean Consumer Price Index rose 0.1% in November. "The median CPI and 16% trimmed-mean CPI are measures of core inflation calculated by the Federal Reserve Bank of Cleveland based on data released in the Bureau of Labor Statistics’ (BLS) monthly CPI report".
Note: The Cleveland Fed released the median CPI details for November here. Car and Truck rentals and Lodging away from home increased sharply in November.
 Click on graph for larger image.
This graph shows the year-over-year change for these four key measures of inflation. On a year-over-year basis, the median CPI rose 2.3%, the trimmed-mean CPI rose 2.1%, and the CPI less food and energy rose 1.6%. Core PCE is for October and increased 1.4% year-over-year.
Overall inflation will not be a concern during the crisis.


