 RSS Feed
 by Calculated Risk on 12/01/2020 08:00:00 AM
Tuesday, December 01, 2020
CoreLogic: House Prices up 7.3% Year-over-year in October
Notes: This CoreLogic House Price Index report is for October. The recent Case-Shiller index release was for September. The CoreLogic HPI is a three month weighted average and is not seasonally adjusted (NSA).
From CoreLogic: Gaining Momentum: Annual U.S. Home Prices Appreciated 7.3% in October, CoreLogic Reports
CoreLogic® ... today released the CoreLogic Home Price Index (HPI™) and HPI Forecast™ for October 2020. Nationally, home prices increased 7.3% in October 2020, compared with October 2019, marking the fastest annual appreciation since April 2014. On a month-over-month basis, home prices increased by 1.1% compared to September 2020.
...
Home prices climbed in recent months due to heightened demand and ongoing home supply constraints. The supply shortage could further intensify as COVID-19 cases continue to rise and would-be sellers remain hesitant about putting their homes on the market. However, to keep up with the rising demand, new home construction surged in October and builder confidence reached a new high for the third consecutive month. The decreased pressure on supply could moderate home price growth over the next year. This is reflected in the CoreLogic HPI Forecast, which shows home prices slowing to 1.9% by October 2021. However, should the economic recovery from the pandemic be more robust, then we would expect projections for home price performance to improve.
“Home buyers have been spurred by record-low mortgage rates and an urgency to buy or upgrade to more space, especially as much of the American workforce continues to work from home,” said Frank Martell, president and CEO of CoreLogic. “First-time buyers in particular should remain a big part of next year’s home purchases, as the largest wave of millennials is heading into prime home-buying years.”
“The pandemic has shifted home buyer interest toward detached rather than attached homes,” said Dr. Frank Nothaft, chief economist at CoreLogic. “Detached homes offer more living space and are typically located in less densely populated neighborhoods. And while prices of single-family detached homes posted an annual increase of 7.9% in October, the price of attached homes rose only 4.5% year over year.”
emphasis added
Monday, November 30, 2020
Tuesday: ISM Manufacturing, Construction Spending, Fed Chair Powell Testimony
by Calculated Risk on 11/30/2020 09:46:00 PM
Tuesday:
• At 10:00 AM ET, ISM Manufacturing Index for November. The consensus is for 57.5%, down from 59.3%.
• Also at 10:00 AM, Construction Spending for October. The consensus is for 0.4% increase in spending.
• Also at 10:00 AM, Testimony, Fed Chair Jerome Powell, Coronavirus Aid, Relief, and Economic Security Act, Before the Committee on Banking, Housing, and Urban Affairs, U.S. Senate
• All day, Light vehicle sales for November. The consensus is for 16.2 million SAAR in November, unchanged from the BEA estimate of 16.2 million SAAR in October (Seasonally Adjusted Annual Rate).
November 30 COVID-19 Test Results; Record Hospitalizations
by Calculated Risk on 11/30/2020 07:45:00 PM
Note: The data has been distorted over the holiday weekend.
The US is now averaging over 1 million tests per day. Based on the experience of other countries, for adequate test-and-trace (and isolation) to reduce infections, the percent positive needs to be well under 5% (probably close to 1%), so the US still needs to increase the number of tests per day significantly (or take actions to push down the number of new infections).
There were 1,365,100 test results reported over the last 24 hours.
There were 147,074 positive tests.
Almost 37,000 US deaths have been reported so far in November. See the graph on US Daily Deaths here.
 Click on graph for larger image.
This data is from the COVID Tracking Project.
The percent positive over the last 24 hours was 10.7% (red line is 7 day average). The percent positive is calculated by dividing positive results by the sum of negative and positive results (I don't include pending).
And check out COVID Exit Strategy to see how each state is doing.
 The second graph shows the 7 day average of positive tests reported and daily hospitalizations.
The dashed line is the previous hospitalization maximum.
Note that there were very few tests available in March and April, and many cases were missed, so the hospitalizations was higher relative to the 7-day average of positive tests in July.
• Record Hospitalizations (Almost 100,000)
Fannie Mae: Mortgage Serious Delinquency Rate Decreased in October
by Calculated Risk on 11/30/2020 04:08:00 PM
Fannie Mae reported that the Single-Family Serious Delinquency decreased to 3.05% in October, from 3.20% in September. The serious delinquency rate is up from 0.67% in October 2019.
These are mortgage loans that are "three monthly payments or more past due or in foreclosure".
The Fannie Mae serious delinquency rate peaked in February 2010 at 5.59%.
 Click on graph for larger image
By vintage, for loans made in 2004 or earlier (2% of portfolio), 5.82% are seriously delinquent (up from 5.81% in September). For loans made in 2005 through 2008 (3% of portfolio), 9.84% are seriously delinquent (unchanged from 9.84%), For recent loans, originated in 2009 through 2018 (95% of portfolio), 2.57% are seriously delinquent (down from 2.74%). So Fannie is still working through a few poor performing loans from the bubble years.
Mortgages in forbearance are counted as delinquent in this monthly report, but they will not be reported to the credit bureaus.
This is very different from the increase in delinquencies following the housing bubble. Lending standards have been fairly solid over the last decade, and most of these homeowners have equity in their homes - and they will be able to restructure their loans once they are employed.
Note: Freddie Mac reported earlier.
Las Vegas Visitor Authority: No Convention Attendance, Visitor Traffic Down 49% YoY in October
by Calculated Risk on 11/30/2020 02:11:00 PM
From the Las Vegas Visitor Authority: October 2020 Las Vegas Visitor Statistics
Visitor volume continued to ramp‐up in October as the destination hosted approx. 1.86M visitors, about half of last October's tally but up 9% from last month.Here is the data from the Las Vegas Convention and Visitors Authority.
With continued hotel re‐openings at the end of Sep and in early Oct, the room tally of open properties in October represented 140,658 rooms. Total occupancy was 46.9% for the month as weekend occupancy reached 64.2% and midweek occupancy reached 38.6%.
Average daily rates among open properties reached $104.54 (‐3.3% MoM, ‐22.8% YoY) while RevPAR came in at roughly $49, down ‐59.7% vs. last October.
* Reflects weighted average of daily room tallies
 Click on graph for larger image.
 The blue and red bars are monthly visitor traffic (left scale) for 2019 and 2020. The dashed blue and orange lines are convention attendance (right scale).
Convention traffic in October was down 100% compared to October 2019.
And visitor traffic was down 49% YoY.
The casinos started to reopen on June 4th (it appears about 94% of rooms have now opened).
Dallas Fed: "Texas Manufacturing Expansion Moderates" in November
by Calculated Risk on 11/30/2020 10:41:00 AM
From the Dallas Fed: Texas Manufacturing Expansion Moderates
Texas factory activity expanded in November for the sixth consecutive month, though at a markedly slower pace, according to business executives responding to the Texas Manufacturing Outlook Survey. The production index, a key measure of state manufacturing conditions, fell from 25.5 to 7.2, indicating a deceleration in output growth.This was the last of the regional Fed surveys for November.
Other measures of manufacturing activity also point to slower growth this month, as the indexes remained positive but came in below last month’s readings. The new orders index dropped 13 points to 7.2, and the growth rate of orders index fell five points to 9.7. The capacity utilization index dropped from 23.0 to 6.9, and the shipments index fell from 21.9 to 13.7.
Perceptions of broader business conditions continued to improve in November, though the indexes retreated from their October levels. The general business activity index remained positive but fell from 19.8 to 12.0. Similarly, the company outlook index fell from 17.8 to 11.0. Uncertainty regarding companies’ outlooks continued to rise, though the index declined from 11.0 to 7.2.
Labor market measures indicated stronger growth in employment and work hours. The employment index ticked up three points to 11.7, suggesting a slight pickup in hiring. Twenty-five percent of firms noted net hiring, while 13 percent noted net layoffs. The hours worked index moved up from 3.7 to 9.7.
emphasis added
Here is a graph comparing the regional Fed surveys and the ISM manufacturing index:
 Click on graph for larger image.
The New York and Philly Fed surveys are averaged together (yellow, through November), and five Fed surveys are averaged (blue, through November) including New York, Philly, Richmond, Dallas and Kansas City. The Institute for Supply Management (ISM) PMI (red) is through October (right axis).
The ISM manufacturing index for November will be released tomorrow, December 1st. Based on these regional surveys, the ISM manufacturing index will likely decrease in November from the October level. The consensus is for a reading of 57.5%, down from 59.3%.
Note that these are diffusion indexes, so readings above 0 (or 50 for the ISM) means activity is increasing (it does not mean that activity is back to pre-crisis levels).
NAR: Pending Home Sales Decrease 1.1% in October
by Calculated Risk on 11/30/2020 10:02:00 AM
From the NAR: Pending Home Sales Dip 1.1% in October
Pending home sales fell slightly in October, according to the National Association of Realtors. Contract activity was mixed among the four major U.S. regions, with the only positive month-over-month growth happening in the South, although each region achieved year-over-year gains in pending home sales transactions.This was below expectations for this index. Note: Contract signings usually lead sales by about 45 to 60 days, so this would usually be for closed sales in November and December.
The Pending Home Sales Index (PHSI), a forward-looking indicator of home sales based on contract signings, fell 1.1% to 128.9 in October, the second straight month of decline. Year-over-year, contract signings rose 20.2%. An index of 100 is equal to the level of contract activity in 2001.
...
The Northeast PHSI slid 5.9% to 112.3 in October, a 18.5% increase from a year ago. In the Midwest, the index fell 0.7% to 119.6 last month, up 19.6% from October 2019.
Pending home sales in the South increased 0.1% to an index of 151.1 in October, up 21.0% from October 2019. The index in the West remained the same in October, at 116.8, which is up 20.8% from a year ago.
emphasis added
Seven High Frequency Indicators for the Economy
by Calculated Risk on 11/30/2020 08:29:00 AM
NOTE: Some of this data was impacted by Thanksgiving. For example, transit data is always down during holidays.
These indicators are mostly for travel and entertainment. It will interesting to watch these sectors recover as the vaccine is distributed.
IMPORTANT: Be safe now - if all goes well, we could all be vaccinated by Q2 2021.
----- Airlines: Transportation Security Administration -----
The TSA is providing daily travel numbers.
 Click on graph for larger image.
This data shows the seven day average of daily total traveler throughput from the TSA for 2019 (Blue) and 2020 (Red).
The dashed line is the percent of last year for the seven day average.
This data is as of Nov 29th.
The seven day average is down 61% from last year (39% of last year). (Dashed line)
There has been a slow increase from the bottom, and appears to have increased for the Thanksgiving week holiday.
----- Restaurants: OpenTable -----
The second graph shows the 7 day average of the year-over-year change in diners as tabulated by OpenTable for the US and several selected cities.
 Thanks to OpenTable for providing this restaurant data:
This data is updated through November 28, 2020.
This data is "a sample of restaurants on the OpenTable network across all channels: online reservations, phone reservations, and walk-ins. For year-over-year comparisons by day, we compare to the same day of the week from the same week in the previous year."
Note that this data is for "only the restaurants that have chosen to reopen in a given market". Since some restaurants have not reopened, the actual year-over-year decline is worse than shown.
Note that dining is generally lower in the northern states - Illinois, Pennsylvania, and New York - and only down slightly in the southern states.
----- Movie Tickets: Box Office Mojo -----
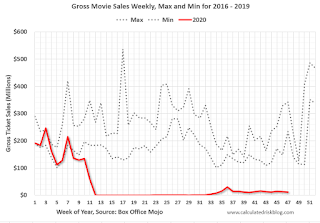 This data shows domestic box office for each week (red) and the maximum and minimum for the previous four years. Data is from BoxOfficeMojo through November 26th.
Note that the data is usually noisy week-to-week and depends on when blockbusters are released.
Movie ticket sales have picked up slightly over the last couple of months, and were at $12 million last week (compared to usually around $300 million per week during the Thanksgiving blockbuster period).
Some movie theaters have reopened (probably with limited seating).
----- Hotel Occupancy: STR -----
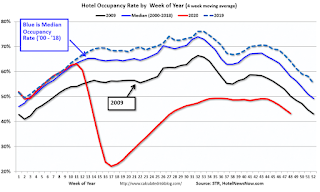 This graph shows the seasonal pattern for the hotel occupancy rate using the four week average.
The red line is for 2020, dash light blue is 2019, blue is the median, and black is for 2009 (the worst year since the Great Depression for hotels - prior to 2020).
This data is through November 21st. Hotel occupancy is currently down 32.6% year-over-year.
Notes: Y-axis doesn't start at zero to better show the seasonal change.
Since there is a seasonal pattern to the occupancy rate, we can track the year-over-year change in occupancy to look for any improvement. This table shows the year-over-year change since the week ending Sept 19, 2020:
This suggests no improvement over the last 10 weeks.
----- Gasoline Supplied: Energy Information Administration -----
 This graph, based on weekly data from the U.S. Energy Information Administration (EIA), shows gasoline supplied compared to the same week last year of .
At one point, gasoline supplied was off almost 50% YoY.
As of November 20th, gasoline supplied was off about 11.7% YoY (about 88.3% of last year).
Note: People driving instead of flying might have boosted gasoline consumption over the summer.
----- Transit: Apple Mobility -----
This graph is from Apple mobility. From Apple: "This data is generated by counting the number of requests made to Apple Maps for directions in select countries/regions, sub-regions, and cities." This is just a general guide - people that regularly commute probably don't ask for directions.
There is also some great data on mobility from the Dallas Fed Mobility and Engagement Index. However the index is set "relative to its weekday-specific average over January–February", and is not seasonally adjusted, so we can't tell if an increase in mobility is due to recovery or just the normal increase in the Spring and Summer.
 This data is through November 28th for the United States and several selected cities.
The graph is the running 7 day average to remove the impact of weekends.
IMPORTANT: All data is relative to January 13, 2020. This data is NOT Seasonally Adjusted. People walk and drive more when the weather is nice, so I'm just using the transit data.
According to the Apple data directions requests, public transit in the 7 day average for the US is at 44% of the January level. It is at 31% in Chicago, and 49% in Houston - and declining recently.
----- New York City Subway Usage -----
Here is some interesting data on New York subway usage (HT BR).
 This graph is from Todd W Schneider. This is daily data for this year.
This data is through Friday, November 27th.
Schneider has graphs for each borough, and links to all the data sources.
He notes: "Data updates weekly from the MTA’s public turnstile data, usually on Saturday mornings".
The TSA is providing daily travel numbers.
 Click on graph for larger image.
This data shows the seven day average of daily total traveler throughput from the TSA for 2019 (Blue) and 2020 (Red).
The dashed line is the percent of last year for the seven day average.
This data is as of Nov 29th.
The seven day average is down 61% from last year (39% of last year). (Dashed line)
There has been a slow increase from the bottom, and appears to have increased for the Thanksgiving week holiday.
The second graph shows the 7 day average of the year-over-year change in diners as tabulated by OpenTable for the US and several selected cities.
 Thanks to OpenTable for providing this restaurant data:
This data is updated through November 28, 2020.
This data is "a sample of restaurants on the OpenTable network across all channels: online reservations, phone reservations, and walk-ins. For year-over-year comparisons by day, we compare to the same day of the week from the same week in the previous year."
Note that this data is for "only the restaurants that have chosen to reopen in a given market". Since some restaurants have not reopened, the actual year-over-year decline is worse than shown.
Note that dining is generally lower in the northern states - Illinois, Pennsylvania, and New York - and only down slightly in the southern states.
 This data shows domestic box office for each week (red) and the maximum and minimum for the previous four years. Data is from BoxOfficeMojo through November 26th.
Note that the data is usually noisy week-to-week and depends on when blockbusters are released.
Movie ticket sales have picked up slightly over the last couple of months, and were at $12 million last week (compared to usually around $300 million per week during the Thanksgiving blockbuster period).
Some movie theaters have reopened (probably with limited seating).
 This graph shows the seasonal pattern for the hotel occupancy rate using the four week average.
 The red line is for 2020, dash light blue is 2019, blue is the median, and black is for 2009 (the worst year since the Great Depression for hotels - prior to 2020).
This data is through November 21st. Hotel occupancy is currently down 32.6% year-over-year.
Notes: Y-axis doesn't start at zero to better show the seasonal change.
Since there is a seasonal pattern to the occupancy rate, we can track the year-over-year change in occupancy to look for any improvement. This table shows the year-over-year change since the week ending Sept 19, 2020:
| Week Ending | YoY Change, Occupancy Rate |
|---|---|
| 9/19 | -31.9% |
| 9/26 | -31.5% |
| 10/3 | -29.6% |
| 10/10 | -29.2% |
| 10/17 | -30.7% |
| 10/24 | -31.7% |
| 10/31 | -29.0% |
| 11/7 | -35.9% |
| 11/14 | -32.7% |
| 11/21 | -32.6% |
This suggests no improvement over the last 10 weeks.
 This graph, based on weekly data from the U.S. Energy Information Administration (EIA), shows gasoline supplied compared to the same week last year of .
At one point, gasoline supplied was off almost 50% YoY.
As of November 20th, gasoline supplied was off about 11.7% YoY (about 88.3% of last year).
Note: People driving instead of flying might have boosted gasoline consumption over the summer.
This graph is from Apple mobility. From Apple: "This data is generated by counting the number of requests made to Apple Maps for directions in select countries/regions, sub-regions, and cities." This is just a general guide - people that regularly commute probably don't ask for directions.
There is also some great data on mobility from the Dallas Fed Mobility and Engagement Index. However the index is set "relative to its weekday-specific average over January–February", and is not seasonally adjusted, so we can't tell if an increase in mobility is due to recovery or just the normal increase in the Spring and Summer.
 This data is through November 28th for the United States and several selected cities.
The graph is the running 7 day average to remove the impact of weekends.
IMPORTANT: All data is relative to January 13, 2020. This data is NOT Seasonally Adjusted. People walk and drive more when the weather is nice, so I'm just using the transit data.
According to the Apple data directions requests, public transit in the 7 day average for the US is at 44% of the January level. It is at 31% in Chicago, and 49% in Houston - and declining recently.
Here is some interesting data on New York subway usage (HT BR).
 This graph is from Todd W Schneider. This is daily data for this year.
This data is through Friday, November 27th.
Schneider has graphs for each borough, and links to all the data sources.
He notes: "Data updates weekly from the MTA’s public turnstile data, usually on Saturday mornings".
Sunday, November 29, 2020
Sunday Night Futures
by Calculated Risk on 11/29/2020 09:10:00 PM
Weekend:
• Schedule for Week of November 29, 2020
Monday:
• At 9:45 AM ET, Chicago Purchasing Managers Index for November.
• At 10:00 AM, Pending Home Sales Index for October. The consensus is for a 2.0% increase in the index.
• At 10:30 AM, Dallas Fed Survey of Manufacturing Activity for November. This is the last of the regional Fed manufacturing surveys for November.
From CNBC: Pre-Market Data and Bloomberg futures S&P 500 and DOW futures are mostly unchanged (fair value).
Oil prices were up over the last week with WTI futures at $45.10 per barrel and Brent at $47.60 barrel. A year ago, WTI was at $58, and Brent was at $65 - so WTI oil prices are down about 25% year-over-year.
Here is a graph from Gasbuddy.com for nationwide gasoline prices. Nationally prices are at $2.10 per gallon. A year ago prices were at $2.60 per gallon, so gasoline prices are down $0.50 per gallon year-over-year.
November 29 COVID-19 Test Results; Record Hospitalizations
by Calculated Risk on 11/29/2020 07:06:00 PM
Note: The data will be unusual over the holiday weekend. Stay Safe!!!
The US is now averaging over 1 million tests per day. Based on the experience of other countries, for adequate test-and-trace (and isolation) to reduce infections, the percent positive needs to be well under 5% (probably close to 1%), so the US still needs to increase the number of tests per day significantly (or take actions to push down the number of new infections).
There were 1,011,883 test results reported over the last 24 hours.
There were 131,441 positive tests.
Almost 36,000 US deaths have been reported so far in November. See the graph on US Daily Deaths here.
 Click on graph for larger image.
This data is from the COVID Tracking Project.
The percent positive over the last 24 hours was 13.0% (red line is 7 day average). The percent positive is calculated by dividing positive results by the sum of negative and positive results (I don't include pending).
And check out COVID Exit Strategy to see how each state is doing.
 The second graph shows the 7 day average of positive tests reported and daily hospitalizations.
The dashed line is the previous hospitalization maximum.
Note that there were very few tests available in March and April, and many cases were missed, so the hospitalizations was higher relative to the 7-day average of positive tests in July.
• Record Hospitalizations.


