 RSS Feed
 by Calculated Risk on 11/06/2020 12:16:00 PM
Friday, November 06, 2020
Las Vegas Real Estate in October: Sales up 11% YoY, Inventory down 34% YoY
This report is for closed sales in October; sales are counted at the close of escrow, so the contracts for these homes were mostly signed in August and September.
The Las Vegas Realtors reported With rising prices and supply not meeting demand, local housing market looking like rest of U.S.; LVR housing statistics for October 2020
“COVID-19 appears to have extended the typical summer buying period by several months,” said 2020 LVR President Tom Blanchard, a longtime local REALTOR®. “The continued demand in our housing market is still not being met and is putting upward pressure on home values. Although we see increased permits by local homebuilders, they are still not meeting the demand that is out there.”1) Overall sales were up 10.9% year-over-year to 3,961 in October 2020 from 3,571 in October 2019.
...
LVR reported a total of 3,961 existing local homes, condos and townhomes were sold during October. Compared to the same time last year, October sales were up 11.2% for homes and up 9.5% for condos and townhomes.
...
By the end of October, LVR reported 4,501 single-family homes listed for sale without any sort of offer. That’s down 37.6% from one year ago. For condos and townhomes, the 1,428 properties listed without offers in October represent a 21.0% drop from one year ago.
…
Despite the coronavirus crisis, the number of so-called distressed sales remains near historically low levels. LVR reported that short sales and foreclosures combined accounted for just 0.9% of all existing local property sales in October. That compares to 2.4% of all sales one year ago, 3.0% two years ago and 5.2% three years ago.
emphasis added
2) Active inventory (single-family and condos) is down from a year ago, from a total of 9,164 in October 2019 to 5,929 in October 2020. Note: Total inventory was down 34.3% year-over-year. And months of inventory is low.
3) Low level of distressed sales.
Comments on October Employment Report
by Calculated Risk on 11/06/2020 09:23:00 AM
The October employment report was at expectations, and employment for the previous two months were revised up slightly.
Government employment declined 268 thousand in October. The job losses at the Federal level were due to letting go temporary decennial workers, but 130 thousand jobs were lost at state and local governments. These losses could increase sharply if there is no disaster relief for the states. I'll have more on this.
Leisure and hospitality added another 271 thousand jobs in October, following 4.56 million jobs added in May through September. Leisure and hospitality lost 8.3 million jobs in March and April, so about 58% of those jobs were added back in the May through October period.
Earlier: October Employment Report: 638 Thousand Jobs Added, 6.9% Unemployment Rate
In October, the year-over-year employment change was minus 9.18 million jobs.
Permanent Job Losers
 Click on graph for larger image.
This graph shows permanent job losers as a percent of the pre-recession peak in employment through the October report. (ht Joe Weisenthal at Bloomberg)
This data is only available back to 1994, so there is only data for three recessions.
In October, the number of permanent job losers decreased to 3.684 million from 3.756 million in September.
Prime (25 to 54 Years Old) Participation
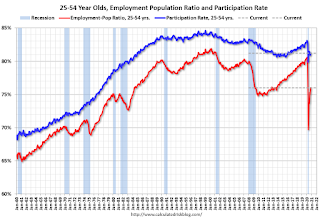 Since the overall participation rate has declined due to cyclical (recession) and demographic (aging population, younger people staying in school) reasons, here is the employment-population ratio for the key working age group: 25 to 54 years old.
The prime working age will be key in the eventual recovery.
The 25 to 54 participation rate increased in October 81.2% to from 80.9% in September, and the 25 to 54 employment population ratio increased to 76.0% from 75.0%.
Seasonal Retail Hiring
Typically retail companies start hiring for the holiday season in October, and really increase hiring in November. Here is a graph that shows the historical net retail jobs added for October, November and December by year.
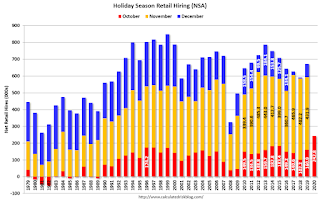 This graph really shows the collapse in retail hiring in 2008. Since then seasonal hiring had increased back close to more normal levels. Note: I expect the long term trend will be down with more and more internet holiday shopping.
Retailers hired 243 thousand workers (NSA) net in October. Note: this is NSA (Not Seasonally Adjusted).
This might be distorted this year by a combination of seasonal hiring - and some bounce back in employment from the shutdowns earlier this year.
Part Time for Economic Reasons
 From the BLS report:
These workers are included in the alternate measure of labor underutilization (U-6) that decreased to 12.1% in October. This is down from the record high in April 22.8% for this measure since 1994.
Unemployed over 26 Weeks
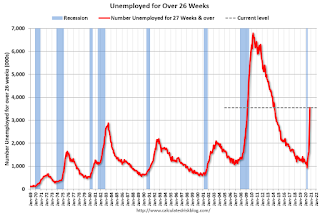 This graph shows the number of workers unemployed for 27 weeks or more.
According to the BLS, there are 3.556 million workers who have been unemployed for more than 26 weeks and still want a job.
This increased sharply in October - since the largest number of layoffs were in April - and will be a key measure to follow during the recovery.
Summary:
The headline monthly jobs number was at expectations, and the previous two months were revised up 15,000 combined. The headline unemployment rate decreased to 6.9%. However the number of part time workers increased, and the number of long term unemployed increased sharply.
Leisure and hospitality added another 271 thousand jobs in October, following 4.56 million jobs added in May through September. Leisure and hospitality lost 8.3 million jobs in March and April, so about 58% of those jobs were added back in the May through October period.
Earlier: October Employment Report: 638 Thousand Jobs Added, 6.9% Unemployment Rate
In October, the year-over-year employment change was minus 9.18 million jobs.
Permanent Job Losers
 Click on graph for larger image.
This graph shows permanent job losers as a percent of the pre-recession peak in employment through the October report. (ht Joe Weisenthal at Bloomberg)
This data is only available back to 1994, so there is only data for three recessions.
In October, the number of permanent job losers decreased to 3.684 million from 3.756 million in September.
Prime (25 to 54 Years Old) Participation
 Since the overall participation rate has declined due to cyclical (recession) and demographic (aging population, younger people staying in school) reasons, here is the employment-population ratio for the key working age group: 25 to 54 years old.
The prime working age will be key in the eventual recovery.
The 25 to 54 participation rate increased in October 81.2% to from 80.9% in September, and the 25 to 54 employment population ratio increased to 76.0% from 75.0%.
Seasonal Retail Hiring
Typically retail companies start hiring for the holiday season in October, and really increase hiring in November. Here is a graph that shows the historical net retail jobs added for October, November and December by year.
 This graph really shows the collapse in retail hiring in 2008. Since then seasonal hiring had increased back close to more normal levels. Note: I expect the long term trend will be down with more and more internet holiday shopping.
Retailers hired 243 thousand workers (NSA) net in October. Note: this is NSA (Not Seasonally Adjusted).
This might be distorted this year by a combination of seasonal hiring - and some bounce back in employment from the shutdowns earlier this year.
Part Time for Economic Reasons
 From the BLS report:
"The number of persons employed part time for economic reasons increased by 383,000 to 6.7 million in October, after declines totaling 4.6 million over the prior 5 months. These individuals, who would have preferred full-time employment, were working part time because their hours had been reduced or they were unable to find full-time jobs."The number of persons working part time for economic reasons increased in October to 6.684 million from 6.300 million in September.
These workers are included in the alternate measure of labor underutilization (U-6) that decreased to 12.1% in October. This is down from the record high in April 22.8% for this measure since 1994.
Unemployed over 26 Weeks
 This graph shows the number of workers unemployed for 27 weeks or more.
 According to the BLS, there are 3.556 million workers who have been unemployed for more than 26 weeks and still want a job.
This increased sharply in October - since the largest number of layoffs were in April - and will be a key measure to follow during the recovery.
Summary:
The headline monthly jobs number was at expectations, and the previous two months were revised up 15,000 combined. The headline unemployment rate decreased to 6.9%. However the number of part time workers increased, and the number of long term unemployed increased sharply.
October Employment Report: 638 Thousand Jobs Added, 6.9% Unemployment Rate
by Calculated Risk on 11/06/2020 08:41:00 AM
From the BLS:
Total nonfarm payroll employment rose by 638,000 in October, and the unemployment rate declined to 6.9 percent, the U.S. Bureau of Labor Statistics reported today. These improvements in the labor market reflect the continued resumption of economic activity that had been curtailed due to the coronavirus (COVID-19) pandemic and efforts to contain it. In October, notable job gains occurred in leisure and hospitality, professional and business services, retail trade, and construction. Employment in government declined.
...
In October, the unemployment rate declined by 1.0 percentage point to 6.9 percent, and the number of unemployed persons fell by 1.5 million to 11.1 million. Both measures have declined for 6 consecutive months but are nearly twice their February levels (3.5 percent and 5.8 million, respectively).
...
The change in total nonfarm payroll employment for August was revised up by 4,000 from +1,489,000 to +1,493,000, and the change for September was revised up by 11,000 from +661,000 to +672,000. With these revisions, employment in August and September combined was 15,000 higher than previously reported.
emphasis added
 Click on graph for larger image.
The first graph shows the year-over-year change in total non-farm employment since 1968.
In October, the year-over-year change was negative 9.18 million jobs.
Total payrolls increased by 638 thousand in October.
Payrolls for August and September were revised up 15 thousand combined.
 The second graph shows the job losses from the start of the employment recession, in percentage terms.
The current employment recession is by far the worst recession since WWII in percentage terms, and is still worse than the worst of the "Great Recession".
The third graph shows the employment population ratio and the participation rate.
 The Labor Force Participation Rate increased to 61.7% in October. This is the percentage of the working age population in the labor force.
 The Employment-Population ratio increased to 57.4% (black line).
I'll post the 25 to 54 age group employment-population ratio graph later.
 The fourth graph shows the unemployment rate.
 The unemployment rate decreased in October to 6.9%.
This was close to consensus expectations, and August and September were revised up by 15,000 combined.
I'll have much more later …
Black Knight: Number of Homeowners in COVID-19-Related Forbearance Plans Decreased
by Calculated Risk on 11/06/2020 08:15:00 AM
Note: Both Black Knight and the MBA (Mortgage Bankers Association) are putting out weekly estimates of mortgages in forbearance.
This data is as of November 3rd.
From Black Knight: Forbearance Fall 5% After Slight Increase
After last week’s slight increase, the latest data from Black Knight’s McDash Flash Forbearance Tracker shows that nationwide forbearance volumes have fallen by 152,000 (-5%) since last Tuesday, driven by October forbearance expiration activity. This was roughly what was expected for the first week of the month, though we will be on the lookout for further potential drops, given the remaining scheduled expirations. With some 161,000 active forbearance plans having expired at the end of October, additional extension and/or removal activity could be seen in coming days.
...
As of Nov. 3, there are 2.9 million active forbearance plans, representing some 5.4% of mortgage-holders, down from 5.7% last week and the lowest we’ve seen since mid-April during the onset of the pandemic. Together, they represent $584 billion in unpaid principal.
Click on graph for larger image.
There were 87,000 starts over the past week, the largest volume since April, but 57% of these were repeat starts for borrowers who had previously been in forbearance, left their plans, and have since returned. These forbearance starts and restarts are worth watching, as we see them trending upward. It may well be that this is still due to the drop in early October, but given the rising trend, they warrant a close eye.
emphasis added

Thursday, November 05, 2020
Friday: Employment Report
by Calculated Risk on 11/05/2020 09:15:00 PM
My October Employment Preview
Goldman October Payrolls Preview
Friday:
• At 8:30 AM ET, Employment Report for October. The consensus is for 600 thousand jobs added, and for the unemployment rate to decrease to 7.6%.
 Click on graph for larger image.
This graph shows the job losses from the start of the employment recession, in percentage terms through September.
The current employment recession was by far the worst recession since WWII in percentage terms, and the worst in terms of the unemployment rate.
November 5 COVID-19 Test Results; Record Cases; Hospitalizations over 53,000
by Calculated Risk on 11/05/2020 06:50:00 PM
Note: I look forward to when I will not be posting this daily!
The US is now averaging close to 1 million tests per day. Based on the experience of other countries, for adequate test-and-trace (and isolation) to reduce infections, the percent positive needs to be well under 5% (probably close to 1%), so the US still needs to increase the number of tests per day significantly (or take actions to push down the number of new infections).
There were 1,271,748 test results reported over the last 24 hours.
There were 116,255 positive tests. (New record)
Over 4,500 US deaths have been reported so far in November. See the graph on US Daily Deaths here.
 Click on graph for larger image.
This data is from the COVID Tracking Project.
The percent positive over the last 24 hours was 9.1% (red line is 7 day average).
For the status of contact tracing by state, check out testandtrace.com.
And check out COVID Exit Strategy to see how each state is doing.
 The second graph shows the 7 day average of positive tests reported.
The dashed line is the July high.
Note that there were very few tests available in March and April, and many cases were missed (the percent positive was very high - see first graph). By June, the percent positive had dropped below 5%.
This is a new record 7-day average cases for the USA.
Goldman October Payrolls Preview
by Calculated Risk on 11/05/2020 03:06:00 PM
A few brief excerpts from a note by Goldman Sachs economist Spencer Hill:
We estimate nonfarm payrolls rose 500k in October, below consensus of 600k. High-frequency labor market information indicates further deceleration in job growth, consistent with a drag from the virus resurgence and fiscal fizzle. ...CR Note: The consensus is for 600 thousand jobs added, and for the unemployment rate to decrease to 7.6%.
We estimate the unemployment rate declined by two tenths to 7.7%.
emphasis added
FOMC Statement: No Change
by Calculated Risk on 11/05/2020 02:04:00 PM
Fed Chair Powell press conference video here starting at 2:30 PM ET.
FOMC Statement:
The Federal Reserve is committed to using its full range of tools to support the U.S. economy in this challenging time, thereby promoting its maximum employment and price stability goals.
The COVID-19 pandemic is causing tremendous human and economic hardship across the United States and around the world. Economic activity and employment have continued to recover but remain well below their levels at the beginning of the year. Weaker demand and earlier declines in oil prices have been holding down consumer price inflation. Overall financial conditions remain accommodative, in part reflecting policy measures to support the economy and the flow of credit to U.S. households and businesses.
The path of the economy will depend significantly on the course of the virus. The ongoing public health crisis will continue to weigh on economic activity, employment, and inflation in the near term, and poses considerable risks to the economic outlook over the medium term.
The Committee seeks to achieve maximum employment and inflation at the rate of 2 percent over the longer run. With inflation running persistently below this longer-run goal, the Committee will aim to achieve inflation moderately above 2 percent for some time so that inflation averages 2 percent over time and longer-term inflation expectations remain well anchored at 2 percent. The Committee expects to maintain an accommodative stance of monetary policy until these outcomes are achieved. The Committee decided to keep the target range for the federal funds rate at 0 to 1/4 percent and expects it will be appropriate to maintain this target range until labor market conditions have reached levels consistent with the Committee's assessments of maximum employment and inflation has risen to 2 percent and is on track to moderately exceed 2 percent for some time. In addition, over coming months the Federal Reserve will increase its holdings of Treasury securities and agency mortgage-backed securities at least at the current pace to sustain smooth market functioning and help foster accommodative financial conditions, thereby supporting the flow of credit to households and businesses.
In assessing the appropriate stance of monetary policy, the Committee will continue to monitor the implications of incoming information for the economic outlook. The Committee would be prepared to adjust the stance of monetary policy as appropriate if risks emerge that could impede the attainment of the Committee's goals. The Committee's assessments will take into account a wide range of information, including readings on public health, labor market conditions, inflation pressures and inflation expectations, and financial and international developments.
Voting for the monetary policy action were Jerome H. Powell, Chair; John C. Williams, Vice Chair; Michelle W. Bowman; Lael Brainard; Richard H. Clarida; Mary C. Daly; Patrick Harker; Robert S. Kaplan; Loretta J. Mester; and Randal K. Quarles. Ms. Daly voted as an alternate member at this meeting.
emphasis added
October Employment Preview
by Calculated Risk on 11/05/2020 10:58:00 AM
On Friday at 8:30 AM ET, the BLS will release the employment report for October. The consensus is for 600 thousand jobs added, and for the unemployment rate to decrease to 7.6%.
• Decennial Census: The decennial Census will subtract 147,311 temporary jobs.
• ADP Report: The ADP employment report showed a gain of 365,000 private sector jobs, well below the consensus estimate of 650 thousand jobs. The ADP report hasn't been very useful in predicting the BLS report, but this suggests the BLS report could be weaker than expected.
• ISM Surveys: The ISM manufacturing employment index increased in October to 53.2% from 49.6% in September, and is finally above 50. This would suggest essentially no change in manufacturing jobs in October - although ADP showed 7,000 manufacturing jobs added.
The ISM Services employment index decreased in October to 50.1% from 51.8% in October, and is just above 50. This would suggest around 75,000 service jobs added in October. Combined, the ISM surveys suggest around 75,000 private sector jobs added in October. The ISM surveys haven't been as useful as usual during the pandemic, but this does suggest the report could be weaker than expected.
• Unemployment Claims: The weekly claims report showed a high number of total continuing unemployment claims during the reference week, although this might not be very useful right now. If we did a "Rip Van Winkle", and saw the weekly claims report this morning, we'd think the economy was in a deep recession!
• Homebase, Kronos/UKG: There are other indicators that analysts are looking at - like Homebase hours worked and Kronos (see Ernie Tedeschi comments).
 Click on graph for larger image.
"Data from Homebase, Kronos/UKG, and UI claims since mid-September would be consistent with +801K jobs created in October, seasonally-adjusted.• Seasonal Retail Hiring: Typically retail companies start hiring for the holiday season in October, and really increase hiring in November. Here is a graph that shows the historical net retail jobs added for October, November and December by year.
That number would be very modestly above September's pace of +661K.
But, of course, the uncertainty here is large."
 Click on graph for larger image.
In 2019, retailers hired 161,000 seasonal employees (NSA) in October. This translated to a gain of 22,000 SA. Brick and Mortar retailers could be more cautious this year, and retail might decline SA in October.
There could even be a larger impact in November. In 2019, retailers hired 432,000 temporary employees NSA in November, and this translated to a loss of 14,000 jobs SA. This will be something to watch.
 • Permanent Job Losers: Something to watch in the employment report will be "Permanent job losers". While there has been a strong bounce back in total employment, from the shutdown in March and April, permanent job losers have continued to increase.
This graph shows permanent job losers as a percent of the pre-recession peak in employment through the September report.
This data is only available back to 1994, so there is only data for three recessions. In September, the number of permanent job losers increased to 3.756 million from 3.411 million in August.
• Merrill Lynch forecast: "The October jobs report will likely reveal a moderation in nonfarm payroll growth to 625k, down from 661k in September. Census workers will contribute a notable drag – excluding government, we expect solid private payroll growth of 800k. The unemployment rate will likely improve to 7.6% from 7.9% in September."
• Conclusion: The employment related data has been all over the place, but most of the indicators suggest a weaker report in October than in September. My guess is the report will be lower than the consensus.
Weekly Initial Unemployment Claims at 751,000
by Calculated Risk on 11/05/2020 08:38:00 AM
The DOL reported:
In the week ending October 31, the advance figure for seasonally adjusted initial claims was 751,000, a decrease of 7,000 from the previous week's revised level. The previous week's level was revised up by 7,000 from 751,000 to 758,000. The 4-week moving average was 787,000, a decrease of 4,000 from the previous week's revised average. The previous week's average was revised up by 3,250 from 787,750 to 791,000.This does not include the 362,883 initial claims for Pandemic Unemployment Assistance (PUA) that was up from 359,044 the previous week. (There are some questions on PUA numbers).
emphasis added
The following graph shows the 4-week moving average of weekly claims since 1971.
 Click on graph for larger image.
The dashed line on the graph is the current 4-week average. The four-week average of weekly unemployment claims decreased to 787,000.
The previous week was revised up.
The second graph shows seasonally adjust continued claims since 1967 (lags initial by one week).
 At the worst of the Great Recession, continued claims peaked at 6.635 million, but then steadily declined.
Continued claims decreased to 7,285,000 (SA) from 7,823,000 (SA) last week and will likely stay at a high level until the crisis abates.
Note: There are an additional 9,332,610 receiving Pandemic Unemployment Assistance (PUA) that decreased from 10,324,779 the previous week (there are questions about these numbers). This is a special program for business owners, self-employed, independent contractors or gig workers not receiving other unemployment insurance.
An additional 3,961,060 are receiving Pandemic Emergency Unemployment Compensation (PEUC) that increased from 3,683,496 the previous week.


