by Calculated Risk on 11/06/2020 08:41:00 AM
Friday, November 06, 2020
October Employment Report: 638 Thousand Jobs Added, 6.9% Unemployment Rate
From the BLS:
Total nonfarm payroll employment rose by 638,000 in October, and the unemployment rate declined to 6.9 percent, the U.S. Bureau of Labor Statistics reported today. These improvements in the labor market reflect the continued resumption of economic activity that had been curtailed due to the coronavirus (COVID-19) pandemic and efforts to contain it. In October, notable job gains occurred in leisure and hospitality, professional and business services, retail trade, and construction. Employment in government declined.
...
In October, the unemployment rate declined by 1.0 percentage point to 6.9 percent, and the number of unemployed persons fell by 1.5 million to 11.1 million. Both measures have declined for 6 consecutive months but are nearly twice their February levels (3.5 percent and 5.8 million, respectively).
...
The change in total nonfarm payroll employment for August was revised up by 4,000 from +1,489,000 to +1,493,000, and the change for September was revised up by 11,000 from +661,000 to +672,000. With these revisions, employment in August and September combined was 15,000 higher than previously reported.
emphasis added
 Click on graph for larger image.
The first graph shows the year-over-year change in total non-farm employment since 1968.
In October, the year-over-year change was negative 9.18 million jobs.
Total payrolls increased by 638 thousand in October.
Payrolls for August and September were revised up 15 thousand combined.
 The second graph shows the job losses from the start of the employment recession, in percentage terms.
The current employment recession is by far the worst recession since WWII in percentage terms, and is still worse than the worst of the "Great Recession".
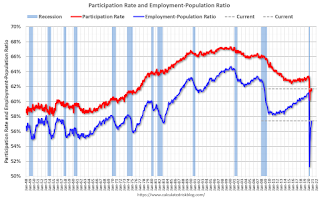
The third graph shows the employment population ratio and the participation rate.
 The Labor Force Participation Rate increased to 61.7% in October. This is the percentage of the working age population in the labor force.
 The Employment-Population ratio increased to 57.4% (black line).
I'll post the 25 to 54 age group employment-population ratio graph later.
 The fourth graph shows the unemployment rate.
 The unemployment rate decreased in October to 6.9%.
This was close to consensus expectations, and August and September were revised up by 15,000 combined.
I'll have much more later …


