 RSS Feed
 by Calculated Risk on 7/29/2020 07:00:00 AM
Wednesday, July 29, 2020
MBA: Mortgage Applications Decrease in Latest Weekly Survey
From the MBA: Mortgage Applications Decrease in Latest MBA Weekly Survey
Mortgage applications decreased 0.8 percent from one week earlier, according to data from the Mortgage Bankers Association’s (MBA) Weekly Mortgage Applications Survey for the week ending July 24, 2020.
... The Refinance Index decreased 0.4 percent from the previous week and was 121 percent higher than the same week one year ago. The seasonally adjusted Purchase Index decreased 2 percent from one week earlier. The unadjusted Purchase Index decreased 1 percent compared with the previous week and was 21 percent higher than the same week one year ago.
“Mortgage rates remained near record lows for conventional loans last week, and refinances in the conventional sector continued to slightly increase. However, rates on FHA loans rose, leading to an almost 18 percent drop in FHA refinances,” said Mike Fratantoni, MBA’s Senior Vice President and Chief Economist. “Homebuyers stepped back slightly, and there was a larger drop in purchase application volume for FHA, VA, and USDA loans. This trend, along with the fact that average loan sizes are increasing, indicate that prospective first-time buyers are being impacted more by the rising economic stress caused by the resurgence in COVID-19 cases, as well as the uncertainty on how the next round of government support will take shape.”
...
The average contract interest rate for 30-year fixed-rate mortgages with conforming loan balances ($510,400 or less) remained unchanged at 3.20 percent, with points increasing to 0.37 from 0.35 (including the origination fee) for 80 percent loan-to-value ratio (LTV) loans.
emphasis added
 Click on graph for larger image.
The first graph shows the refinance index since 1990.
The refinance index has been very volatile recently depending on rates and liquidity.
But with record low rates, the index is up significantly from last year.
 The second graph shows the MBA mortgage purchase index
According to the MBA, purchase activity is up 21% year-over-year.
Note: Red is a four-week average (blue is weekly).
Tuesday, July 28, 2020
Wednesday: FOMC Meeting, Pending Home Sales
by Calculated Risk on 7/28/2020 09:09:00 PM
Wednesday:
• At 7:00 AM ET, The Mortgage Bankers Association (MBA) will release the results for the mortgage purchase applications index.
• At 10:00 AM, Pending Home Sales Index for June. The consensus is for a 15.3% increase in the index.
• At 2:00 PM, FOMC Meeting Announcement. No change to policy is expected at this meeting.
• At 2:30 PM, Fed Chair Jerome Powell holds a press briefing following the FOMC announcement.
Zillow Case-Shiller Forecast: Year-over-year House Price Growth to Slow Slightly in June
by Calculated Risk on 7/28/2020 07:47:00 PM
The Case-Shiller house price indexes for May were released earlier today. Zillow forecasts Case-Shiller a month early, and I like to check the Zillow forecasts since they have been pretty close.
From Matthew Speakman at Zillow: May Case-Shiller Results and June Forecast: Housing Doesn't Blink in Face of Pandemic
Record-low mortgage rates and a shortage of available homes have fueled competition amongst buyers in the spring and early summer, leading to homes flying off the market at their fastest pace in years and home prices to continue to rise. The savings afforded by record-low mortgage rates allows those who are still in a strong financial position the opportunity to buy a home – and might also allow them to pursue homes that were previously above their price range. Some, of course, are not nearly as fortunate. Data since May suggest that demand and price dynamics have continued, but substantial risks have emerged in recent weeks. A resurgence in coronavirus case counts, and the broader economic uncertainty that accompanies it, poses new risks to the outlook for home prices, and seasonal factors should start to erode buyer demand. It’s likely that the housing market will feel the effects of this downturn at some point, but a shortage of inventory and low rates should continue to place upward pressure on prices.
... S&P Dow Jones Indices is expected to release data for the June S&P CoreLogic Case-Shiller Indices on Tuesday, August 25.
emphasis added
 The Zillow forecast is for the year-over-year change for the Case-Shiller National index to be at 4.3% in June, down from 4.5% in May.
 The Zillow forecast is for the 20-City index to be up 3.4% YoY in June from 3.7% in May, and for the 10-City index to increase to be up 2.8% YoY compared to 3.1% YoY in May.
July 28 COVID-19 Test Results
by Calculated Risk on 7/28/2020 06:18:00 PM
Note: California is having a data problem today, so the case and test counts are low for California.
California Department of Public Health (CDPH) is experiencing an issue processing electronic laboratory reports from some labs. As a result, there are reduced tests and cases reported due to the delay with receiving these reports.The US is now reporting over 700,000 tests per day. Based on the experience of other countries, the percent positive needs to be well under 5% to really push down new infections, so the US still needs to increase the number of tests per day significantly (or take actions to push down the number of new infections).
There were 733,243 test results reported over the last 24 hours.
There were 53,507 positive tests.
The seven day average of daily deaths has moved higher for the 13th consecutive day to over 1,000 per day. See the graph on US Daily Deaths here.
 Click on graph for larger image.
This data is from the COVID Tracking Project.
The percent positive over the last 24 hours was 7.3% (red line).
For the status of contact tracing by state, check out testandtrace.com.
And check out COVID Exit Strategy to see how each state is doing.
Update: A few comments on the Seasonal Pattern for House Prices
by Calculated Risk on 7/28/2020 01:31:00 PM
CR Note: This is a repeat of earlier posts with updated graphs.
A few key points:
1) There is a clear seasonal pattern for house prices.
2) The surge in distressed sales during the housing bust distorted the seasonal pattern.
3) Even though distressed sales are down significantly, the seasonal factor is based on several years of data - and the factor is now overstating the seasonal change (second graph below).
4) Still the seasonal index is probably a better indicator of actual price movements than the Not Seasonally Adjusted (NSA) index.
For in depth description of these issues, see former Trulia chief economist Jed Kolko's article "Let’s Improve, Not Ignore, Seasonal Adjustment of Housing Data"
Note: I was one of several people to question the change in the seasonal factor (here is a post in 2009) - and this led to S&P Case-Shiller questioning the seasonal factor too (from April 2010). I still use the seasonal factor (I think it is better than using the NSA data).
 Click on graph for larger image.
This graph shows the month-to-month change in the NSA Case-Shiller National index since 1987 (through May 2020). The seasonal pattern was smaller back in the '90s and early '00s, and increased once the bubble burst.
The seasonal swings have declined since the bubble.
 The second graph shows the seasonal factors for the Case-Shiller National index since 1987. The factors started to change near the peak of the bubble, and really increased during the bust.
The swings in the seasonal factors have started to decrease, and I expect that over the next several years - as recent history is included in the factors - the seasonal factors will move back towards more normal levels.
However, as Kolko noted, there will be a lag with the seasonal factor since it is based on several years of recent data.
Free Webinar Today: UCI Professor Chris Schwarz Economic and Market Update at 2:30 PM ET
by Calculated Risk on 7/28/2020 11:42:00 AM
UCI Professor Chris Schwarz and I have presented together before. Always interesting!
He will be offering his thoughts on the economy, Tuesday, July 28th at 11:30 AM PT (2:30 PM ET).
Professor Schwarz writes: "Given the new lockdowns, uncertainty over the stimulus package, Q2 earnings, and financial market conditions, I will host another Economic and Market Update on July 28th at 11:30AM PST. As usual, the event is free."
You can register here.
HVS: Q2 2020 Homeownership and Vacancy Rates
by Calculated Risk on 7/28/2020 10:28:00 AM
The Census Bureau released the Residential Vacancies and Homeownership report for Q2 2020.
It is likely the results of this survey were significantly distorted by the pandemic. See note from Census below.
This report is frequently mentioned by analysts and the media to track household formation, the homeownership rate, and the homeowner and rental vacancy rates. However, there are serious questions about the accuracy of this survey.
This survey might show the trend, but I wouldn't rely on the absolute numbers. he Census Bureau is investigating the differences between the HVS, ACS and decennial Census, and analysts probably shouldn't use the HVS to estimate the excess vacant supply or household formation, or rely on the homeownership rate, except as a guide to the trend.
"National vacancy rates in the second quarter 2020 were 5.7 percent for rental housing and 0.9 percent for homeowner housing. The rental vacancy rate of 5.7 percent was 1.1 percentage points lower than the rate in the second quarter 2019 (6.8 percent) and 0.9 percentage point lower than the rate in the first quarter 2020 (6.6 percent). The homeowner vacancy rate of 0.9 percent was 0.4 percentage points lower than the rate in the second quarter 2019 (1.3 percent) and 0.2 percentage points lower than the rate in the first quarter 2020 (1.1 percent).
The homeownership rate of 67.9 percent was 3.8 percentage points higher than the rate in the second quarter 2019 (64.1 percent) and 2.6 percentage points higher than the rate in the first quarter 2020 (65.3 percent). "
 Click on graph for larger image.
The Red dots are the decennial Census homeownership rates for April 1st 1990, 2000 and 2010. The HVS homeownership rate increased to 67.9% in Q2, from 65.3% in Q1.
I'd put more weight on the decennial Census numbers. It is likely the results in Q2 were distorted by the pandemic.
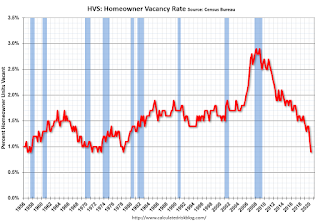 The HVS homeowner vacancy declined to 0.9%.
 Once again - this probably shows the general trend, but I wouldn't rely on the absolute numbers.
From Census:
As a result of the coronavirus pandemic (COVID-19), data collection operations for the CPS/HVS were affected during the second quarter of 2020. In-person interviews were suspended for the duration of the second quarter and replaced with telephone interview attempts when contact information was available. If the Field Representative was unable to get information on the sample unit, the unit was made a Type A non interview (no one home, refusal, etc).
 The rental vacancy rate decreased to 5.7% in Q1.
The quarterly HVS is the most timely survey on households, but there are many questions about the accuracy of this survey.
Richmond Fed: "Manufacturing in the Fifth District showed signs of recovery in July"
by Calculated Risk on 7/28/2020 10:03:00 AM
From the Richmond Fed: Manufacturing in the Fifth District showed signs of recovery in July
Manufacturing in the Fifth District showed signs of recovery in July, according to the most recent survey from the Richmond Fed. The composite index rose from 0 in June to 10 in July, its first positive reading since March, buoyed by increases in all three components. The indexes for shipments and new orders suggested expansion, while the third component index—employment— remained slightly negative. The local business conditions index rose further, suggesting some improvement in sentiment. Survey respondents were optimistic that conditions would improve in the next six months.This was the last of the regional Fed surveys for July.
emphasis added
Here is a graph comparing the regional Fed surveys and the ISM manufacturing index:
 Click on graph for larger image.
The New York and Philly Fed surveys are averaged together (yellow, through July), and five Fed surveys are averaged (blue, through July) including New York, Philly, Richmond, Dallas and Kansas City. The Institute for Supply Management (ISM) PMI (red) is through June (right axis).
The ISM manufacturing index for July will be released on Monday, August 3rd. The early consensus is for the ISM to increase to 53.4, up from 52.6 in June. Based on these regional surveys, the ISM manufacturing index will likely increase in July.
Note that these are diffusion indexes, so returning to 0 (or 50 for ISM) means activity is not declining further (it does not mean that activity is back to pre-crisis levels).
Case-Shiller: National House Price Index increased 4.5% year-over-year in May
by Calculated Risk on 7/28/2020 09:11:00 AM
S&P/Case-Shiller released the monthly Home Price Indices for May ("May" is a 3 month average of March, April and May prices).
This release includes prices for 20 individual cities, two composite indices (for 10 cities and 20 cities) and the monthly National index.
From S&P: S&P CoreLogic Case-Shiller Index Reports 4.5% Annual Home Price Gain in May
The S&P CoreLogic Case-Shiller U.S. National Home Price NSA Index, covering all nine U.S. census divisions, reported a 4.5% annual gain in May, down from 4.6% in the previous month. The 10-City Composite annual increase came in at 3.1%, down from 3.3% in the previous month. The 20-City Composite posted a 3.7% year-over-year gain, down from 3.9% in the previous month.
Phoenix, Seattle and Tampa reported the highest year-over-year gains among the 19 cities (excluding Detroit) in May. Phoenix led the way with a 9.0% year-over-year price increase, followed by Seattle with a 6.8% increase and Tampa with a 6.0% increase. Three of the 19 cities reported higher price increases in the year ending May 2020 versus the year ending April 2020.
...
The National Index posted a 0.7% month-over-month increase, while the 10-City and 20-City Composites posted increases of 0.3% and 0.4% respectively before seasonal adjustment in May. After seasonal adjustment, the National Index posted a month-over-month increase of 0.1%, while the 10- City and 20-City Composites did not post any gains. In May, 17 of 19 cities (excluding Detroit) reported increases before seasonal adjustment, while 11 of the 19 cities reported increases after seasonal adjustment.
“May’s housing price data were stable,” says Craig J. Lazzara, Managing Director and Global Head of Index Investment Strategy at S&P Dow Jones Indices. “The National Composite Index rose by 4.5% in May 2020, with comparable growth in the 10- and 20-City Composites (up 3.1% and 3.7%, respectively). In contrast with the past eight months, May’s gains were less than April’s. Although prices increased in May, in other words, they did so at a decelerating rate. We observed an analogous development at the city level: prices increased in all 19 cities for which we have data, but accelerated in only 3 of them (in contrast with 12 cities last month and 18 the month before that).
“More data will obviously be required in order to know whether May’s report represents a reversal of the previous path of accelerating prices or merely a slight deviation from an otherwise intact trend. Even if prices continue to decelerate, that is quite different from an environment in which prices actually decline.
emphasis added
 Click on graph for larger image.
 The first graph shows the nominal seasonally adjusted Composite 10, Composite 20 and National indices (the Composite 20 was started in January 2000).
The Composite 10 index is up 4.1% from the bubble peak, and unchanged in May (SA) from April.
The Composite 20 index is 8.3% above the bubble peak, and unchanged (SA) in May.
The National index is 18.1% above the bubble peak (SA), and up 0.1% (SA) in May. The National index is up 60% from the post-bubble low set in December 2011 (SA).
 The second graph shows the Year over year change in all three indices.
The Composite 10 SA is up 3.1% compared to May 2019. The Composite 20 SA is up 3.7% year-over-year.
The National index SA is up 4.5% year-over-year.
Note: According to the data, prices increased in 13 of 20 cities month-over-month seasonally adjusted.
I'll have more later.
Monday, July 27, 2020
Tuesday: Case-Shiller House Prices, Richmond Fed Mfg
by Calculated Risk on 7/27/2020 09:18:00 PM
From Matthew Graham at Mortgage News Daily: Mortgage Rates Edge Slightly Higher Again
Mortgage rates have been falling so much and with such regularity in 2020 that there's scarcely been a reason (or even an opportunity) to talk about anything else. Now suddenly, we have 2 straight business days with the average lender's rates getting modestly worse. Is this the beginning of the end?Tuesday:
Maybe... Probably not, but that's not the point. The point I will continue to make about this record-breaking run into the lowest rate range ever is that it will come to an end at some point. [Top Tier Scenarios 30YR FIXED: 2.92%]
emphasis added
• At 9:00 AM ET, S&P/Case-Shiller House Price Index for May. The consensus is for a 4.0% year-over-year increase in the Comp 20 index for May.
• At 10:00 AM, Richmond Fed Survey of Manufacturing Activity for July. This is the last of the regional surveys for July.
• At 10:00 AM, The Q2 2019 Housing Vacancies and Homeownership report from the Census Bureau.


