 RSS Feed
 by Calculated Risk on 5/15/2020 10:08:00 AM
Friday, May 15, 2020
BLS: Job Openings decreased to 6.2 Million in March
From the BLS: Job Openings and Labor Turnover Summary
The number of total separations increased by 8.9 million to a series high of 14.5 million in March, the U.S. Bureau of Labor Statistics reported today. Within separations, the quits rate fell to 1.8 percent and the layoffs and discharges rate increased to 7.5 percent. Job openings decreased to 6.2 million on the last business day of March. Over the month, hires declined to 5.2 million. The changes in these measures reflect the effects of the coronavirus (COVID-19) pandemic and efforts to contain it. ...The following graph shows job openings (yellow line), hires (dark blue), Layoff, Discharges and other (red column), and Quits (light blue column) from the JOLTS.
In March, the number and rate of quits decreased to 2.8 million (-654,000) and 1.8 percent, respectively. Total private quits fell to 2.6 million (-640,000), while government edged down to 177,000 (-14,000).
emphasis added
This series started in December 2000.
Note: The difference between JOLTS hires and separations is similar to the CES (payroll survey) net jobs headline numbers. This report is for March, the most recent employment report was for April.
 Click on graph for larger image.
Note that hires (dark blue) and total separations (red and light blue columns stacked) are pretty close each month. This is a measure of labor market turnover. When the blue line is above the two stacked columns, the economy is adding net jobs - when it is below the columns, the economy is losing jobs.
Jobs openings decreased in March to 6.191 million from 7.004 million in February.
The number of job openings (yellow) were down 16% year-over-year.
Quits were down 21% year-over-year. These are voluntary separations. (see light blue columns at bottom of graph for trend for "quits").
Job openings declined sharply, and will decline further in the April report.
Industrial Production Decreased 11.2 Percent in April, Capacity utilization at Record Low
by Calculated Risk on 5/15/2020 09:23:00 AM
From the Fed: Industrial Production and Capacity Utilization
Total industrial production fell 11.2 percent in April for its largest monthly drop in the 101-year history of the index, as the COVID-19 (coronavirus disease 2019) pandemic led many factories to slow or suspend operations throughout the month. Manufacturing output dropped 13.7 percent, its largest decline on record, as all major industries posted decreases. The output of motor vehicles and parts fell more than 70 percent; production elsewhere in manufacturing dropped 10.3 percent. The indexes for utilities and mining decreased 0.9 percent and 6.1 percent, respectively. At 92.6 percent of its 2012 average, the level of total industrial production was 15.0 percent lower in April than it was a year earlier. Capacity utilization for the industrial sector decreased 8.3 percentage points to 64.9 percent in April, a rate that is 14.9 percentage points below its long-run (1972–2019) average and 1.8 percentage points below its all-time (since 1967) low set in 2009.
emphasis added
 Click on graph for larger image.
This graph shows Capacity Utilization. This series is down 1.8 percentage points from the previous record low set in June 2009 (the series starts in 1967).
Capacity utilization at 64.9% is 14.9% below the average from 1972 to 2017.
Note: y-axis doesn't start at zero to better show the change.
 The second graph shows industrial production since 1967.
Industrial production decreased in April to 92.6. This is 6.3% above the Great Recession low.
The change in industrial production was at consensus expectations.
Retail Sales decreased 16.4% in April
by Calculated Risk on 5/15/2020 08:43:00 AM
On a monthly basis, retail sales decreased 16.4 percent from March to April (seasonally adjusted), and sales were down 21.6 percent from April 2019.
From the Census Bureau report:
Advance estimates of U.S. retail and food services sales for April 2020, adjusted for seasonal variation and holiday and trading-day differences, but not for price changes, were $403.9 billion, a decrease of 16.4 percent from the previous month, and 21.6 percent below April 2019. Total sales for the February 2020 through April 2020 period were down 7.7 percent from the same period a year ago. The February 2020 to March 2020 percent change was revised from down 8.4 percent to down 8.3 percent.
emphasis added
 Click on graph for larger image.
This graph shows retail sales since 1992. This is monthly retail sales and food service, seasonally adjusted (total and ex-gasoline).
Retail sales ex-gasoline were down 15.5% in March.
The second graph shows the year-over-year change in retail sales and food service (ex-gasoline) since 1993.
 Retail and Food service sales, ex-gasoline, decreased by 19.7% on a YoY basis.
The decrease in April was well below expectations, and sales in February and March were revised down, combined.
Thursday, May 14, 2020
Friday: Retail Sales, Industrial Production, Job Openings
by Calculated Risk on 5/14/2020 08:44:00 PM
Friday:
• At 8:30 AM ET, Retail sales for April is scheduled to be released. The consensus is for 11.6% decrease in retail sales.
• At 9:15 AM, The Fed will release Industrial Production and Capacity Utilization for April. The consensus is for a 11.5% decrease in Industrial Production, and for Capacity Utilization to decline to 64.0%.
• At 10:00 AM, University of Michigan's Consumer sentiment index (Preliminary for May).
• At 10:00 AM, Job Openings and Labor Turnover Survey for March from the BLS.
May 14 Update: US COVID-19 Test Results: Virginia Separates Out Antibody Tests
by Calculated Risk on 5/14/2020 05:20:00 PM
Virginia was including antibody testing with PCR (diagnostic) testing. For test and trace, PCR testing is the key. From Virginia Department of Health: Virginia Department of Health Releases Disaggregated Testing Data; No Differences in Trends
The Virginia Department of Health today released testing data broken out by PCR (diagnostic) and antibody (serology) tests. Antibody tests make up less than nine percent of overall tests. When these tests are removed from total results, there is minimal change in the percent positive of tests and no difference in overall trends.It is possible that other states are also including antibody tests in their daily test reports. If so, it would be helpful if they separated the tests. (Thanks to all the states for the hard work)
The US might be able to test 400,000 to 600,000 people per day sometime in May according to Dr. Fauci - and that might be enough for test and trace.
However, the US might need more than 900,000 tests per day according to Dr. Jha of Harvard's Global Health Institute.
There were 366,944 test results reported over the last 24 hours.
 Click on graph for larger image.
This data is from the COVID Tracking Project.
The percent positive over the last 24 hours was 6.9% (red line). The US probably needs enough tests to keep the percentage positive well below 5%. (probably much lower based on testing in New Zealand).
The Changing Mix of Light Vehicle Sales
by Calculated Risk on 5/14/2020 12:11:00 PM
The low gasoline prices made me take another look at the mix of vehicles being sold.
This graph shows the percent of light vehicle sales between passenger cars and trucks / SUVs through April 2020.
 Click on graph for larger image.
Over time the mix has changed toward more and more towards light trucks and SUVs.
Only when oil prices are high, does the trend slow or reverse.
Recently oil prices have fallen sharply, and the percent of light trucks and SUVs was up to 77% in April 2020.
UCI Professor Chris Schwarz on the Economy at 1 PM ET
by Calculated Risk on 5/14/2020 11:48:00 AM
UCI Professor Chris Schwarz and I have presented together before.
He will be offering his thoughts on the economy at 10 AM PT (1 PM ET).
You can register here.
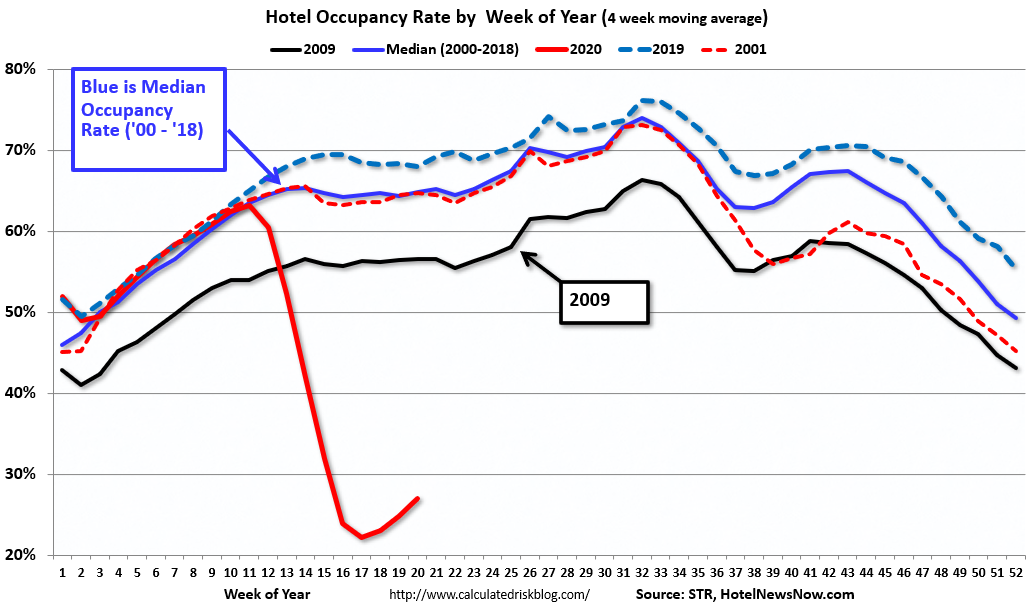
Hotels: Occupancy Rate Declined 55.9% Year-over-year, Slight Increase Week-over-week
by Calculated Risk on 5/14/2020 10:02:00 AM
From HotelNewsNow.com: STR: US hotel results for week ending 9 May
STR data for 3-9 May 2020 showed continues modest gains in U.S. hotel occupancy compared with previous weeks, but a similar level of year-over-year decline in the three key performance metrics.The following graph shows the seasonal pattern for the hotel occupancy rate using the four week average.
In comparison with the week of 5-11 May 2019, the industry recorded the following:
• Occupancy: -55.9% to 30.1%
• Average daily rate (ADR): -42.1% to US$76.35
• Revenue per available room (RevPAR): -74.4% to US$22.95
“The industry reported its fourth consecutive week-to-week increase in demand as the slow and steady ascent in national occupancy continued,” said Jan Freitag, STR’s senior VP of lodging insights. “More people are flying, as shown in daily checkpoint counts from the TSA, and more people are staying in hotels for a variety of purposes—the weekly number of rooms sold topped 10 million for the first time since the end of March. The markets benefiting more from leisure sources in areas with more relaxed distancing measures will see a sharper recovery line than others. Overall, the recovery will be uneven across the country.”
emphasis added
 Click on graph for larger image.
The red line is for 2020, dash light blue is 2019, blue is the median, and black is for 2009 (the worst year probably since the Great Depression for hotels).
Note: I added 2001 to show the impact on hotel occupancy after 9/11.
2020 was off to a solid start, however, COVID-19 has crushed hotel occupancy.
Note: Y-axis doesn't start at zero to better show the seasonal change.
Weekly Initial Unemployment Claims decrease to 2,981,000
by Calculated Risk on 5/14/2020 08:35:00 AM
UPDATE: From Bloomberg: U.S. Jobless Claims in Millions Again, Connecticut Corrects Data
Later in the day, however, Connecticut corrected its figure to show 29,846 claims, rather than the 298,680 shown in the federal report, indicating an error inflated the national figures.The DOL reported:
In the week ending May 9, the advance figure for seasonally adjusted initial claims was 2,981,000, a decrease of 195,000 from the previous week's revised level. The previous week's level was revised up by 7,000 from 3,169,000 to 3,176,000. The 4-week moving average was 3,616,500, a decrease of 564,000 from the previous week's revised average. The previous week's average was revised up by 7,000 from 4,173,500 to 4,180,500.The previous week was revised up.
emphasis added
The following graph shows the 4-week moving average of weekly claims since 1971.
 Click on graph for larger image.
The dashed line on the graph is the current 4-week average. The four-week average of weekly unemployment claims decreased to 4,173,500.
This was higher than the consensus forecast of 2.5 million.
The second graph shows seasonally adjust continued claims since 1967 (lags initial by one week while increasing sharply).
 At the worst of the Great Recession, continued claims peaked at 6.635 million, but then steadily declined.
Continued claims have already increased to a new record high of 22.833 million (SA) and will increase further over the next couple of weeks - and likely stay at a high level until the crisis abates.
Wednesday, May 13, 2020
Thursday: Unemployment Claims
by Calculated Risk on 5/13/2020 08:42:00 PM
Note: the covid19 tracking project suspects that at least one state is including antibody tests in their daily report. If so, the positive rate of virus tests might be higher than reported.
There are still a large number of layoffs every week.
Thursday:
• At 8:30 AM ET, The initial weekly unemployment claims report will be released. The consensus is for a 2.500 million initial claims, down from 3.169 million the previous week.


