 RSS Feed
 by Calculated Risk on 5/14/2020 10:02:00 AM
Thursday, May 14, 2020
Hotels: Occupancy Rate Declined 55.9% Year-over-year, Slight Increase Week-over-week
From HotelNewsNow.com: STR: US hotel results for week ending 9 May
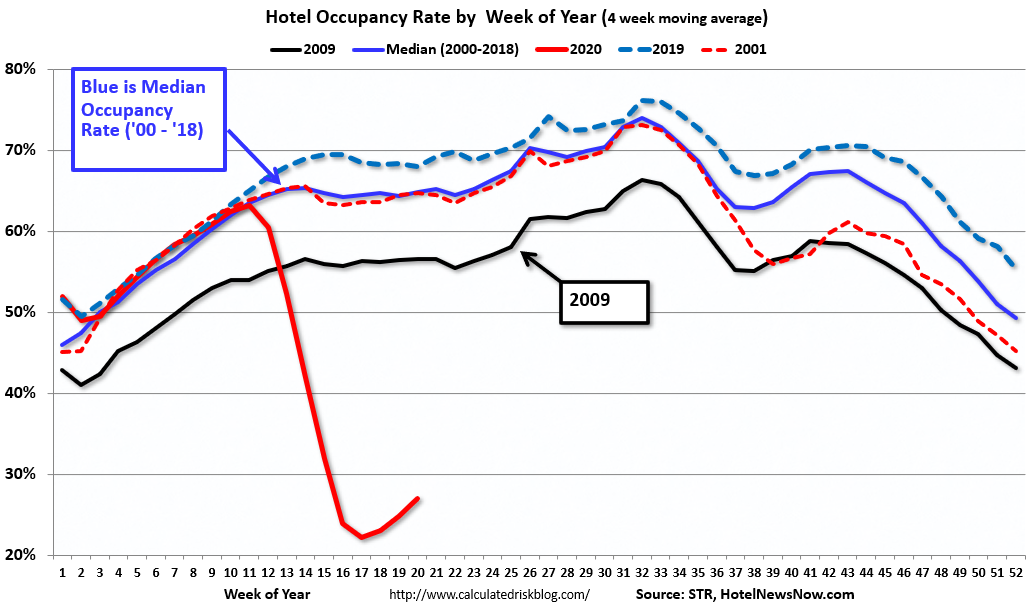
STR data for 3-9 May 2020 showed continues modest gains in U.S. hotel occupancy compared with previous weeks, but a similar level of year-over-year decline in the three key performance metrics.The following graph shows the seasonal pattern for the hotel occupancy rate using the four week average.
In comparison with the week of 5-11 May 2019, the industry recorded the following:
• Occupancy: -55.9% to 30.1%
• Average daily rate (ADR): -42.1% to US$76.35
• Revenue per available room (RevPAR): -74.4% to US$22.95
“The industry reported its fourth consecutive week-to-week increase in demand as the slow and steady ascent in national occupancy continued,” said Jan Freitag, STR’s senior VP of lodging insights. “More people are flying, as shown in daily checkpoint counts from the TSA, and more people are staying in hotels for a variety of purposes—the weekly number of rooms sold topped 10 million for the first time since the end of March. The markets benefiting more from leisure sources in areas with more relaxed distancing measures will see a sharper recovery line than others. Overall, the recovery will be uneven across the country.”
emphasis added
 Click on graph for larger image.
The red line is for 2020, dash light blue is 2019, blue is the median, and black is for 2009 (the worst year probably since the Great Depression for hotels).
Note: I added 2001 to show the impact on hotel occupancy after 9/11.
2020 was off to a solid start, however, COVID-19 has crushed hotel occupancy.
Note: Y-axis doesn't start at zero to better show the seasonal change.


