 RSS Feed
 by Calculated Risk on 1/12/2020 08:24:00 PM
Sunday, January 12, 2020
Sunday Night Futures
Weekend:
• Schedule for Week of January 12, 2020
• The Record Job Streak: A few Comments
Monday:
• No major economic releases scheduled.
From CNBC: Pre-Market Data and Bloomberg futures: S&P 500 are up 5 and DOW futures are up 50 (fair value).
Oil prices were down over the last week with WTI futures at $59.02 per barrel and Brent at $64.98 barrel. A year ago, WTI was at $48, and Brent was at $57 - so oil prices are up about 20% year-over-year.
Here is a graph from Gasbuddy.com for nationwide gasoline prices. Nationally prices are at $2.57 per gallon. A year ago prices were at $2.24 per gallon, so gasoline prices are up 33 cents per gallon year-over-year.
The Record Job Streak: A few Comments
by Calculated Risk on 1/12/2020 02:03:00 PM
A few comments on the current headline jobs streak. Also, the job streak if we adjust by temporary decennial Census hiring, and the possible impact of the annual revision (to be released with the January employment report).
The employment report has shown positive job growth for a record 111 months.
| Headline Jobs, Top 10 Streaks | |
|---|---|
| Year Ending | Streak, Months |
| 20191 | 111 |
| 1990 | 48 |
| 2007 | 46 |
| 1979 | 45 |
| 1943 | 33 |
| 1986 | 33 |
| 2000 | 33 |
| 1967 | 29 |
| 1995 | 25 |
| 1974 | 24 |
| 1Streak still going! | |
However, if we adjust for Decennial Census hiring and firing (data here) the streak of consecutive positive jobs reports is actually 118 months long. It makes sense to adjust for the Census hiring and firing since that was preplanned and unrelated to the business cycle.
If the job streak continues into 2020, then the headline streak will probably end in June 2020 when a large number of temporary Census workers are let go. But if we adjust for temporary Census hiring, then the streak might continue. Of course the streak could end at any time.
The Census will hire approximately 500,000 temporary workers over the next 5 months (mostly in May). This is why I wrote last year: How to Report the Monthly Employment Number excluding Temporary Census Hiring
 Click on graph for larger image.
This graph shows the monthly change in payroll jobs, ex-Census (meaning the impact of the decennial Census temporary hires and layoffs is removed - mostly in 2010 - to show the underlying payroll changes).
Note that there were 3 thousand temporary Census hires in December, so this graph shows 142 thousand jobs added (not the headline number of 145 thousand).
The previous longest job streak was 48 months ending in 1990. However, if we adjust for the 1990 Decennial Census, that streak was actually 45 months - making the streak ending in 2007 at 46 months the second longest.
| Ex-Census Jobs, Top 10 Streaks | |
|---|---|
| Year Ending | Streak, Months |
| 20191 | 118 |
| 2007 | 46 |
| 1979 | 45 |
| 1990 | 45 |
| 1943 | 33 |
| 1986 | 33 |
| 2000 | 32 |
| 1967 | 29 |
| 1995 | 25 |
| 1974 | 24 |
| 1Streak still going! | |
Note: If you have questions about this adjustment, see this post (including my discussion with the BLS).
Another interesting question is will the annual benchmark revision, to be released with the January employment report, show that the job streak ended last year? This is possible. The preliminary estimate of the Benchmark revision "indicates a downward adjustment to March 2019 total nonfarm employment of -501,000". Usually the preliminary estimate is pretty close to the final estimate. These jobs are subtracted from the March 2019 total, and then wedged-back to March 2018 (reducing employment gains by about 42 thousand per month during the 12 month period).
Since the lowest month for job gains, during the 12 month adjustment period, was February 2019 with 56 thousand jobs added - it seems the job streak will still be intact. But maybe not. The annual adjustment includes "the effect of applying the rate of change measured by the sample to the new benchmark employment level, as well as updated net birth/death model forecasts and new seasonal adjustment factors". The combined effect of these adjustments could be a negative month during the adjustment period - something to watch for next month!
Saturday, January 11, 2020
Schedule for Week of January 12, 2020
by Calculated Risk on 1/11/2020 08:11:00 AM
The key reports this week are December housing starts, CPI and retail sales.
For manufacturing, the December Industrial Production report and the January NY and Philly Fed manufacturing surveys will be released.
No major economic releases scheduled.
6:00 AM: NFIB Small Business Optimism Index for December.
8:30 AM: The Consumer Price Index for December from the BLS. The consensus is for 0.2% increase in CPI, and a 0.2% increase in core CPI.
7:00 AM ET: The Mortgage Bankers Association (MBA) will release the results for the mortgage purchase applications index.
8:30 AM ET: The Producer Price Index for December from the BLS. The consensus is for a 0.2% increase in PPI, and a 0.2% increase in core PPI.
8:30 AM: The New York Fed Empire State manufacturing survey for January. The consensus is for a reading of 4.0, up from 3.5.
2:00 PM: the Federal Reserve Beige Book, an informal review by the Federal Reserve Banks of current economic conditions in their Districts.
8:30 AM: The initial weekly unemployment claims report will be released. The consensus is for 216,000 initial claims, up from 214,000 last week.
 8:30 AM: Retail sales for December is scheduled to be released. The consensus is for a 0.3% increase in retail sales.
This graph shows the year-over-year change in retail sales and food service (ex-gasoline) since 1993. In November, Retail and Food service sales, ex-gasoline, increased by 3.8% on a YoY basis.
8:30 AM: the Philly Fed manufacturing survey for January. The consensus is for a reading of 3.4, up from 2.4.
10:00 AM: The January NAHB homebuilder survey. The consensus is for a reading of 74, down from 76. Any number above 50 indicates that more builders view sales conditions as good than poor.
10:00 AM: Speech by Fed Governor Michelle Bowman, The Outlook for Housing, At the Home Builders Association of Greater Kansas City: 2020 Economic Forecast Breakfast, Kansas City, Mo.
 8:30 AM: Housing Starts for December.
 This graph shows single and total housing starts since 1968.
The consensus is for 1.378 million SAAR, up from 1.365 million SAAR.
 9:15 AM: The Fed will release Industrial Production and Capacity Utilization for December.
This graph shows industrial production since 1967.
The consensus is for a 0.1% decrease in Industrial Production, and for Capacity Utilization to be decrease to 77.1%.
10:00 AM: University of Michigan's Consumer sentiment index (Preliminary for January). The consensus is for a reading of 99.3.
 10:00 AM ET: Job Openings and Labor Turnover Survey for November from the BLS.
 This graph shows job openings (yellow line), hires (purple), Layoff, Discharges and other (red column), and Quits (light blue column) from the JOLTS.
Jobs openings increased in October to 7.267 million from 7.032 million in September.
The number of job openings (yellow) were down 4% year-over-year, and Quits were up 1% year-over-year.
Friday, January 10, 2020
AAR: December Rail Carloads down 9.2% YoY, Intermodal Down 9.6% YoY
by Calculated Risk on 1/10/2020 02:19:00 PM
From the Association of American Railroads (AAR) Rail Time Indicators. Graphs and excerpts reprinted with permission.
2019 was a challenging year for U.S. rail traffic. Total carloads fell 4.9% (668,075 carloads) and intermodal fell 5.1% (740,240 containers and trailers) from 2018. Total carloads of 12.97 million in 2019 were the fewest for any year since sometime prior to 1988, which is when our data begin. Intermodal volume of 13.73 million units in 2019 was the second most ever, behind 2018.
...
In December 2019, intermodal was down 9.6% from December 2018 — the 11th straight year-over-year monthly decline and the biggest percentage decline for any month since October 2009. … In December 2019, total carloads were down 9.2% from December 2018, their 11th consecutive monthly decline and the biggest percentage decline for any month since May 2016.
emphasis added
 Click on graph for larger image.
This graph from the Rail Time Indicators report shows annual U.S. Carloads and Intermodal units since 2000:
U.S. railroads originated 13.73 million intermodal units in 2019, down 5.1% (740,240 containers and trailers) from 2018. … U.S. intermodal volume in 2019 was still the second highest in history, behind 2018 (14.47 million) and fractionally ahead of 2017 (13.72 million). … Total originated U.S. carloads (excluding the U.S. operations of Canadian railroads) totaled 12.97 million in 2019, down 4.9%, or 668,075 carloads, from 2018 and the fewest annual carloads since sometime prior to 1988, when our data begin.
 The second graph is the year-over-year change for carloads and intermodal traffic (using intermodal or shipping containers):
Excluding coal, U.S. carloads in 2019 were down 2.8% from 2018, their first decline in three years. In December 2019, they were down 4.2%, their 11th straight monthly decline after 12 straight increases.
Q4 GDP Forecasts: 1.1% to 2.3%
by Calculated Risk on 1/10/2020 12:28:00 PM
From Merrill Lynch
We lowered 1Q GDP growth by 0.7pp to 1.0% to reflect a likely steeper drop in inventories. As a partial offset, we boosted 2Q GDP to 2.0%. 4Q19 is tracking 2.2%. [Jan 10 estimate]From the NY Fed Nowcasting Report
emphasis added
The New York Fed Staff Nowcast stands at 1.1% for 2019:Q4 and 1.2% for 2020:Q1. [Jan 10 estimate]And from the Altanta Fed: GDPNow
The GDPNow model estimate for real GDP growth (seasonally adjusted annual rate) in the fourth quarter of 2019 is 2.3 percent on January 10, unchanged from January 7 after rounding. [Jan 10 estimate]CR Note: These estimates suggest real GDP growth will be between 1.1% and 2.3% annualized in Q4.
Comments on December Employment Report
by Calculated Risk on 1/10/2020 09:27:00 AM
The headline jobs number at 145 thousand for December was below consensus expectations of 160 thousand, and the previous two months were revised down 14 thousand, combined. The unemployment rate was unchanged at 3.5%.
Earlier: December Employment Report: 145,000 Jobs Added, 3.5% Unemployment Rate
In December, the year-over-year employment change was 2.108 million jobs including Census hires.
Seasonal Retail Hiring
Typically retail companies start hiring for the holiday season in October, and really increase hiring in November. Here is a graph that shows the historical net retail jobs added for October, November and December by year.
 Click on graph for larger image.
This graph really shows the collapse in retail hiring in 2008. Since then seasonal hiring has increased back close to more normal levels. Note: I expect the long term trend will be down with more and more internet holiday shopping.
Retailers hired 76 thousand workers (NSA) net in December. Note: this is NSA (Not Seasonally Adjusted).
In October, November and December combined, retailers hired more seasonal workers than in the previous two years.
Average Hourly Earnings
Wage growth was below expectations. From the BLS:
"In December, average hourly earnings for all employees on private nonfarm payrolls rose by 3 cents to $28.32. Over the last 12 months, average hourly earnings have increased by 2.9 percent."
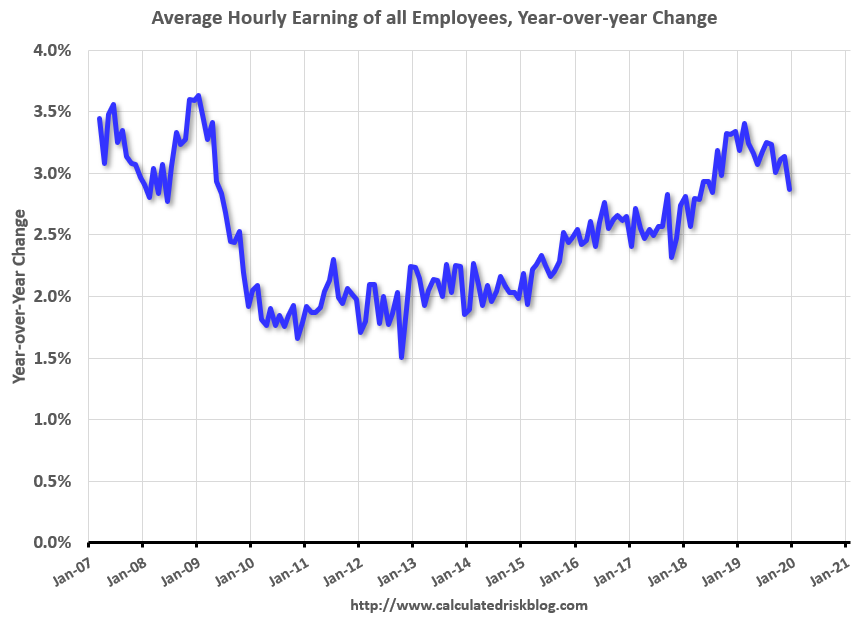 This graph is based on “Average Hourly Earnings” from the Current Employment Statistics (CES) (aka "Establishment") monthly employment report. Note: There are also two quarterly sources for earnings data: 1) “Hourly Compensation,” from the BLS’s Productivity and Costs; and 2) the Employment Cost Index which includes wage/salary and benefit compensation.
The graph shows the nominal year-over-year change in "Average Hourly Earnings" for all private employees. Nominal wage growth was at 2.9% YoY in December.
Wage growth had been generally trending up, but weakened in 2019.
Prime (25 to 54 Years Old) Participation
 Since the overall participation rate has declined due to cyclical (recession) and demographic (aging population, younger people staying in school) reasons, here is the employment-population ratio for the key working age group: 25 to 54 years old.
In the earlier period the participation rate for this group was trending up as women joined the labor force. Since the early '90s, the participation rate moved more sideways, with a downward drift starting around '00 - and with ups and downs related to the business cycle.
The 25 to 54 participation rate was increased in December to 82.9%, and the 25 to 54 employment population ratio increased to 80.4%.
Part Time for Economic Reasons
 From the BLS report:
"The number of persons employed part time for economic reasons, at 4.1 million, changed little in December but was down by 507,000 over the year. These individuals, who would have preferred full-time employment, were working part time because their hours had been reduced or they were unable to find full-time jobs."The number of persons working part time for economic reasons decreased in December to 4.148 million from 4.288 million in November. The number of persons working part time for economic reason has been generally trending down.
These workers are included in the alternate measure of labor underutilization (U-6) that decreased to 6.7% in December.
Unemployed over 26 Weeks
 This graph shows the number of workers unemployed for 27 weeks or more.
 According to the BLS, there are 1.186 million workers who have been unemployed for more than 26 weeks and still want a job. This was down from 1.219 million in November.
Summary:
The headline jobs number was below expectations, and the previous two months were revised down. The headline unemployment rate was unchanged at 3.5%; wage growth was well below expectations. Overall this was a disappointing report.
In 2019, the economy added 2.108 million jobs, down from 2.679 million jobs during 2018 (although 2018 will be revised down with benchmark revision to be released in February 2020). So job growth has slowed.
December Employment Report: 145,000 Jobs Added, 3.5% Unemployment Rate
by Calculated Risk on 1/10/2020 08:44:00 AM
From the BLS:
Total nonfarm payroll employment rose by 145,000 in December, and the unemployment rate was unchanged at 3.5 percent, the U.S. Bureau of Labor Statistics reported today. Notable job gains occurred in retail trade and health care, while mining lost jobs.
...
The change in total nonfarm payroll employment for October was revised down by 4,000 from +156,000 to +152,000, and the change for November was revised down by 10,000 from +266,000 to +256,000. With these revisions, employment gains in October and November combined were 14,000 lower than previously reported.
...
In December, average hourly earnings for all employees on private nonfarm payrolls rose by 3 cents to $28.32. Over the last 12 months, average hourly earnings have increased by 2.9 percent.
emphasis added
 Click on graph for larger image.
The first graph shows the monthly change in payroll jobs, ex-Census (meaning the impact of the decennial Census temporary hires and layoffs is removed - mostly in 2010 - to show the underlying payroll changes).
Total payrolls increased by 145 thousand in December (private payrolls increased 139 thousand).
Payrolls for October and November were revised down 14 thousand combined.
 This graph shows the year-over-year change in total non-farm employment since 1968.
In November, the year-over-year change was 2.108 million jobs.
The third graph shows the employment population ratio and the participation rate.
 The Labor Force Participation Rate was unchanged in December at 63.2%. This is the percentage of the working age population in the labor force. A large portion of the recent decline in the participation rate is due to demographics and long term trends.
The Employment-Population ratio was unchanged at 61.0% (black line).
I'll post the 25 to 54 age group employment-population ratio graph later.
 The fourth graph shows the unemployment rate.
 The unemployment rate was unchanged in December at 3.5%.
This was below consensus expectations of 160,000 jobs added, and October and November were revised down by 14,000 combined.
I'll have much more later ...
Thursday, January 09, 2020
Friday: Employment Report
by Calculated Risk on 1/09/2020 08:14:00 PM
My December Employment Preview.
Goldman's December Payrolls preview.
Friday:
• At 8:30 AM ET, Employment Report for December. The consensus is for 160,000 jobs added, and for the unemployment rate to be unchanged at 3.5%.
Goldman: December Payrolls Preview
by Calculated Risk on 1/09/2020 04:56:00 PM
A few brief excerpts from a note by Goldman Sachs economist Spencer Hill:
We estimate nonfarm payrolls increased 185k in December … We estimate an unchanged unemployment rate at 3.5% … we estimate average hourly earnings increased 0.2% month-over-month, lowering the year-over-year rate to 3.0%
emphasis added
Update: The Inland Empire Bust and Recovery
by Calculated Risk on 1/09/2020 02:35:00 PM
Way back in 2006 I disagreed with some analysts on the outlook for the Inland Empire in California. I wrote:
As the housing bubble unwinds, housing related employment will fall; and fall dramatically in areas like the Inland Empire. The more an area is dependent on housing, the larger the negative impact on the local economy will be.And sure enough, the economies of housing dependent areas like the Inland Empire were devastated during the housing bust. The good news is the Inland Empire is expanding solidly now.
So I think some pundits have it backwards: Instead of a strong local economy keeping housing afloat, I think the bursting housing bubble will significantly impact housing dependent local economies.
 Click on graph for larger image.
This graph shows the unemployment rate for the Inland Empire (using MSA: Riverside, San Bernardino, Ontario), and also the number of construction jobs as a percent of total employment.
The unemployment rate is falling, and is down to 3.6% (down from 14.4% in 2010). And construction employment is up from the lows (as a percent of total employment), but still well below the bubble years.
So the unemployment rate has fallen to a record low, and the economy isn't as heavily depending on construction. Overall the Inland Empire economy is in much better shape today.
 The second graph shows the number of construction jobs as a percent of total employment for the Inland Empire, all of California, and the entire U.S..
Clearly the Inland Empire is more dependent on construction than most areas. Construction has picked up as a percent of total employment, but the economy in California and the U.S. is not as dependent on construction as during the bubble years.


