 RSS Feed
 by Calculated Risk on 10/30/2019 10:07:00 AM
Wednesday, October 30, 2019
Q3 GDP: Investment
Investment was weak again in Q3, although residential investment picked up (increased at a 5.1% annual rate).
The first graph below shows the contribution to GDP from residential investment, equipment and software, and nonresidential structures (3 quarter trailing average). This is important to follow because residential investment tends to lead the economy, equipment and software is generally coincident, and nonresidential structure investment trails the economy.
In the graph, red is residential, green is equipment and software, and blue is investment in non-residential structures. So the usual pattern - both into and out of recessions is - red, green, blue.
The dashed gray line is the contribution from the change in private inventories.
 Click on graph for larger image.
Residential investment (RI) increased in Q3 (5.1% annual rate in Q3). Equipment investment decreased at a 3.8% annual rate, and investment in non-residential structures decreased at a 15.3% annual rate.
On a 3 quarter trailing average basis, RI (red) is up slightly, equipment (green) is slightly negative, and nonresidential structures (blue) is also down.
I'll post more on the components of non-residential investment once the supplemental data is released.
 The second graph shows residential investment as a percent of GDP.
Residential Investment as a percent of GDP increased in Q3, however RI has generally been increasing. RI as a percent of GDP is close to the bottom of the previous recessions - and I expect RI to continue to increase further in this cycle.
I'll break down Residential Investment into components after the GDP details are released.
Note: Residential investment (RI) includes new single family structures, multifamily structures, home improvement, broker's commissions, and a few minor categories.
 The third graph shows non-residential investment in structures, equipment and "intellectual property products". Investment in equipment and non-residential structures - as a percent of GDP - declined further.
BEA: Real GDP increased at 1.9% Annualized Rate in Q3
by Calculated Risk on 10/30/2019 08:34:00 AM
From the BEA: Gross Domestic Product, Third Quarter 2019 (Advance Estimate)
Real gross domestic product (GDP) increased at an annual rate of 1.9 percent in the third quarter of 2019, according to the "advance" estimate released by the Bureau of Economic Analysis. In the second quarter, real GDP increased 2.0 percent. ...The advance Q3 GDP report, with 1.9% annualized growth, was slightly above expectations.
The increase in real GDP in the third quarter reflected positive contributions from personal consumption expenditures (PCE), federal government spending, residential fixed investment, state and local government spending, and exports that were partly offset by negative contributions from nonresidential fixed investment and private inventory investment. Imports, which are a subtraction in the calculation of GDP, increased.
The deceleration in real GDP in the third quarter reflected decelerations in PCE, federal government spending, and state and local government spending, and a larger decrease in nonresidential fixed investment. These movements were partly offset by a smaller decrease in private inventory investment, and upturns in exports and in residential fixed investment.
emphasis added
Personal consumption expenditures (PCE) increased at 2.9% annualized rate in Q3, down from 4.6% in Q2. Residential investment (RI) increased at a 5.1% rate in Q3. Equipment investment decreased at a 3.8% annualized rate, and investment in non-residential structures decreased at a 15.3% pace.
I'll have more later ...
ADP: Private Employment increased 125,000 in October
by Calculated Risk on 10/30/2019 08:19:00 AM
Private sector employment increased by 125,000 jobs from September to October according to the October ADP National Employment Report®. ... The report, which is derived from ADP’s actual payroll data, measures the change in tota ... The report, which is derived from ADP’s actual payroll data, measures the change in total nonfarm private employment each month on a seasonally-adjusted basis.This was below the consensus forecast for 139,000 private sector jobs added in the ADP report.
...
“While job growth continues to soften, there are certain segments of the labor market that remain strong,” said Ahu Yildirmaz, vice president and co-head of the ADP Research Institute. “The goods producing sector showed weakness; however, the healthcare industry and midsized companies had solid gains.”
Mark Zandi, chief economist of Moody’s Analytics, said, “Job growth has throttled way back over the past year. The job slowdown is most pronounced at manufacturers and small companies. If hiring weakens any further, unemployment will begin to rise.”
The BLS report will be released Friday, and the consensus is for 93,000 non-farm payroll jobs added in October.
MBA: Mortgage Applications Increased in Latest Weekly Survey
by Calculated Risk on 10/30/2019 07:00:00 AM
From the MBA: Mortgage Applications Increase in Latest MBA Weekly Survey
Mortgage applications increased 0.6 percent from one week earlier, according to data from the Mortgage Bankers Association’s (MBA) Weekly Mortgage Applications Survey for the week ending October 25, 2019.
... The Refinance Index decreased 1 percent from the previous week and was 134 percent higher than the same week one year ago. The seasonally adjusted Purchase Index increased 2 percent from one week earlier. The unadjusted Purchase Index increased 2 percent compared with the previous week and was 10 percent higher than the same week one year ago.
...
“The 10-year Treasury rate rose slightly last week, as markets expected more progress toward a trade deal between the U.S. and China. Mortgage rates increased for the second straight week as a result, with the 30-year fixed rate climbing to 4.05 percent – the highest level since the end of July,” said Joel Kan, Associate Vice President of Economic and Industry Forecasting. “Mortgage applications were mostly unchanged, with purchase activity rising 2 percent and refinances decreasing less than 1 percent. Purchase applications continued to run at a stronger pace than last year, finishing a robust 10 percent higher than a year ago. Considering how much lower rates are compared to the end of 2018, purchase applications should continue showing solid year-over-year gains.”
...
The average contract interest rate for 30-year fixed-rate mortgages with conforming loan balances ($484,350 or less) increased to 4.05 percent from 4.02 percent, with points decreasing to 0.37 from 0.38 (including the origination fee) for 80 percent loan-to-value ratio (LTV) loans.
emphasis added
 Click on graph for larger image.
The first graph shows the refinance index since 1990.
With lower rates, we saw a sharp increase in refinance activity - but declined a little recently with higher rates. Mortgage rates would have to decline further to see a huge refinance boom.
 The second graph shows the MBA mortgage purchase index
According to the MBA, purchase activity is up 10% year-over-year.
Tuesday, October 29, 2019
Wednesday: GDP, FOMC Announcement, ADP Employment
by Calculated Risk on 10/29/2019 08:51:00 PM
Wednesday:
• At 7:00 AM ET, The Mortgage Bankers Association (MBA) will release the results for the mortgage purchase applications index.
• At 8:15 AM, The ADP Employment Report for October. This report is for private payrolls only (no government). The consensus is for 139,000 jobs added, up from 135,000 in September.
• At 8:30 AM, Gross Domestic Product, 3rd quarter 2019 (advance estimate). The consensus is that real GDP increased 1.7% annualized in Q3, down from 2.0% in Q2.
• At 2:00 PM, FOMC Meeting Announcement. The Fed is expected to lower the Fed Funds rate 25bps at this meeting..
• At 2:30 PM, Fed Chair Jerome Powell holds a press briefing following the FOMC announcement.
Update: A few comments on the Seasonal Pattern for House Prices
by Calculated Risk on 10/29/2019 04:24:00 PM
CR Note: This is a repeat of earlier posts with updated graphs.
A few key points:
1) There is a clear seasonal pattern for house prices.
2) The surge in distressed sales during the housing bust distorted the seasonal pattern.
3) Even though distressed sales are down significantly, the seasonal factor is based on several years of data - and the factor is now overstating the seasonal change (second graph below).
4) Still the seasonal index is probably a better indicator of actual price movements than the Not Seasonally Adjusted (NSA) index.
For in depth description of these issues, see former Trulia chief economist Jed Kolko's article "Let’s Improve, Not Ignore, Seasonal Adjustment of Housing Data"
Note: I was one of several people to question the change in the seasonal factor (here is a post in 2009) - and this led to S&P Case-Shiller questioning the seasonal factor too (from April 2010). I still use the seasonal factor (I think it is better than using the NSA data).
 Click on graph for larger image.
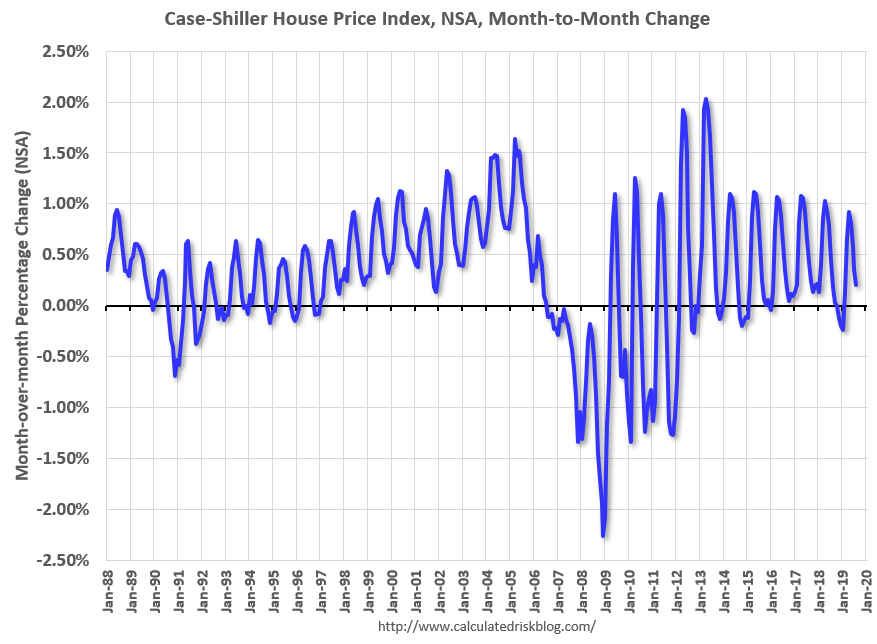
This graph shows the month-to-month change in the NSA Case-Shiller National index since 1987 (through August 2019). The seasonal pattern was smaller back in the '90s and early '00s, and increased once the bubble burst.
The seasonal swings have declined since the bubble.
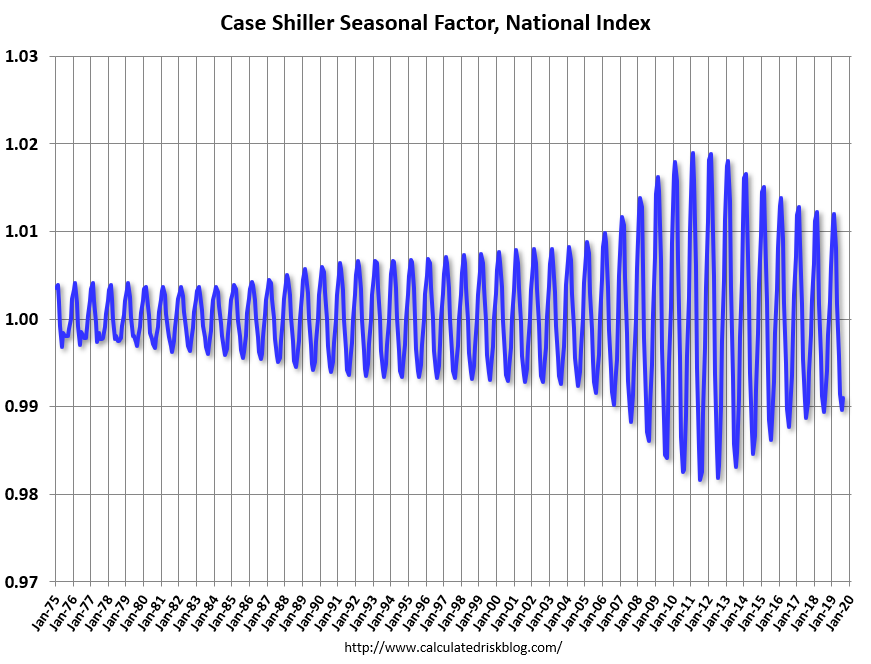 The second graph shows the seasonal factors for the Case-Shiller National index since 1987. The factors started to change near the peak of the bubble, and really increased during the bust.
The swings in the seasonal factors has started to decrease, and I expect that over the next several years - as recent history is included in the factors - the seasonal factors will move back towards more normal levels.
However, as Kolko noted, there will be a lag with the seasonal factor since it is based on several years of recent data.
HVS: Q3 2019 Homeownership and Vacancy Rates
by Calculated Risk on 10/29/2019 11:42:00 AM
The Census Bureau released the Residential Vacancies and Homeownership report for Q3 2019.
This report is frequently mentioned by analysts and the media to track household formation, the homeownership rate, and the homeowner and rental vacancy rates. However, there are serious questions about the accuracy of this survey.
This survey might show the trend, but I wouldn't rely on the absolute numbers. he Census Bureau is investigating the differences between the HVS, ACS and decennial Census, and analysts probably shouldn't use the HVS to estimate the excess vacant supply or household formation, or rely on the homeownership rate, except as a guide to the trend.
"National vacancy rates in the third quarter 2019 were 6.8 percent for rental housing and 1.4 percent for homeowner housing. The rental vacancy rate of 6.8 percent was not statistically different from the rate in the third quarter 2018 (7.1 percent) and virtually unchanged from the rate in the second quarter 2019. The homeowner vacancy rate of 1.4 percent was 0.2 percentage points lower than the rate in the third quarter 2018 (1.6 percent) and was 0.1 percentage points higher than the rate in the second quarter 2019 (1.3 percent).
The homeownership rate of 64.8 percent was not statistically different from the rate in the third quarter 2018 (64.4 percent), but was 0.7 percentage points higher than the rate in the second quarter 2019 (64.1 percent)."
 Click on graph for larger image.
The Red dots are the decennial Census homeownership rates for April 1st 1990, 2000 and 2010. The HVS homeownership rate increased to 64.8% in Q2, from 64.2% in Q3.
I'd put more weight on the decennial Census numbers. However, given changing demographics, the homeownership rate has bottomed.
 The HVS homeowner vacancy increased to 1.4% in Q3.
 Once again - this probably shows the general trend, but I wouldn't rely on the absolute numbers.
 The rental vacancy rate was unchanged at 6.8% in Q3.
The quarterly HVS is the most timely survey on households, but there are many questions about the accuracy of this survey.
Overall this suggests that vacancies have declined significantly, and my guess is the homeownership rate has bottomed - and that the rental vacancy rate is close to the bottom for this cycle.
NAR: "Pending Home Sales Rise 1.5% in September"
by Calculated Risk on 10/29/2019 10:08:00 AM
From the NAR: Pending Home Sales Rise 1.5% in September
Pending home sales grew in September, marking two consecutive months of increases, according to the National Association of Realtors. The four major regions were split last month, as the Midwest and South recorded gains but the Northeast and West reported declines in month-over-month contract activity.This was above expectations for this index. Note: Contract signings usually lead sales by about 45 to 60 days, so this would usually be for closed sales in October and November.
The Pending Home Sales Index (PHSI), a forward-looking indicator based on contract signings, rose 1.5% to 108.7 in September. Year-over-year contract signings jumped 3.9%. An index of 100 is equal to the level of contract activity in 2001.
...
Regional indices in September were mixed, with the Northeast experiencing the smallest change of the four regions. The PHSI in the Northeast fell 0.4% to 93.9 in September, but is still 1.3% higher than a year ago. In the Midwest, the index increased 3.1% to 104.4 in September, 2.7% higher than September 2018.
Pending home sales in the South increased 2.6% to an index of 127.5 in September, a 5.7% jump from last September. The index in the West declined 1.3% in September 2019 to 95.1, which is an increase of 3.4% from a year ago.
emphasis added
Case-Shiller: National House Price Index increased 3.2% year-over-year in August
by Calculated Risk on 10/29/2019 09:12:00 AM
S&P/Case-Shiller released the monthly Home Price Indices for August ("August" is a 3 month average of June, July and August prices).
This release includes prices for 20 individual cities, two composite indices (for 10 cities and 20 cities) and the monthly National index.
Note: Case-Shiller reports Not Seasonally Adjusted (NSA), I use the SA data for the graphs.
From S&P: Las Vegas Drops Out Of Top Three Cities In Annual Gains According To S&P CoreLogic Case-Shiller Index
The S&P CoreLogic Case-Shiller U.S. National Home Price NSA Index, covering all nine U.S. census divisions, reported a 3.2% annual gain in August, up from 3.1% in the previous month. The 10-City Composite annual increase came in at 1.5%, down from 1.6% in the previous month. The 20-City Composite posted a 2.0% year-over-year gain, no change from the previous month.
Phoenix, Charlotte, and Tampa reported the highest year-over-year gains among the 20 cities. In August, Phoenix led the way with a 6.3% year-over-year price increase, followed by Charlotte with a 4.5% increase and Tampa with a 4.3% increase. Seven of the 20 cities reported greater price increases in the year ending August 2019 versus the year ending July 2019.
...
Before seasonal adjustment, the National Index posted a month-over-month increase of 0.2% in August. The 10-City and 20-City Composites did not post any gains for the month. After seasonal adjustment, the National Index recorded a 0.3% month-over-month increase in August. The 10-City Composite posted a 0.1% decrease and the 20-City Composite posted a 0.2% decrease. In August, 11 of 20 cities reported increases both before seasonal adjustment while 17 of 20 cities reported increases after seasonal adjustment.
The U.S. National Home Price NSA Index trend remained intact with a year-over-year price change of 3.2%” says Philip Murphy, Managing Director and Global Head of Index Governance at S&P Dow Jones Indices. “However, a shift in regional leadership may be underway beneath the headline national index.
“Phoenix saw an increase in its YOY price change to 6.3% and retained its leading position. However, Las Vegas dropped from number two to number eight among the cities of the 20-City Composite, falling from a 4.7% YOY change in July to only 3.3% in August. Meanwhile, the Southeast region included three of the top four cities. Charlotte, Tampa, and Atlanta all recorded solid YOY performance with price changes of 4.5%, 4.3%, and 4.0%, respectively. In the Northwest, Seattle’s YOY change turned positive (0.7%) after three consecutive months of negative YOY price changes. The 10-City Composite YOY price change declined slightly from July to 1.5%, while the 20-City Composite YOY price change remained steady at 2.0%. San Francisco was the only city to record a negative YOY price change (-0.1%).”
emphasis added
 Click on graph for larger image.
 The first graph shows the nominal seasonally adjusted Composite 10, Composite 20 and National indices (the Composite 20 was started in January 2000).
The Composite 10 index is up 0.8% from the bubble peak, and down 0.1% in August (SA) from June.
The Composite 20 index is 4.4% above the bubble peak, and down 0.2% (SA) in August.
The National index is 13.8% above the bubble peak (SA), and up 0.3% (SA) in August. The National index is up 53.9% from the post-bubble low set in December 2011 (SA).
 The second graph shows the Year over year change in all three indices.
The Composite 10 SA is up 1.6% compared to August 2018. The Composite 20 SA is up 2.1% year-over-year.
The National index SA is up 3.2% year-over-year.
Note: According to the data, prices increased in 18 of 20 cities month-over-month seasonally adjusted.
I'll have more later.
Monday, October 28, 2019
Tuesday: Case-Shiller House Prices, Pending Home Sales
by Calculated Risk on 10/28/2019 07:12:00 PM
From Matthew Graham at Mortgage News Daily: Mortgage Rates Near 3-Month Highs
Mortgage rates increased again today as lenders continued to get caught up with 2 days of bond market weakness. … With the early October lows representing a modest increase from the early September lows, there's a risk that a bigger-picture shift is taking place. Simply put, the long-term trend of falling rates that began roughly 1 year ago could be in the process of shifting toward a trend of rising rates. [Most Prevalent Rates 30YR FIXED 3.75-3.875%]Tuesday:
emphasis added
• At 9:00 AM ET, S&P/Case-Shiller House Price Index for August.
• At 10:00 AM, Pending Home Sales Index for September. The consensus is 0.2% decrease in the index.
• At 10:00 AM, The Q3 2019 Housing Vacancies and Homeownership report from the Census Bureau.


