 RSS Feed
 by Calculated Risk on 10/22/2019 08:18:00 PM
Tuesday, October 22, 2019
Wednesday: FHFA House Prices, Architecture Billings Index
Wednesday:
• At 7:00 AM ET: The Mortgage Bankers Association (MBA) will release the results for the mortgage purchase applications index.
• At 9:00 AM: FHFA House Price Index for August 2018. This was originally a GSE only repeat sales, however there is also an expanded index.
• At During the day: The AIA's Architecture Billings Index for September (a leading indicator for commercial real estate).
NMHC: Apartment Market Tightness Index indicates tighter conditions in October
by Calculated Risk on 10/22/2019 04:28:00 PM
The National Multifamily Housing Council (NMHC) released the data for the October report: NMHC Quarterly Survey of Apartment Conditions (October 2019)
The Market Tightness Index decreased from 60 to 54. Any reading above 50 indicates tighter conditions from the previous quarter.
This indicates tighter market conditions for the third straight quarter.

Click on graph for larger image.
This graph shows the quarterly Apartment Tightness Index. This indicates market conditions were tighter over the last quarter.
This is the third consecutive reading over 50, following thirteen consecutive quarterly surveys indicating looser conditions.
Richmond Fed: "Manufacturing Activity Strengthened in October"
by Calculated Risk on 10/22/2019 02:01:00 PM
Earlier from the Richmond Fed: Manufacturing Activity Strengthened in October
Fifth District manufacturing activity strengthened in October, according to the most recent survey from the Federal Reserve Bank of Richmond. The composite index rose from −9 in September to 8 in October, as all three components — shipments, new orders, and employment — increased. Manufacturing firms also reported an increase in backlog of orders and improved local business conditions. Respondents were optimistic that conditions would continue to improve in the next six months.This was a better report - but not strong.
Many survey respondents saw growth in employment and wages in October and expected continued growth in the near term. However, manufacturers still struggled to find workers with the necessary skills in October and expected this difficulty to persist in the coming months.
emphasis added
Comments on September Existing Home Sales
by Calculated Risk on 10/22/2019 11:00:00 AM
Earlier: NAR: Existing-Home Sales Decreased to 5.38 million in September
A few key points:
1) Existing home sales were up 3.9% year-over-year (YoY) in September. This was the third consecutive YoY increase - following 16 consecutive months with a YoY decrease in sales
2) Inventory is still low, and was down 2.7% year-over-year (YoY) in September.
3) As usual, housing economist Tom Lawler's forecast was closer to the NAR report than the consensus. See: Lawler: Early Read on Existing Home Sales in September. The consensus was for sales of 5.45 million SAAR. Lawler estimated the NAR would report 5.36 million SAAR in September, and the NAR actually reported 5.38 million SAAR.
 Click on graph for larger image.
4) Year-to-date sales are down about 1.7% compared to the same period in 2018. On an annual basis, that would put sales around 5.25 million in 2019. Sales slumped at the end of 2018 and in January 2019 due to higher mortgage rates, the stock market selloff, and fears of an economic slowdown.
The comparisons will be easier towards in Q4 of this year, and with lower mortgage rates, sales will probably finish the year unchanged or even up from 2018.
 The second graph shows existing home sales Not Seasonally Adjusted (NSA).
Sales NSA in September (452,000, red column) were well above sales in September 2018 (421,000, NSA). However there were more selling days in September 2019 than in 2018.
Overall this was a solid report.
NAR: Existing-Home Sales Decreased to 5.38 million in September
by Calculated Risk on 10/22/2019 10:12:00 AM
From the NAR: Existing-Home Sales Decrease 2.2% in September
Existing-home sales receded in September following two consecutive months of increases, according to the National Association of Realtors®. Each of the four major regions witnessed sales drop off last month, with the Midwest absorbing the brunt of those declines.
Total existing-home sales, completed transactions that include single-family homes, townhomes, condominiums and co-ops, fell 2.2% from August to a seasonally adjusted annual rate of 5.38 million in September. Despite the decline, overall sales are up 3.9% from a year ago (5.18 million in September 2018).
...
Total housing inventory at the end of September sat at 1.83 million, approximately equal to the amount of existing-homes available for sale in August, but a 2.7% decrease from 1.88 million one year ago. Unsold inventory is at a 4.1-month supply at the current sales pace, up from 4.0 months in August and down from the 4.4-month figure recorded in September 2018.
emphasis added
 Click on graph for larger image.
This graph shows existing home sales, on a Seasonally Adjusted Annual Rate (SAAR) basis since 1993.
Sales in September (5.38 million SAAR) were down 2.2% from last month, and were 3.9% above the September 2018 sales rate.
The second graph shows nationwide inventory for existing homes.
 According to the NAR, inventory was unchanged at 1.83 million in September from 1.83 million in August. Headline inventory is not seasonally adjusted, and inventory usually decreases to the seasonal lows in December and January, and peaks in mid-to-late summer.
The last graph shows the year-over-year (YoY) change in reported existing home inventory and months-of-supply. Since inventory is not seasonally adjusted, it really helps to look at the YoY change. Note: Months-of-supply is based on the seasonally adjusted sales and not seasonally adjusted inventory.
 Inventory was down 2.7% year-over-year in September compared to September 2018.
 Months of supply increased to 4.1 months in September.
This was below the consensus forecast. For existing home sales, a key number is inventory - and inventory is still low. I'll have more later …
Monday, October 21, 2019
Tuesday: Existing Home Sales, Richmond Fed Mfg
by Calculated Risk on 10/21/2019 09:02:00 PM
From Matthew Graham at Mortgage News Daily: Highest Mortgage Rates in More Than a Month
Mortgage rates may have managed to remain mostly flat last week, but they did so near their highest levels in several weeks. After moving up at a moderate pace today, they're now at the highest levels in just over a month. After being as low as 3.375-3.5% for a top tier conventional 30yr fixed quote in early September, the average lender is now roughly 0.5% higher in rate. [Most Prevalent Rates 30YR FIXED 3.75-3.875%]Tuesday:
emphasis added
• At 10:00 AM ET, Existing Home Sales for September from the National Association of Realtors (NAR). The consensus is for 5.45 million SAAR, down from 5.49 million in August. Housing economist Tom Lawler expects the NAR to report 5.36 million SAAR.
• Also at 10:00 AM, Richmond Fed Survey of Manufacturing Activity for October.
Phoenix Real Estate in September: Sales up 13.8% YoY, Active Inventory Down 16.3% YoY
by Calculated Risk on 10/21/2019 03:18:00 PM
This is a key housing market to follow since Phoenix saw a large bubble / bust followed by strong investor buying.
The Arizona Regional Multiple Listing Service (ARMLS) reports ("Stats Report"):
1) Overall sales were at 7,850 in September, down from 8,726 in August, but up from 6,897 in September 2018. Sales were down 10.0% from August 2019 (last month), and up 13.8% from September 2018.
2) Active inventory was at 13,936, down from 16,643 in September 2018. That is down 16.3% year-over-year.
3) Months of supply increased to 2.27 months in September from 2.00 months in August. This is low.
This is another market with increasing sales and falling inventory.
Real GDP Annual and Quarterly
by Calculated Risk on 10/21/2019 01:27:00 PM
The following graph shows real GDP quarterly (blue, annualized), and the year-over-year change in GDP (red).
The tax changes at the end of 2017 have had minimal impact on GDP. Most forecasts showed some minor boost in 2018 and 2019 followed by a minor drag starting in 2020. With the recent budget agreement, there probably will be little drag from fiscal policy next year.
Also, as shown earlier, there was no investment boom following the tax changes.
However, the tax changes did result in a large increase in the budget deficit (as predicted by all competent analysts).
 Click on graph for larger image.
This rate of growth is about what we should expect, see: Demographics and GDP: 2% is the new 4%
Note: Q3 2019 GDP estimated at 1.8% real rate annualized.
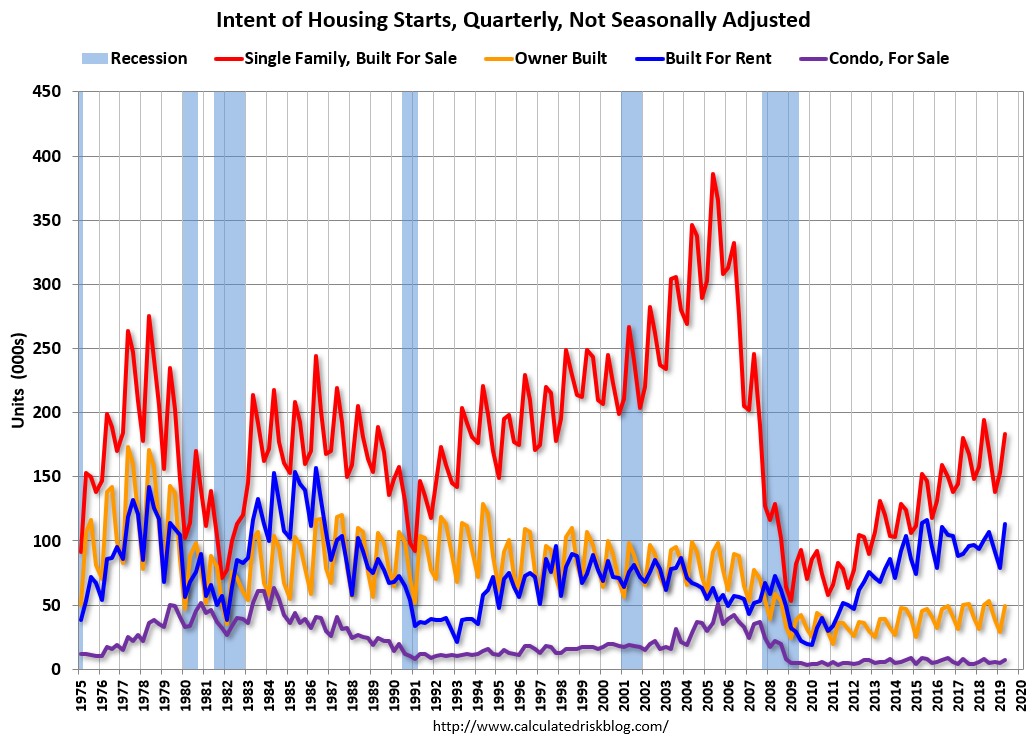
Quarterly Housing Starts by Intent
by Calculated Risk on 10/21/2019 10:06:00 AM
Here is a graph I haven't updated in some time. From the Census Bureau "Started and Completed by Purpose of Construction" through Q2 2019.
This graph shows the NSA quarterly intent for four start categories since 1975: single family built for sale, owner built (includes contractor built for owner), starts built for rent, and condos built for sale.
 Click on graph for larger image.
Single family starts built for sale were down about 6% in Q2 2019 compared to Q2 2018.
Owner built starts were down about 2% year-over-year.
And condos built for sale not far above the record low.
The 'units built for rent' (blue) had increased significantly following the great recession, but are now moving mostly sideways - and were up 12% in Q2 2019 compared to Q2 2018.
I expect single family, built for sales, will be up year-over-year in the 2nd half of 2019.
The Impact of the GM Strike on October Employment
by Calculated Risk on 10/21/2019 08:55:00 AM
Something to note on employment:
A tentative agreement has been reached at GM, however the GM workers were on strike during the BLS reference period (includes the 12th of the month). That means employment in October will be reduced by the number of workers on strike (approximately 48,000) plus some collateral layoffs in automotive suppliers.
The BLS counts striking workers as unemployed.
JP Morgan economist Daniel Silver estimates there will be 75,000 fewer jobs in October due to the strike. If the agreement is ratified, these jobs will return in the November report.


