 RSS Feed
 by Calculated Risk on 9/26/2019 08:34:00 AM
Thursday, September 26, 2019
Q2 GDP Third Estimate: 2.0% Annual Rate
From the BEA: Gross Domestic Product, Second Quarter 2019 (Second Estimate); Corporate Profits, Second Quarter 2019 (Preliminary Estimate)
Real gross domestic product (GDP) increased at an annual rate of 2.0 percent in the second quarter of 2019, according to the "third" estimate released by the Bureau of Economic Analysis. In the first quarter, real GDP increased 3.1 percent.PCE growth was revised down from 4.7% to 4.6%. Residential investment was revised down from -2.9% to -3.0%. This was at the consensus forecast.
The GDP estimate released today is based on more complete source data than were available for the "second" estimate issued last month. In the second estimate, the increase in real GDP was also 2.0 percent. Downward revisions to personal consumption expenditures (PCE) and nonresidential fixed investment were primarily offset by upward revisions to state and local government spending and exports. Imports, which are a subtraction in the calculation of GDP, were revised down
emphasis added
Here is a Comparison of Third and Second Estimates.
Wednesday, September 25, 2019
Thursday: GDP, Unemployment Claims, Pending Home Sales
by Calculated Risk on 9/25/2019 07:15:00 PM
Thursday:
• At 8:30 AM ET, The initial weekly unemployment claims report will be released. The consensus is for 211 thousand initial claims, up from 208 thousand the previous week.
• At 8:30 AM, Gross Domestic Product, 2nd quarter 2018 (Third estimate). The consensus is that real GDP increased 2.0% annualized in Q2, unchanged from the second estimate of 2.0%.
• At 10:00 AM, Pending Home Sales Index for August. The consensus is 0.6% increase in the index.
• At 11:00 AM, the Kansas City Fed manufacturing survey for September. This is the last of the regional surveys for September.
"Chemical Activity Barometer Rises in September"
by Calculated Risk on 9/25/2019 05:04:00 PM
Note: This appears to be a leading indicator for industrial production.
From the American Chemistry Council: Chemical Activity Barometer Rises in September
The Chemical Activity Barometer (CAB), a leading economic indicator created by the American Chemistry Council (ACC), was up 0.1 percent in September on a three-month moving average (3MMA) basis following a 0.1 percent decline in August and gains averaging 0.2 percent per month during the second quarter. On a year-over-year (Y/Y) basis, the barometer was flat at 0.0 percent (3MMA).
...
“Although one month does not make a trend, the positive September CAB reading and upward revisions in the data are encouraging signs,” said Kevin Swift, chief economist at ACC. “The barometer indicates gains in U.S. commerce into the second quarter of 2020, but at a slow pace.”
...
Applying the CAB back to 1912, it has been shown to provide a lead of two to fourteen months, with an average lead of eight months at cycle peaks as determined by the National Bureau of Economic Research. The median lead was also eight months. At business cycle troughs, the CAB leads by one to seven months, with an average lead of four months. The median lead was three months. The CAB is rebased to the average lead (in months) of an average 100 in the base year (the year 2012 was used) of a reference time series. The latter is the Federal Reserve’s Industrial Production Index.
emphasis added
 Click on graph for larger image.
This graph shows the year-over-year change in the 3-month moving average for the Chemical Activity Barometer compared to Industrial Production. It does appear that CAB (red) generally leads Industrial Production (blue).
The year-over-year change in the CAB suggests that the YoY change in industrial production might be near a short term bottom.
Zillow Case-Shiller Forecast: Slower YoY Price Gains in August compared to July
by Calculated Risk on 9/25/2019 03:29:00 PM
The Case-Shiller house price indexes for July were released yesterday. Zillow forecasts Case-Shiller a month early, and I like to check the Zillow forecasts since they have been pretty close.
From Matthew Speakman at Zillow: July Case-Shiller Results and August Forecast: Summer Turning Point?
Annual home price growth continued to cool in July, but more-recent data suggest the market may have begun to turn over the summer, showing modest acceleration in growth compared to earlier in the year.
…
The latest home sales and building data offer further proof that the recent bout of housing malaise may be nearing an end. August existing home sales, starts and permits all easily exceeded industry expectations and posted some of their strongest readings in years. This strength, teamed with steady home builder sentiment, growing home construction employment and still-low mortgage rates, show the housing market still has plenty of fight as summer turns to fall.
 The Zillow forecast is for the year-over-year change for the Case-Shiller National index to be at 3.2% in August, unchanged from 3.2% in July.
 The Zillow forecast is for the 20-City index to decline to 1.8% YoY in August from 2.0% in July, and for the 10-City index to decline to 1.3% YoY compared to 1.6% YoY in July.
A few Comments on August New Home Sales
by Calculated Risk on 9/25/2019 11:08:00 AM
New home sales for August were reported at 713,000 on a seasonally adjusted annual rate basis (SAAR). Sales for the previous three months were revised up, combined.
Sales for June were revised up to a new cycle high.
Annual sales in 2019 should be the best year for new home sales since 2007.
Earlier: New Home Sales increased to 713,000 Annual Rate in August.
 Click on graph for larger image.
This graph shows new home sales for 2018 and 2019 by month (Seasonally Adjusted Annual Rate).
Sales in August were up 18.0% year-over-year compared to August 2018.
Year-to-date (through August), sales are up 6.4% compared to the same period in 2018.
The comparisons for the next four months are easy, so sales should be solidly higher in 2019 than in 2018.
And here is another update to the "distressing gap" graph that I first started posting a number of years ago to show the emerging gap caused by distressed sales.
 The "distressing gap" graph shows existing home sales (left axis) and new home sales (right axis) through August 2019. This graph starts in 1994, but the relationship had been fairly steady back to the '60s.
Following the housing bubble and bust, the "distressing gap" appeared mostly because of distressed sales.
Even though distressed sales are down significantly, following the bust, new home builders focused on more expensive homes - so the gap has only closed slowly.
I still expect this gap to close. However, this assumes that the builders will offer some smaller, less expensive homes.
 Another way to look at this is a ratio of existing to new home sales.
This ratio was fairly stable from 1994 through 2006, and then the flood of distressed sales kept the number of existing home sales elevated and depressed new home sales. (Note: This ratio was fairly stable back to the early '70s, but I only have annual data for the earlier years).
In general the ratio has been trending down since the housing bust, and this ratio will probably continue to trend down a little more.
Note: Existing home sales are counted when transactions are closed, and new home sales are counted when contracts are signed. So the timing of sales is different.
New Home Sales increased to 713,000 Annual Rate in August
by Calculated Risk on 9/25/2019 10:14:00 AM
The Census Bureau reports New Home Sales in August were at a seasonally adjusted annual rate (SAAR) of 713 thousand.
The previous three months were revised up combined. June was again revised up to a new cycle high.
"Sales of new single‐family houses in August 2019 were at a seasonally adjusted annual rate of 713,000, according to estimates released jointly today by the U.S. Census Bureau and the Department of Housing and Urban Development. This is 7.1 percent above the revised July rate of 666,000 and is 18.0 percent above the August 2018 estimate of 604,000. "
emphasis added
 Click on graph for larger image.
The first graph shows New Home Sales vs. recessions since 1963. The dashed line is the current sales rate.
Even with the increase in sales over the last several years, new home sales are still somewhat low historically.
The second graph shows New Home Months of Supply.
 The months of supply decreased in August to 5.5 months from 5.9 months in July.
 The all time record was 12.1 months of supply in January 2009.
This is in the normal range (less than 6 months supply is normal).
"The seasonally‐adjusted estimate of new houses for sale at the end of August was 326,000. This represents a supply of 5.5 months at the current sales rate."
 On inventory, according to the Census Bureau:
 "A house is considered for sale when a permit to build has been issued in permit-issuing places or work has begun on the footings or foundation in nonpermit areas and a sales contract has not been signed nor a deposit accepted."Starting in 1973 the Census Bureau broke this down into three categories: Not Started, Under Construction, and Completed.
The third graph shows the three categories of inventory starting in 1973.
The inventory of completed homes for sale is still somewhat low, and the combined total of completed and under construction is close to normal.
 The last graph shows sales NSA (monthly sales, not seasonally adjusted annual rate).
In August 2019 (red column), 57 thousand new homes were sold (NSA). Last year, 47 thousand homes were sold in August.
The all time high for August was 110 thousand in 2005, and the all time low for August was 23 thousand in 2010.
This was above expectations of 665 thousand sales SAAR, and sales in the three previous months were revised up, combined. I'll have more later today.
MBA: Mortgage Applications Decreased in Latest Weekly Survey
by Calculated Risk on 9/25/2019 07:00:00 AM
From the MBA: Mortgage Applications Decrease in Latest MBA Weekly Survey
Mortgage applications decreased 10.1 percent from one week earlier, according to data from the Mortgage Bankers Association’s (MBA) Weekly Mortgage Applications Survey for the week ending September 20, 2019.
... The Refinance Index decreased 15 percent from the previous week and was 104 percent higher than the same week one year ago. The seasonally adjusted Purchase Index decreased 3 percent from one week earlier. The unadjusted Purchase Index decreased 4 percent compared with the previous week and was 9 percent higher than the same week one year ago.
...
“U.S. Treasury yields trended downward over the course of last week, as the Federal Reserve meeting highlighted the elevated uncertainty in the economic outlook. However, despite falling yields, mortgage rates ticked up again and have risen 20 basis points over the past two weeks,” said Joel Kan, MBA’s Associate Vice President of Economic and Industry Forecasting. “The increase in rates led to fewer refinances, and activity has now dropped 17 percent over the last two weeks.”
Added Kan, “Purchase applications also decreased, likely related to the two-week jump in rates, but still remained 9 percent higher than last year. The recent data on increased existing-home sales and new residential construction points to the underlying strength in the purchase market this fall.”
...
The average contract interest rate for 30-year fixed-rate mortgages with conforming loan balances ($484,350 or less) increased to 4.02 percent from 4.01 percent, with points increasing to 0.38 from 0.37 (including the origination fee) for 80 percent loan-to-value ratio (LTV) loans.
emphasis added
 Click on graph for larger image.
The first graph shows the refinance index since 1990.
With lower rates, we saw a sharp increase in refinance activity. Now activity has declined as rates have increased.
 The second graph shows the MBA mortgage purchase index
According to the MBA, purchase activity is up 9% year-over-year.
Tuesday, September 24, 2019
Wednesday: New Home Sales
by Calculated Risk on 9/24/2019 07:11:00 PM
Wednesday:
• At 7:00 AM ET, The Mortgage Bankers Association (MBA) will release the results for the mortgage purchase applications index.
• At 10:00 AM: New Home Sales for August from the Census Bureau. The consensus is for 665 thousand SAAR, up from 635 thousand in July.
FHFA House Price Index Up 5.0% Year-over-year
by Calculated Risk on 9/24/2019 05:14:00 PM
CR Note: Although I rarely report on the FHFA house prices index, they are an excellent resource. There are differences between Case-Shiller and the FHFA index. A key difference is that the FHFA index is for Fannie and Freddie mortgages only (there is an expanded index too). There was a time when the OFHEO index (now FHFA) was the only repeat sales index publicly available - and I reported on it every month years ago.
From the FHFA: FHFA House Price Index Up 0.4 Percent in July; Up 5.0 Percent From Last Year
U.S. house prices rose in July, up 0.4 percent from the previous month, according to the Federal Housing Finance Agency (FHFA) House Price Index (HPI). House prices rose 5.0 percent from July 2018 to July 2019. The previously reported 0.2 percent increase for June 2019 remains unchanged.The various FHFA indexes are here.
For the nine census divisions, seasonally adjusted monthly house price changes from June 2019 to July 2019 ranged from +0.1 percent in the Middle Atlantic division to +1.2 percent in the Mountain division. The 12-month changes were all positive, ranging from +3.6 percent in the Middle Atlantic division to +7.6 percent in the Mountain division.
Update: A few comments on the Seasonal Pattern for House Prices
by Calculated Risk on 9/24/2019 01:26:00 PM
CR Note: This is a repeat of earlier posts with updated graphs.
A few key points:
1) There is a clear seasonal pattern for house prices.
2) The surge in distressed sales during the housing bust distorted the seasonal pattern.
3) Even though distressed sales are down significantly, the seasonal factor is based on several years of data - and the factor is now overstating the seasonal change (second graph below).
4) Still the seasonal index is probably a better indicator of actual price movements than the Not Seasonally Adjusted (NSA) index.
For in depth description of these issues, see former Trulia chief economist Jed Kolko's article "Let’s Improve, Not Ignore, Seasonal Adjustment of Housing Data"
Note: I was one of several people to question the change in the seasonal factor (here is a post in 2009) - and this led to S&P Case-Shiller questioning the seasonal factor too (from April 2010). I still use the seasonal factor (I think it is better than using the NSA data).
 Click on graph for larger image.
This graph shows the month-to-month change in the NSA Case-Shiller National index since 1987 (through July 2019). The seasonal pattern was smaller back in the '90s and early '00s, and increased once the bubble burst.
The seasonal swings have declined since the bubble.
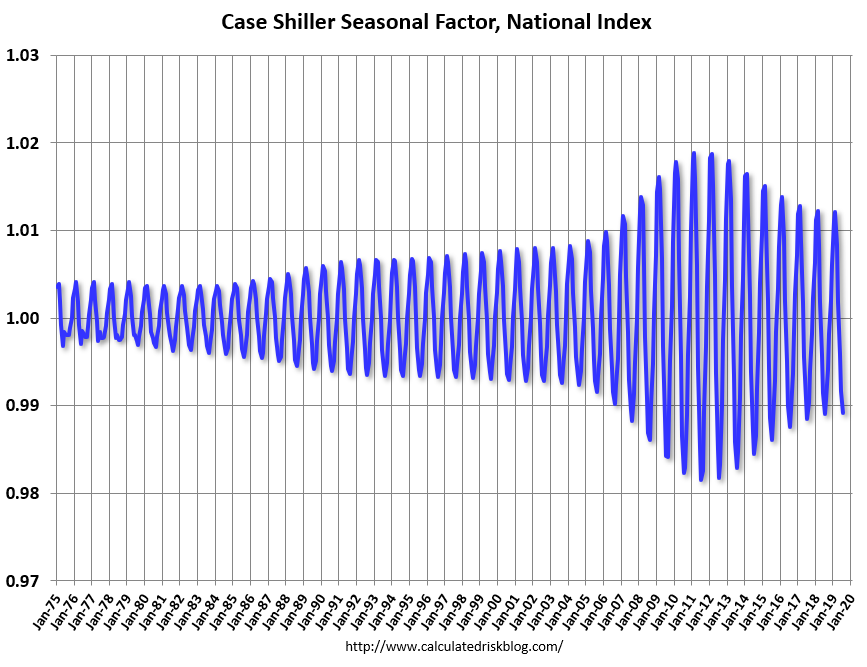 The second graph shows the seasonal factors for the Case-Shiller National index since 1987. The factors started to change near the peak of the bubble, and really increased during the bust.
The swings in the seasonal factors has started to decrease, and I expect that over the next several years - as recent history is included in the factors - the seasonal factors will move back towards more normal levels.
However, as Kolko noted, there will be a lag with the seasonal factor since it is based on several years of recent data.


