 RSS Feed
 by Calculated Risk on 9/25/2019 07:00:00 AM
Wednesday, September 25, 2019
MBA: Mortgage Applications Decreased in Latest Weekly Survey
From the MBA: Mortgage Applications Decrease in Latest MBA Weekly Survey
Mortgage applications decreased 10.1 percent from one week earlier, according to data from the Mortgage Bankers Association’s (MBA) Weekly Mortgage Applications Survey for the week ending September 20, 2019.
... The Refinance Index decreased 15 percent from the previous week and was 104 percent higher than the same week one year ago. The seasonally adjusted Purchase Index decreased 3 percent from one week earlier. The unadjusted Purchase Index decreased 4 percent compared with the previous week and was 9 percent higher than the same week one year ago.
...
“U.S. Treasury yields trended downward over the course of last week, as the Federal Reserve meeting highlighted the elevated uncertainty in the economic outlook. However, despite falling yields, mortgage rates ticked up again and have risen 20 basis points over the past two weeks,” said Joel Kan, MBA’s Associate Vice President of Economic and Industry Forecasting. “The increase in rates led to fewer refinances, and activity has now dropped 17 percent over the last two weeks.”
Added Kan, “Purchase applications also decreased, likely related to the two-week jump in rates, but still remained 9 percent higher than last year. The recent data on increased existing-home sales and new residential construction points to the underlying strength in the purchase market this fall.”
...
The average contract interest rate for 30-year fixed-rate mortgages with conforming loan balances ($484,350 or less) increased to 4.02 percent from 4.01 percent, with points increasing to 0.38 from 0.37 (including the origination fee) for 80 percent loan-to-value ratio (LTV) loans.
emphasis added
 Click on graph for larger image.
The first graph shows the refinance index since 1990.
With lower rates, we saw a sharp increase in refinance activity. Now activity has declined as rates have increased.
 The second graph shows the MBA mortgage purchase index
According to the MBA, purchase activity is up 9% year-over-year.
Tuesday, September 24, 2019
Wednesday: New Home Sales
by Calculated Risk on 9/24/2019 07:11:00 PM
Wednesday:
• At 7:00 AM ET, The Mortgage Bankers Association (MBA) will release the results for the mortgage purchase applications index.
• At 10:00 AM: New Home Sales for August from the Census Bureau. The consensus is for 665 thousand SAAR, up from 635 thousand in July.
FHFA House Price Index Up 5.0% Year-over-year
by Calculated Risk on 9/24/2019 05:14:00 PM
CR Note: Although I rarely report on the FHFA house prices index, they are an excellent resource. There are differences between Case-Shiller and the FHFA index. A key difference is that the FHFA index is for Fannie and Freddie mortgages only (there is an expanded index too). There was a time when the OFHEO index (now FHFA) was the only repeat sales index publicly available - and I reported on it every month years ago.
From the FHFA: FHFA House Price Index Up 0.4 Percent in July; Up 5.0 Percent From Last Year
U.S. house prices rose in July, up 0.4 percent from the previous month, according to the Federal Housing Finance Agency (FHFA) House Price Index (HPI). House prices rose 5.0 percent from July 2018 to July 2019. The previously reported 0.2 percent increase for June 2019 remains unchanged.The various FHFA indexes are here.
For the nine census divisions, seasonally adjusted monthly house price changes from June 2019 to July 2019 ranged from +0.1 percent in the Middle Atlantic division to +1.2 percent in the Mountain division. The 12-month changes were all positive, ranging from +3.6 percent in the Middle Atlantic division to +7.6 percent in the Mountain division.
Update: A few comments on the Seasonal Pattern for House Prices
by Calculated Risk on 9/24/2019 01:26:00 PM
CR Note: This is a repeat of earlier posts with updated graphs.
A few key points:
1) There is a clear seasonal pattern for house prices.
2) The surge in distressed sales during the housing bust distorted the seasonal pattern.
3) Even though distressed sales are down significantly, the seasonal factor is based on several years of data - and the factor is now overstating the seasonal change (second graph below).
4) Still the seasonal index is probably a better indicator of actual price movements than the Not Seasonally Adjusted (NSA) index.
For in depth description of these issues, see former Trulia chief economist Jed Kolko's article "Let’s Improve, Not Ignore, Seasonal Adjustment of Housing Data"
Note: I was one of several people to question the change in the seasonal factor (here is a post in 2009) - and this led to S&P Case-Shiller questioning the seasonal factor too (from April 2010). I still use the seasonal factor (I think it is better than using the NSA data).
 Click on graph for larger image.
This graph shows the month-to-month change in the NSA Case-Shiller National index since 1987 (through July 2019). The seasonal pattern was smaller back in the '90s and early '00s, and increased once the bubble burst.
The seasonal swings have declined since the bubble.
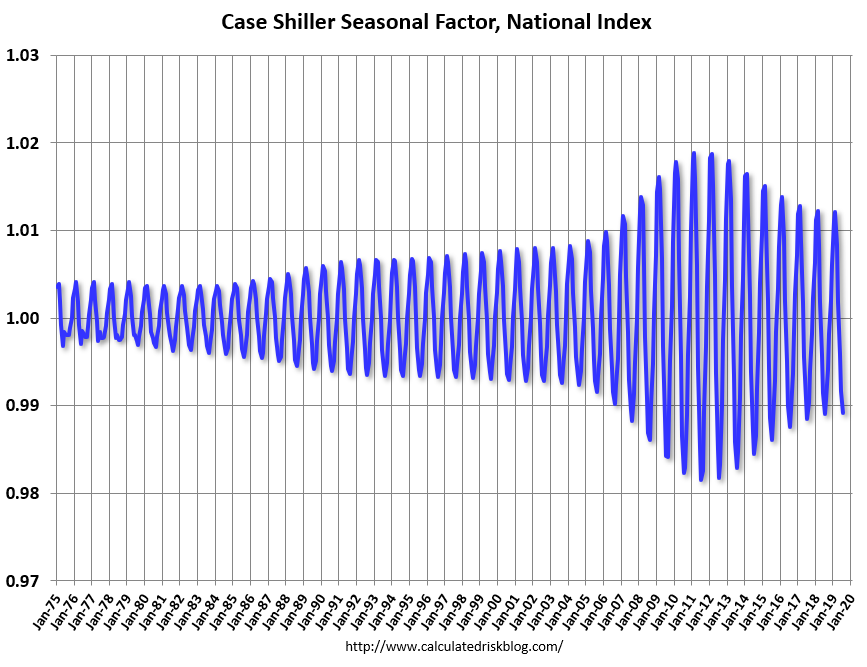 The second graph shows the seasonal factors for the Case-Shiller National index since 1987. The factors started to change near the peak of the bubble, and really increased during the bust.
The swings in the seasonal factors has started to decrease, and I expect that over the next several years - as recent history is included in the factors - the seasonal factors will move back towards more normal levels.
However, as Kolko noted, there will be a lag with the seasonal factor since it is based on several years of recent data.
Real House Prices and Price-to-Rent Ratio in July
by Calculated Risk on 9/24/2019 11:20:00 AM
Here is the post earlier on Case-Shiller: Case-Shiller: National House Price Index increased 3.2% year-over-year in July
It has been over eleven years since the bubble peak. In the Case-Shiller release today, the seasonally adjusted National Index (SA), was reported as being 13.5% above the previous bubble peak. However, in real terms, the National index (SA) is still about 7.6% below the bubble peak (and historically there has been an upward slope to real house prices). The composite 20, in real terms, is still 14.6% below the bubble peak.
The year-over-year increase in prices has slowed to 3.2% nationally, but I do not expect year-over-year prices to turn negative this year. We might even see a little pickup in price growth in the 2nd half of 2019.
Usually people graph nominal house prices, but it is also important to look at prices in real terms (inflation adjusted). Case-Shiller and others report nominal house prices. As an example, if a house price was $200,000 in January 2000, the price would be close to $288,000 today adjusted for inflation (44%). That is why the second graph below is important - this shows "real" prices (adjusted for inflation).
Nominal House Prices
 The first graph shows the monthly Case-Shiller National Index SA, and the monthly Case-Shiller Composite 20 SA (through July) in nominal terms as reported.
In nominal terms, the Case-Shiller National index (SA)and the Case-Shiller Composite 20 Index (SA) are both at new all times highs (above the bubble peak).
Real House Prices
 The second graph shows the same two indexes in real terms (adjusted for inflation using CPI less Shelter). Note: some people use other inflation measures to adjust for real prices.
In real terms, the National index is back to February 2005 levels, and the Composite 20 index is back to June 2004.
In real terms, house prices are at 2004/2005 levels.
Price-to-Rent
In October 2004, Fed economist John Krainer and researcher Chishen Wei wrote a Fed letter on price to rent ratios: House Prices and Fundamental Value. Kainer and Wei presented a price-to-rent ratio using the OFHEO house price index and the Owners' Equivalent Rent (OER) from the BLS.
 Here is a similar graph using the Case-Shiller National and Composite 20 House Price Indexes.
This graph shows the price to rent ratio (January 2000 = 1.0). The price-to-rent ratio has been moving sideways to down recently.
On a price-to-rent basis, the Case-Shiller National index is back to February 2004 levels, and the Composite 20 index is back to October 2003 levels.
In real terms, prices are back to late 2004 levels, and the price-to-rent ratio is back to late 2003, early 2004.
Richmond Fed: "Manufacturing Activity Softened in September"
by Calculated Risk on 9/24/2019 10:07:00 AM
From the Richmond Fed: Manufacturing Activity Softened in September
Fifth District manufacturing activity softened in September, according to the most recent survey from the Richmond Fed. The composite index dropped from 1 in August to −9 in September, as both shipments and new orders fell. However, the third component, employment, rose. Firms also reported a drop in backlog of orders and weakening local business conditions but were optimistic that conditions would improve in the coming months.This was another weak report.
Survey results indicated wage growth and a slight increase in employment in the manufacturing sector in September. However, firms struggled to find workers with the necessary skills, and the indicator for the average workweek hit a nine-year-low.
emphasis added
Case-Shiller: National House Price Index increased 3.2% year-over-year in July
by Calculated Risk on 9/24/2019 09:11:00 AM
S&P/Case-Shiller released the monthly Home Price Indices for July ("July" is a 3 month average of May, June and July prices).
This release includes prices for 20 individual cities, two composite indices (for 10 cities and 20 cities) and the monthly National index.
Note: Case-Shiller reports Not Seasonally Adjusted (NSA), I use the SA data for the graphs.
From S&P: Charlotte Joins Top Three Cities in Annual Gains According to the S&P CoreLogic Case-Shiller Index
The S&P CoreLogic Case-Shiller U.S. National Home Price NSA Index, covering all nine U.S. census divisions, reported a 3.2% annual gain in July, remaining the same from the previous month. The 10 City Composite annual increase came in at 1.6%, down from 1.9% in the previous month. The 20-City Composite posted a 2.0% year-over-year gain, down from 2.2% in the previous month.
Phoenix, Las Vegas and Charlotte reported the highest year-over-year gains among the 20 cities. In July, Phoenix led the way with a 5.8% year-over-year price increase, followed by Las Vegas with a 4.7% increase, and Charlotte with a 4.6% increase. Seven of the 20 cities reported greater price increases in the year ending July 2019 versus the year ending June 2019.
...
Before seasonal adjustment, the National Index posted a month-over-month increase of 0.4% in July. The 10-City Composite remained flat and the 20-City Composite reported a 0.1% increase for the month. After seasonal adjustment, the National Index recorded a 0.1% month-over-month increase in July. The 10-City Composite posted a 0.1% decrease and the 20-City Composite did not report any gains. In July, 15 of 20 cities reported increases both before and after seasonal adjustment.
“Year-over-year home prices continued to gain, but at ever more modest rates,” says Philip Murphy, Managing Director and Global Head of Index Governance at S&P Dow Jones Indices. “Charlotte surpassed Tampa to join the top three cities, and Seattle may be turning around from its recent negative streak of YOY price changes, improving from -1.3% in June to -0.06% in July.
“Overall, leadership remains in the southwest (Phoenix and Las Vegas) and southeast (Charlotte and Tampa). Other pockets of relative strength include Minneapolis, which increased its YOY gain to 4.2%, and Detroit, which is closely behind at 4.1% YOY. The 10-City and 20-City Composites both experienced lower YOY price gains than last month, declining to 1.6% and 2.0% respectively. However, the U.S. National Home Price NSA Index remained steady with a YOY price gain of 3.2%, the same as prior month. Home price gains remained positive in low single digits in most cities, and other fundamentals indicate renewed housing demand. According to the National Association of Realtors, the YOY change in existing home sales was positive in July for the first time in a number of months, and housing supply tightened since peaking in June.”
emphasis added
 Click on graph for larger image.
 The first graph shows the nominal seasonally adjusted Composite 10, Composite 20 and National indices (the Composite 20 was started in January 2000).
The Composite 10 index is up 0.9% from the bubble peak, and down 0.1% in July (SA) from June.
The Composite 20 index is 4.6% above the bubble peak, and up slightly (SA) in July.
The National index is 13.5% above the bubble peak (SA), and up 0.1% (SA) in July. The National index is up 53.4% from the post-bubble low set in December 2011 (SA).
 The second graph shows the Year over year change in all three indices.
The Composite 10 SA is up 1.6% compared to July 2018. The Composite 20 SA is up 2.0% year-over-year.
The National index SA is up 3.3% year-over-year.
Note: According to the data, prices increased in 17 of 20 cities month-over-month seasonally adjusted.
I'll have more later.
Monday, September 23, 2019
Tuesday: Case-Shiller House Prices, Richmond Fed Mfg Survey
by Calculated Risk on 9/23/2019 07:17:00 PM
From Matthew Graham at Mortgage News Daily: Great Day For Mortgage Rates, But There's a Catch
Mortgage rates added to last week's friendly rebound with their best single-day drop in more than a month today. Weak economic data in Europe and tepid domestic data helped drive demand in safe-haven bond markets. [Most Prevalent Rates 30YR FIXED - 3.75%]Tuesday:
emphasis added
• At 9:00 AM ET, S&P/Case-Shiller House Price Index for July. The consensus is for a 2.1% year-over-year increase in the Comp 20 index for July.
• At 9:00 AM, FHFA House Price Index for July 2018. This was originally a GSE only repeat sales, however there is also an expanded index.
• At 10:00 AM ET, Richmond Fed Survey of Manufacturing Activity for September.
NAHB: "55+ Housing Market Remains Solid in Second Quarter"
by Calculated Risk on 9/23/2019 04:40:00 PM
This was released last month. This index is similar to the overall NAHB housing market index (HMI), but only released quarterly. The NAHB started this index in Q4 2008 (during the housing bust), so the readings were initially very low.
From the NAHB: 55+ Housing Market Remains Solid in Second Quarter
Builder confidence in the single-family 55+ housing market remained solid in the second quarter with a reading of 71, edging down one point from the previous quarter due to softness in traffic of prospective buyers, according to the National Association of Home Builders' (NAHB) 55+ Housing Market Index (HMI) released today.
...
“Although the single-family HMI fell slightly, builder sentiment still remains strong for this segment of the market,” said Karen Schroeder, chair of NAHB's 55+ Housing Industry Council and vice president of Mayberry Homes in East Lansing, Mich. “In fact, the reading of 71 is just one point off from the all-time high of 72 from the previous quarter. We expect the 55+ housing market to continue on a positive path moving forward.”
For the three index components of the 55+ single-family HMI, present sales remained even at 76, expected sales for the next six months increased one point to 78 and traffic of prospective buyers fell five points to 56.
emphasis added
 Click on graph for larger image.
This graph shows the NAHB 55+ Single Family HMI through Q2 2019. Any reading above 50 indicates that more builders view conditions as good than as poor. The index decreased to 71 in Q2 down from a record high 72 in Q1.
There are two key drivers in addition to the improved economy: 1) there is a large cohort that recently moved into the 55+ group, and 2) the homeownership rate typically increases for people in the 55 to 70 year old age group. So demographics are favorable for the 55+ market.
Black Knight's First Look: National Mortgage Delinquency Rate Decreased in August, Foreclosure Inventory Lowest Since 2005
by Calculated Risk on 9/23/2019 10:16:00 AM
From Black Knight: Black Knight’s First Look: Foreclosure Starts Hit 18-year Low in August; Mortgage Prepayments Continue to Rise in Lower Interest Rate Environment
• August’s 36,200 foreclosure starts made for the lowest single-month total since December 2000According to Black Knight's First Look report for August, the percent of loans delinquent decreased slightly in August compared to July, and decreased 1.5% year-over-year.
• The number of loans in active foreclosure inventory also fell; at 253,000, it’s the fewest since 2005
• Prepayment activity – typically a good indicator of refinance activity – continues to press upward, increasing 5% from July to reach a three-year high
• August’s prepayment rate was up 62% from the same time last year and 2.5 times the 18-year low hit in January
• Given a 30-45 day closing window, the month’s prepayment activity reflects June/July interest rates; as rates fell further in August and September, the peak in refinance-driven prepayments is likely still to come
The percent of loans in the foreclosure process decreased 2.4% in August and were down 11.5% over the last year.
Black Knight reported the U.S. mortgage delinquency rate (loans 30 or more days past due, but not in foreclosure) was 3.45% in August down from 3.46% in July.
The percent of loans in the foreclosure process decreased in August to 0.48% from 0.49% in July.
| Black Knight: Percent Loans Delinquent and in Foreclosure Process | ||||
|---|---|---|---|---|
| Aug 2019 | Jul 2019 | Aug 2018 | Aug 2017 | |
| Delinquent | 3.45% | 3.46% | 3.52% | 3.93% |
| In Foreclosure | 0.48% | 0.49% | 0.54% | 0.76% |
| Number of properties: | ||||
| Number of properties that are delinquent, but not in foreclosure: | 1,813,000 | 1,807,000 | 1,818,000 | 2,003,000 |
| Number of properties in foreclosure pre-sale inventory: | 253,000 | 258,000 | 280,000 | 385,000 |
| Total Properties Delinquent or in foreclosure | 2,066,000 | 2,065,000 | 2,099,000 | 2,388,000 |


