 RSS Feed
 by Calculated Risk on 5/04/2019 08:11:00 AM
Saturday, May 04, 2019
Schedule for Week of May 5, 2019
The key report this week is the April CPI.
No major economic releases scheduled.
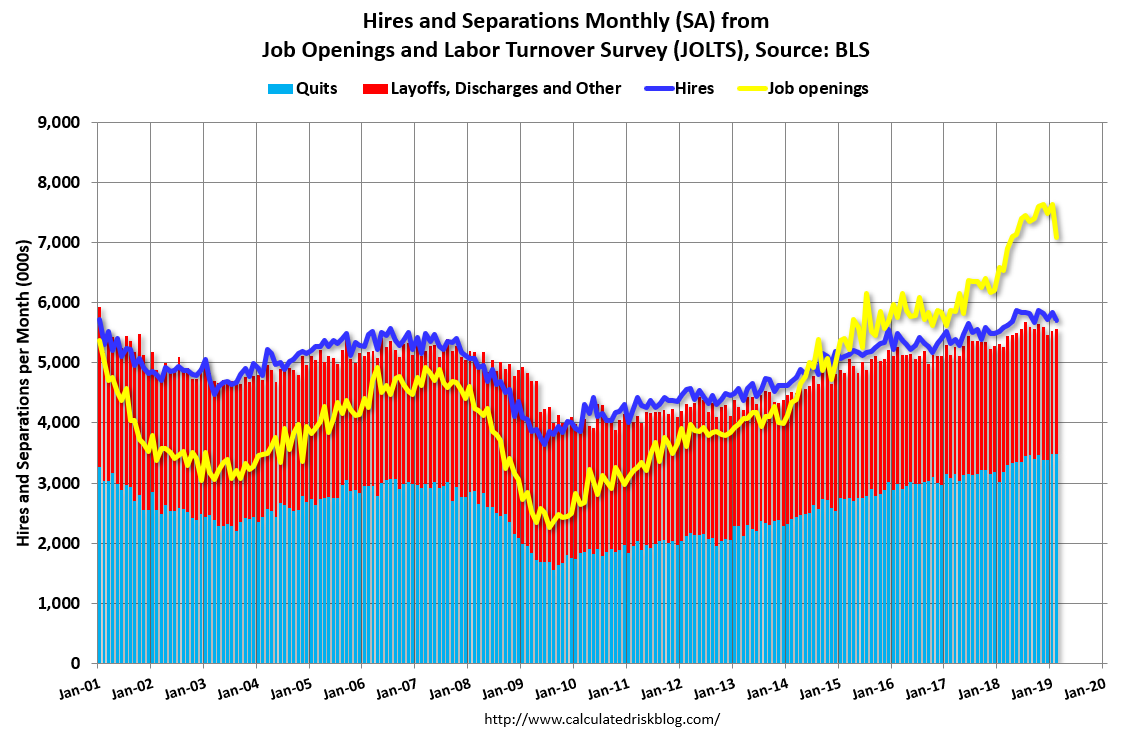 10:00 AM ET: Job Openings and Labor Turnover Survey for March from the BLS.
 This graph shows job openings (yellow line), hires (purple), Layoff, Discharges and other (red column), and Quits (light blue column) from the JOLTS.
Jobs openings increased decreased in February to 7.087 million from 7.625 million in January.
The number of job openings (yellow) were up 9% year-over-year, and Quits were up 10% year-over-year.
10:00 AM: Corelogic House Price index for February.
3:00 PM: Consumer Credit from the Federal Reserve.
7:00 AM ET: The Mortgage Bankers Association (MBA) will release the results for the mortgage purchase applications index.
8:30 AM: The initial weekly unemployment claims report will be released. The consensus is for 215 thousand initial claims, down from 230 thousand last week.
 8:30 AM: Trade Balance report for March from the Census Bureau.
 This graph shows the U.S. trade deficit, with and without petroleum, through the most recent report. The blue line is the total deficit, and the black line is the petroleum deficit, and the red line is the trade deficit ex-petroleum products.
The consensus is the trade deficit to be $50.1 billion. The U.S. trade deficit was at $49.4 Billion in February.
8:30 AM: The Producer Price Index for April from the BLS. The consensus is for a 0.2% increase in PPI, and a 0.2% increase in core PPI.
8:30 AM: The Consumer Price Index for April from the BLS. The consensus is for 0.4% increase in CPI, and a 0.2% increase in core CPI.
Friday, May 03, 2019
AAR: April Rail Carloads down 0.9% YoY, Intermodal Down 3.9% YoY
by Calculated Risk on 5/03/2019 04:27:00 PM
From the Association of American Railroads (AAR) Rail Time Indicators. Graphs and excerpts reprinted with permission.
Volumes for U.S. railroads in April 2019 were far from ideal, but they were much better than in March. Total carloads in April were down 0.9% (9,130 carloads), compared with a decline of 8.9% (93,616 carloads) in March. … The improvement in April was due partly to a return to near-normal operations in the Midwest as numerous rail lines that had been flooded were returned to service — coal and grain were especially impacted. ... Intermodal volume fell 3.9%, or 42,832 containers and trailers, in April 2019 from April 2018. That’s the third-straight monthly decline for intermodal, something that hasn’t happened since the fall of 2016.
emphasis added
 Click on graph for larger image.
This graph from the Rail Time Indicators report shows U.S. average weekly rail carloads (NSA). Red is 2019.
Rail carloads have been weak over the last decade due to the decline in coal shipments.
Rail traffic in April 2019 won’t win any prizes, but it could’ve been worse.
Total U.S. rail carloads were 1.04 million in April 2019, down 0.9%, or 9,130 carloads, from April 2018. That’s the third straight year-over-year monthly decline for total carloads, but it’s much better than the 8.9% decline in March and the 2.7% decline in February
For the first four months of 2019, total U.S. carloads were down 2.5%, or 109,930 carloads, from the first four months of 2018.
 The second graph is for intermodal traffic (using intermodal or shipping containers):
For the first four months of 2019, intermodal volume was down 1.4%, or 62,724 units, from the same period in 2019 … This year had a few moving pieces that aren’t always there — e.g., imports being rushed ashore late last year to beat scheduled tariff increases at the start of this year; intermodal lane rationalizations in some areas; the aforementioned flooding; and an economy that’s been even harder than usual to read.
Comments on April Employment Report
by Calculated Risk on 5/03/2019 03:14:00 PM
The headline jobs number at 263 thousand for April was above consensus expectations of 180 thousand, and the previous two months were revised up 16 thousand, combined. The unemployment rate declined to 3.6%. Overall this was a strong report.
Earlier: April Employment Report: 263,000 Jobs Added, 3.6% Unemployment Rate
In April, the year-over-year employment change was 2.620 million jobs. That is solid year-over-year growth.
Average Hourly Earnings
Wage growth was close to expectations. From the BLS:
"In April, average hourly earnings for all employees on private nonfarm payrolls rose by 6 cents to $27.77. Over the year, average hourly earnings have increased by 3.2 percent."
 This graph is based on “Average Hourly Earnings” from the Current Employment Statistics (CES) (aka "Establishment") monthly employment report. Note: There are also two quarterly sources for earnings data: 1) “Hourly Compensation,” from the BLS’s Productivity and Costs; and 2) the Employment Cost Index which includes wage/salary and benefit compensation.
The graph shows the nominal year-over-year change in "Average Hourly Earnings" for all private employees. Nominal wage growth was at 3.2% YoY in April.
Wage growth has generally been trending up.
Prime (25 to 54 Years Old) Participation
 Since the overall participation rate has declined due to cyclical (recession) and demographic (aging population, younger people staying in school) reasons, here is the employment-population ratio for the key working age group: 25 to 54 years old.
In the earlier period the participation rate for this group was trending up as women joined the labor force. Since the early '90s, the participation rate moved more sideways, with a downward drift starting around '00 - and with ups and downs related to the business cycle.
The 25 to 54 participation rate was declined in April at 82.2% from 82.5% in March, and the 25 to 54 employment population ratio was decreased to 79.7%.
Part Time for Economic Reasons
 From the BLS report:
"The number of persons employed part time for economic reasons (sometimes referred to as involuntary part-time workers) was little changed at 4.7 million in April. These individuals, who would have preferred full-time employment, were working part time because their hours had been reduced or because they were unable to find full-time jobs."The number of persons working part time for economic reasons increased in April to 4.654 million from 4.499 million in March. The number of persons working part time for economic reason has been generally trending down.
These workers are included in the alternate measure of labor underutilization (U-6) that was unchanged at 7.3% in April.
Unemployed over 26 Weeks
 This graph shows the number of workers unemployed for 27 weeks or more.
 According to the BLS, there are 1.230 million workers who have been unemployed for more than 26 weeks and still want a job. This was down from 1.305 million in March.
Summary:
The headline jobs number was above expectations, and the previous two months were revised up slightly. The headline unemployment rate declined to 3.6%.
This was a strong jobs report. The economy added 820 thousand jobs through April 2019, down from 879 thousand jobs during the same period in 2018. So it appears job growth has slowed somewhat, but is still solid.
The decline in the participation rate lowered the unemployment rate. Note that sometime soon the overall participation rate will start another steady decline due to demographic factors. The overall participation rate has been moving sideways for several years, as the expansion has offset the demographics factors.
ISM Non-Manufacturing Index decreased to 55.5% in April
by Calculated Risk on 5/03/2019 10:08:00 AM
The March ISM Non-manufacturing index was at 55.5%, down from 56.1% in March. The employment index decreased to 53.7%, from 55.2%. Note: Above 50 indicates expansion, below 50 contraction.
From the Institute for Supply Management: April 2019 Non-Manufacturing ISM Report On Business®
Economic activity in the non-manufacturing sector grew in April for the 111th consecutive month, say the nation’s purchasing and supply executives in the latest Non-Manufacturing ISM® Report On Business®.
The report was issued today by Anthony Nieves, CPSM, C.P.M., A.P.P., CFPM, Chair of the Institute for Supply Management® (ISM®) Non-Manufacturing Business Survey Committee: “The NMI® registered 55.5 percent, which is 0.6 percentage point lower than the March reading of 56.1 percent. This represents continued growth in the non-manufacturing sector, at a slightly slower rate. The Non-Manufacturing Business Activity Index increased to 59.5 percent, 2.1 percentage points higher than the March reading of 57.4 percent, reflecting growth for the 117th consecutive month, at a faster rate in April. The New Orders Index registered 58.1 percent; 0.9 percentage point lower than the reading of 59 percent in March. The Employment Index decreased 2.2 percentage points in April to 53.7 percent from the March reading of 55.9 percent. The Prices Index decreased 3 percentage points from the March reading of 58.7 percent to 55.7 percent, indicating that prices increased in April for the 23rd consecutive month. According to the NMI®, 15 non-manufacturing industries reported growth. The non-manufacturing sector has experienced an uptick in business activity, but in general, there has been a leveling off. Respondents are still mostly optimistic about overall business conditions, but concerns remain about employment resources.”
emphasis added
 Click on graph for larger image.
This graph shows the ISM non-manufacturing index (started in January 2008) and the ISM non-manufacturing employment diffusion index.
This suggests slower expansion in April than in March.
April Employment Report: 263,000 Jobs Added, 3.6% Unemployment Rate
by Calculated Risk on 5/03/2019 08:41:00 AM
From the BLS:
Total nonfarm payroll employment increased by 263,000 in April, and the unemployment rate declined to 3.6 percent, the U.S. Bureau of Labor Statistics reported today. Notable job gains occurred in professional and business services, construction, health care, and social assistance.
...
The change in total nonfarm payroll employment for February was revised up from +33,000 to +56,000, and the change for March was revised down from +196,000 to +189,000. With these revisions, employment gains in February and March combined were 16,000 more than previously reported.
...
In April, average hourly earnings for all employees on private nonfarm payrolls rose by 6 cents to $27.77. Over the year, average hourly earnings have increased by 3.2 percent.
emphasis added
 Click on graph for larger image.
The first graph shows the monthly change in payroll jobs, ex-Census (meaning the impact of the decennial Census temporary hires and layoffs is removed - mostly in 2010 - to show the underlying payroll changes).
Total payrolls increased by 263 thousand in April (private payrolls increased 236 thousand).
Payrolls for February and March were revised up 16 thousand combined.
 This graph shows the year-over-year change in total non-farm employment since 1968.
In April, the year-over-year change was 2.620 million jobs.
The third graph shows the employment population ratio and the participation rate.
 The Labor Force Participation Rate declined in April to 62.8%. This is the percentage of the working age population in the labor force. A large portion of the recent decline in the participation rate is due to demographics and long term trends.
The Employment-Population ratio was unchanged at 60.6% (black line).
I'll post the 25 to 54 age group employment-population ratio graph later.
 The fourth graph shows the unemployment rate.
 The unemployment rate declined in April to 3.6%.
This was above the consensus expectations of 180,000 jobs added, and February and March were revised up by 16,000 combined. A strong report.
I'll have much more later ...
Thursday, May 02, 2019
Friday: Employment Report
by Calculated Risk on 5/02/2019 07:47:00 PM
My April Employment Preview
Goldman: April Payrolls Preview
Friday:
• At 8:30 AM: Employment Report for April. The consensus is for 180,000 jobs added, and for the unemployment rate to be unchanged at 3.8%.
• At 10:00 AM: the ISM non-Manufacturing Index for April. The consensus is for a reading of 57.2, up from 56.1.
Hotels: Occupancy Rate Decreased Year-over-year
by Calculated Risk on 5/02/2019 05:42:00 PM
From HotelNewsNow.com: STR: U.S. hotel results for week ending 27 April
The U.S. hotel industry reported negative year-over-year results in the three key performance metrics during the week of 21-27 April 2019, according to data from STR.The following graph shows the seasonal pattern for the hotel occupancy rate using the four week average.
In comparison with the week of 22-28 April 2018, the industry recorded the following:
• Occupancy: -1.4% to 68.9%
• Average daily rate (ADR): -1.4% to US$128.66
• Revenue per available room (RevPAR): -2.9% to US$88.59
STR analysts attribute steep performance declines in many major markets to group business decreases on Easter Sunday and the Monday that followed. The corresponding days from 2018 were non-holiday dates.
emphasis added
 Click on graph for larger image.
The red line is for 2019, dash light blue is 2018, blue is the median, and black is for 2009 (the worst year probably since the Great Depression for hotels).
A decent start for 2019, close - to-date - compared to the previous 4 years.
Seasonally, the occupancy rate will mostly move sideways during the Spring, and then increase during the Summer travel season.
Data Source: STR, Courtesy of HotelNewsNow.com
Goldman: April Payrolls Preview
by Calculated Risk on 5/02/2019 02:50:00 PM
A few brief excerpts from a note by Goldman Sachs economist Spencer Hill:
We estimate nonfarm payrolls increased 195k in April (vs. consensus of 190k), as lower jobless claims and resilient employment surveys suggest that the pace of job growth remains solid.. …
We expect an unchanged unemployment rate in tomorrow’s report (3.8%; consensus also expects 3.8%). … We estimate a 0.2% rise in average hourly earnings (mom sa) that leaves the year-over-year rate unchanged at 3.2%
emphasis added
April Employment Preview
by Calculated Risk on 5/02/2019 11:17:00 AM
On Friday at 8:30 AM ET, the BLS will release the employment report for April. The consensus is for an increase of 180,000 non-farm payroll jobs in April, and for the unemployment rate to be unchanged at 3.8%.
Last month, the BLS reported 196,000 jobs added in March.
Here is a summary of recent data:
• The ADP employment report showed an increase of 275,000 private sector payroll jobs in April. This was below the consensus expectations of 180,000 private sector payroll jobs added. The ADP report hasn't been very useful in predicting the BLS report for any one month, but in general, this suggests employment growth above expectations.
• The ISM manufacturing employment index decreased in April to 52.4%. A historical correlation between the ISM manufacturing employment index and the BLS employment report for manufacturing, suggests that private sector BLS manufacturing payroll decreased about 5,000 in April. The ADP report indicated manufacturing jobs increased 5,000 in April.
The ISM non-manufacturing employment index for April will be released tomorrow.
• Initial weekly unemployment claims averaged 213,000 in April, about the same as in March. For the BLS reference week (includes the 12th of the month), initial claims were at 193,000, down from 216,000 during the reference week the previous month.
The significant decrease during the reference week suggests a stronger employment report in April than in March.
• The final April University of Michigan consumer sentiment index decreased to 97.2 from the March reading of 98.4. Sentiment is frequently coincident with changes in the labor market, but there are other factors too like gasoline prices and politics.
• Conclusion: In general these reports suggest a solid employment report. My guess is the headline employment increase will be above expectations (primarily based on strong ADP report and low level of unemployment claims during reference).
BEA: April Vehicles Sales decline to 16.4 Million SAAR
by Calculated Risk on 5/02/2019 09:49:00 AM
The BEA released their estimate of April vehicle sales this morning. The BEA estimated sales of 16.43 million SAAR in April 2019 (Seasonally Adjusted Annual Rate), down 5.8% from the March sales rate, and down 4.5% from April 2018.
With the weak sales in April, sales in 2019 are averaging 16.7 million (average of seasonally adjusted rate), down 2.3% compared to the same period in 2018.
 Click on graph for larger image.
This graph shows light vehicle sales since 2006 from the BEA (blue) and an estimate for April (red).
This was below the consensus forecast for April.
A small decline in sales this year isn't a concern - I think sales will move mostly sideways at near record levels.
This means the economic boost from increasing auto sales is over (from the bottom in 2009, auto sales boosted growth every year through 2016).
 The second graph shows light vehicle sales since the BEA started keeping data in 1967.
Note: dashed line is current estimated sales rate of 16.43 million SAAR.


