 RSS Feed
 by Calculated Risk on 4/10/2019 07:00:00 AM
Wednesday, April 10, 2019
MBA: Mortgage Purchase Applications up 13% YoY
From the MBA: Mortgage Applications Decrease in Latest MBA Weekly Survey
Mortgage applications decreased 5.6 percent from one week earlier, according to data from the Mortgage Bankers Association’s (MBA) Weekly Mortgage Applications Survey for the week ending April 5, 2019.
... The Refinance Index decreased 11 percent from the previous week. The seasonally adjusted Purchase Index increased 1 percent from one week earlier. The unadjusted Purchase Index increased 1 percent compared with the previous week and was 13 percent higher than the same week one year ago.
...
“Mortgage rates inched back up last week, but remain substantially lower than they were in the second half of last year,” said Mike Fratantoni, MBA Senior Vice President and Chief Economist. “As quickly as refinance activity increased in recent weeks, it backed down again in response to the rise in rates. However, this spring’s lower borrowing costs, coupled with the strong job market, continue to push purchase application volume much higher. Purchase applications are now up more than 13 percent compared to last year at this time.”
...
The average contract interest rate for 30-year fixed-rate mortgages with conforming loan balances ($484,350 or less) increased to 4.40 percent from 4.36 percent, with points increasing to 0.47 from 0.44 (including the origination fee) for 80 percent loan-to-value ratio (LTV) loans.
emphasis added
 Click on graph for larger image.
The first graph shows the refinance index since 1990.
Once mortgage rates fell more than 50 bps from the highs of last year, a number of recent buyers were able to refinance. But it would take another significant decrease in rates to see further refinance activity.
 The second graph shows the MBA mortgage purchase index
According to the MBA, purchase activity is up 13% year-over-year.
Tuesday, April 09, 2019
Wednesday: CPI, FOMC Minutes
by Calculated Risk on 4/09/2019 07:15:00 PM
Wednesday:
• At 7:00 AM ET, The Mortgage Bankers Association (MBA) will release the results for the mortgage purchase applications index.
• At 8:30 AM, The Consumer Price Index for March from the BLS. The consensus is for 0.3% increase in CPI, and a 0.2% increase in core CPI.
• At 2:00 PM, FOMC Minutes, Meeting of March 19-20, 2019
Seattle Real Estate in March: Sales down 7.8% YoY, Inventory up 136% YoY from Low Levels
by Calculated Risk on 4/09/2019 02:36:00 PM
The Northwest Multiple Listing Service reported Housing Market Rebounds From February Freeze
Both pending sales and new listing activity around Western Washington surged during March as buyers, sellers, and brokers emerged from February's record snowfall.The press release is for the Northwest. In King County, sales were down 8.3% year-over-year, and active inventory was up 36% year-over-year.
...
At month end, there were 12,017 active listings of single family homes and condos in the Northwest MLS database. That represents an increase of more than 36 percent from a year ago when there were only 8,825 active listings. Inventory more than doubled in King County compared to a year ago, rising from 2,060 active listings to 4,263 at the end of March. Nine counties reported less inventory than 12 months ago.
emphasis added
In Seattle, sales were down 7.8% year-over-year, and inventory was up 136% year-over-year from very low levels. This is another market with inventory increasing sharply year-over-year, but months-of-supply in Seattle is still on the low side at 2.0 months.
Philly Fed: State Coincident Indexes increased in 42 states in February
by Calculated Risk on 4/09/2019 12:22:00 PM
From the Philly Fed:
The Federal Reserve Bank of Philadelphia has released the coincident indexes for the 50 states for February 2019. Over the past three months, the indexes increased in 44 states, decreased in three states, and remained stable in three, for a three month diffusion index of 82. In the past month, the indexes increased in 42 states, decreased in four states, and remained stable in four, for a one-month diffusion index of 76.Note: These are coincident indexes constructed from state employment data. An explanation from the Philly Fed:
emphasis added
The coincident indexes combine four state-level indicators to summarize current economic conditions in a single statistic. The four state-level variables in each coincident index are nonfarm payroll employment, average hours worked in manufacturing by production workers, the unemployment rate, and wage and salary disbursements deflated by the consumer price index (U.S. city average). The trend for each state’s index is set to the trend of its gross domestic product (GDP), so long-term growth in the state’s index matches long-term growth in its GDP.
 Click on map for larger image.
Here is a map of the three month change in the Philly Fed state coincident indicators. This map was all red during the worst of the recession, and all or mostly green during most of the recent expansion.
The map is mostly green on a three month basis, but there are some red and grey (unchanged) states.
Source: Philly Fed.
Note: For complaints about red / green issues, please contact the Philly Fed.
 And here is a graph is of the number of states with one month increasing activity according to the Philly Fed. This graph includes states with minor increases (the Philly Fed lists as unchanged).
In February, 45 states had increasing activity (including minor increases).
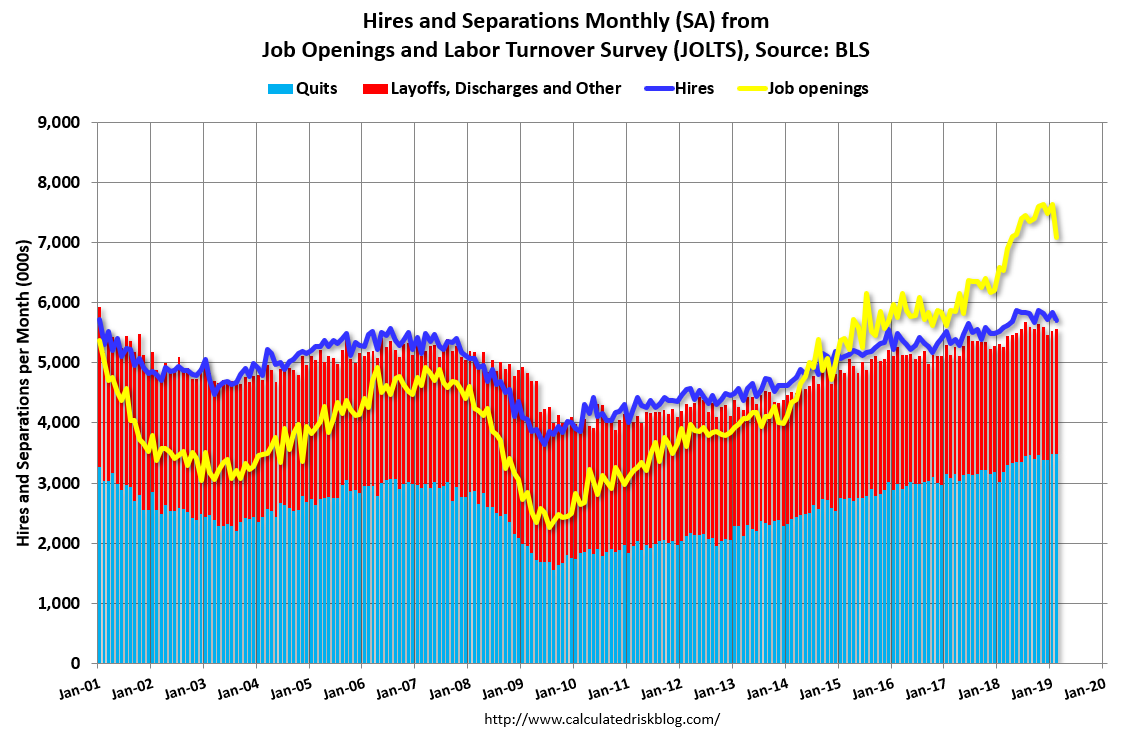
BLS: Job Openings Decreased to 7.1 Million in February
by Calculated Risk on 4/09/2019 10:07:00 AM
Notes: In February there were 7.581 million job openings, and, according to the February Employment report, there were 6.235 million unemployed. So, for the twelfth consecutive month, there were more job openings than people unemployed. Also note that the number of job openings has exceeded the number of hires since January 2015 (over 4 years).
From the BLS: Job Openings and Labor Turnover Summary
The number of job openings fell to 7.1 million on the last business day of February, the U.S. Bureau of Labor Statistics reported today. Over the month, hires and separations were little changed at 5.7 million and 5.6 million, respectively. Within separations, the quits rate was unchanged at 2.3 percent and the layoffs and discharges rate was little changed at 1.2 percent. ...The following graph shows job openings (yellow line), hires (dark blue), Layoff, Discharges and other (red column), and Quits (light blue column) from the JOLTS.
The number of quits was little changed in February at 3.5 million. The quits rate was 2.3 percent. The quits level was little changed for total private and for government.
emphasis added
This series started in December 2000.
Note: The difference between JOLTS hires and separations is similar to the CES (payroll survey) net jobs headline numbers. This report is for February, the most recent employment report was for March.
 Click on graph for larger image.
Note that hires (dark blue) and total separations (red and light blue columns stacked) are pretty close each month. This is a measure of labor market turnover. When the blue line is above the two stacked columns, the economy is adding net jobs - when it is below the columns, the economy is losing jobs.
Jobs openings decreased in February to 7.087 million from 7.625 million in January.
The number of job openings (yellow) are up 9% year-over-year.
Quits are up 10% year-over-year. These are voluntary separations. (see light blue columns at bottom of graph for trend for "quits").
Job openings remain at a high level, and quits are still increasing year-over-year. Despite the decrease in job openings, this was still a solid report.
Small Business Optimism Index increased slightly in March
by Calculated Risk on 4/09/2019 08:47:00 AM
CR Note: Most of this survey is noise, but there is some information, especially on the labor market and the "Single Most Important Problem".
From the National Federation of Independent Business (NFIB): March 2019 Report: Small Business Optimism Index
The Small Business Optimism Index improved slightly, increasing 0.1 points to 101.8. Three Index components fell, two were unchanged, and five improved. The major soft spot was in inventories: stocks were viewed as too large (a negative in the Index) and plans to invest in inventories turned slightly negative (e.g. more firms plan reductions than additions). The labor market indicators improved, capital spending plans held steady, and the outlook for expansion and real sales gained ground as did reports of rising earnings.
..
Job creation was solid in March with a net addition of 0.50 workers per firm (including those making no change in employment), close to February’s record of 0.52, and up from 0.33 in January.
Twenty-one percent of owners cited the difficulty of finding qualified workers as their Single Most Important Business Problem, only 4 points below the record high. Thirty-nine percent of all owners reported job openings they could not fill in the current period, up 2 points from February and equal to the record high set in December.
emphasis added
 Click on graph for larger image.
This graph shows the small business optimism index since 1986.
The index increased to 101.8 in March.
Note: Usually small business owners complain about taxes and regulations (currently 2nd and 3rd on the "Single Most Important Problem" list). However, during the recession, "poor sales" was the top problem. Now the difficulty of finding qualified workers is the top problem.
Monday, April 08, 2019
Tuesday: Job Openings
by Calculated Risk on 4/08/2019 06:40:00 PM
From Matthew Graham at Mortgage News Daily: Mortgage Rates Relatively Flat Today, But Tomorrow Brings Challenges
Mortgage rates were flat-to-slightly-higher today, depending on the lender and the time of day. … In the bigger picture, rates are on the edge of the lower range seen in recent weeks and the higher range that dominated most of 2019. [30YR FIXED - 4.125%]Tuesday:
emphasis added
• At 6:00 AM ET, NFIB Small Business Optimism Index for March.
• At 10:00 AM, Job Openings and Labor Turnover Survey for February from the BLS.
Update: Framing Lumber Prices Down 30% Year-over-year
by Calculated Risk on 4/08/2019 02:31:00 PM
Here is another monthly update on framing lumber prices. Lumber prices declined from the record highs in early 2018, and are now down about 30% year-over-year.
This graph shows two measures of lumber prices: 1) Framing Lumber from Random Lengths through April 5, 2019 (via NAHB), and 2) CME framing futures.
 Click on graph for larger image in graph gallery.
Right now Random Lengths prices are down 27% from a year ago, and CME futures are down 34% year-over-year.
There is a seasonal pattern for lumber prices, and usually prices will increase in the Spring, and peak around May, and then bottom around October or November - although there is quite a bit of seasonal variability.
AAR: March Rail Carloads down 8.9% YoY, Intermodal Down 1.5% YoY
by Calculated Risk on 4/08/2019 11:54:00 AM
From the Association of American Railroads (AAR) Rail Time Indicators. Graphs and excerpts reprinted with permission.
We used this phrase a few years ago in Rail Time Indicators, but it’s appropriate again now: sometimes you’re the windshield and sometimes you’re the bug. In March, railroads were the bug. Total U.S. rail carloads in March 2019 were down 8.9% (93,616 carloads) from March 2018. That’s the biggest percentage decline for total carloads for any month since May 2016. … U.S. intermodal originations were down 1.5% (16,387 containers and trailers) in March 2019 from March 2018. Combined with a 0.9% decline in February, this marks the first two-month decline for intermodal since October 2016.
A slowing economy may be having an impact on rail traffic, but bad weather is a more likely culprit. March had bad weather events in many places, but the worst was the horrendous flooding in Nebraska and Iowa caused by melting snow and heavy rain.
emphasis added
 Click on graph for larger image.
This graph from the Rail Time Indicators report shows U.S. average weekly rail carloads (NSA). Red is 2019.
Rail carloads have been weak over the last decade due to the decline in coal shipments.
In March, just 4 of the 20 carload commodity categories the AAR tracks saw carload gains — the fewest since July 2016. The 8.9% decline in March was the biggest percentage decline for total carloads for any month since May 2016, and follows a 2.7% decline in February. Weekly average total carloads in March 2019 were 239,286, the fourth lowest of any month since sometime prior to 1988, when our data begin.
For the first quarter of 2019, total carloads were down 3.1%, or 100,800 carloads, from the first quarter of 2018. That’s the biggest quarterly decline since the third quarter of 2016.
 The second graph is for intermodal traffic (using intermodal or shipping containers):
U.S. intermodal originations were down 1.5% (16,387 containers and trailers) in March 2019 from March 2018. Combined with a 0.9% decline in February, this marks the first two-month decline since October 2016. Weekly average intermodal volume in March 2019 was 266,448 units, the second best for March in history (behind March 2018). For the first quarter, intermodal was down 0.6%.Traffic will likely pick up in April, and there might be some bounce back from the poor weather and flooding.
Las Vegas Real Estate in March: Sales Down 16% YoY, Inventory up 92% YoY
by Calculated Risk on 4/08/2019 09:36:00 AM
This is a key former distressed market to follow since Las Vegas saw the largest price decline, following the housing bubble, of any of the Case-Shiller composite 20 cities.
The Greater Las Vegas Association of Realtors reported Local home prices inch up to $300,000 as homes selling at slower pace; GLVAR housing statistics for March 2019
Local home prices inched back up to the $300,000 mark in March while fewer properties changed hands and more homes were on the market than one year ago. So says a report released Monday by the Greater Las Vegas Association of REALTORS® (GLVAR).1) Overall sales were down 16% year-over-year from 3,886 in March 2018 to 3,260 in March 2019.
...
The total number of existing local homes, condos and townhomes sold during March was 3,260. Compared to one year ago, March sales were down 16.8 percent for homes and down 12.9 percent for condos and townhomes.
...
At the current sales pace, Carpenter said Southern Nevada now has less than a three-month supply of homes available for sale. That’s up sharply from one year ago, but still below what would normally be considered a balanced market. By the end of March, GLVAR reported 7,091 single-family homes listed for sale without any sort of offer. That’s up 84.9 percent from one year ago. For condos and townhomes, the 1,751 properties listed without offers in March represented a 130.1 percent jump from one year ago.
...
The number of so-called distressed sales also continues to drop. GLVAR reported that short sales and foreclosures combined accounted for just 2.5 percent of all existing local property sales in March. That’s down from 2.9 percent of all sales one year ago and from 9.8 percent two years ago.
emphasis added
2) Active inventory (single-family and condos) is up sharply from a year ago, from a total of 4,596 in March 2018 to 8,842 in March 2019. Note: Total inventory was up 92% year-over-year. This is a significant increase in inventory, although smaller than the previous two months, and months-of-supply is still somewhat low.
3) Fewer distressed sales.


