 RSS Feed
 by Calculated Risk on 9/06/2018 08:19:00 AM
Thursday, September 06, 2018
ADP: Private Employment increased 163,000 in August
Private sector employment increased by 163,000 jobs from July to August according to the August ADP National Employment Report®. ... The report, which is derived from ADP’s actual payroll data, measures the change in total nonfarm private employment each month on a seasonally-adjusted basis.This was below the consensus forecast for 182,000 private sector jobs added in the ADP report.
...
“Although we saw a small slowdown in job growth the market remains incredibly dynamic,” said Ahu Yildirmaz, vice president and co-head of the ADP Research Institute. “Midsized businesses continue to be the engine of growth, adding nearly 70 percent of all jobs this month, and remain resiliant in the current economic climate.”
Mark Zandi, chief economist of Moody’s Analytics, said, “The job market is hot. Employers are aggressively competing to hold onto their existing workers and to find new ones. Small businesses are struggling the most in this competition, as they increasingly can’t fill open positions.”
The BLS report for August will be released Friday, and the consensus is for 198,000 non-farm payroll jobs added in August.
Wednesday, September 05, 2018
Thursday: ADP Employment, Weekly Unemployment Claims, ISM Non-Mfg Survey
by Calculated Risk on 9/05/2018 05:55:00 PM
From Goldman Sachs:
The details of the trade balance report were similar to our previous assumptions, and we left our Q3 GDP tracking estimate unchanged on a rounded basis at +3.0% (qoq ar).Thursday:
• At 8:15 AM ET, The ADP Employment Report for August. This report is for private payrolls only (no government). The consensus is for 182,000 payroll jobs added in August, down from 219,000 added in July.
• At 8:30 AM, The initial weekly unemployment claims report will be released. The consensus is for 213 thousand initial claims, unchanged from 213 thousand the previous week.
• At 10:00 AM, the ISM non-Manufacturing Index for August. The consensus is for index to increase to 56.8 from 55.7 in July.
Annual Vehicle Sales: On Pace to decline in 2018
by Calculated Risk on 9/05/2018 12:50:00 PM
The BEA released their estimate of August vehicle sales. The BEA estimated sales of 16.596 million SAAR in August 2018 (Seasonally Adjusted Annual Rate), down 0.6% from the July sales rate, and up 0.9% from August 2017 (August was the weakest sales month last year due to the impact of the hurricanes).
Through August, light vehicle sales are on pace to be down slightly in 2018 compared to 2017.
This would make 2018 the sixth best year on record after 2016, 2015, 2000, 2017 and 2001.
My guess is vehicle sales will finish the year with sales lower than in 2017 (sales in late 2017 were boosted by buying following the hurricanes), and will probably be below 17 million for the year (the lowest since 2014).
A small decline in sales this year isn't a concern - I think sales will move mostly sideways at near record levels.
As I noted last year, this means the economic boost from increasing auto sales is over (from the bottom in 2009, auto sales boosted growth every year through 2016).

Click on graph for larger image.
This graph shows annual light vehicle sales since 1976. Source: BEA.
Sales for 2018 are estimated based on the pace of sales during the first eight months.
The second graph below shows the mix of sales since 1976 (Blue is cars, Red is light trucks and SUVs).
 The mix has changed significantly. Back in 1976, most light vehicles were passenger cars - however car sales have trended down over time.
Note that the big dips in sales are related to economic recessions (early '80s, early '90s, and the Great Recession of 2007 through mid-2009).
The second graph shows the percent of light vehicle sales between passenger cars and trucks / SUVs.
 Over time the mix has changed toward more and more light trucks and SUVs.
Only when oil prices are high, does the trend slow or reverse.
Recently oil prices have been fairly low (now increasing), and the percent of light trucks and SUVs is just over 70% for the first time ever.
U.S. Light Vehicle Sales at 16.7 million annual rate in August
by Calculated Risk on 9/05/2018 10:56:00 AM
Based on a preliminary estimate from AutoData, light vehicle sales were at a 16.7 million SAAR in August.
Note: All other data from the BEA (the BEA will report this month's sales soon).
That is up 1.5% year-over-year from August 2017, and unchanged from last month.
 Click on graph for larger image.
This graph shows the historical light vehicle sales from the BEA (blue) and an estimate for August (red, light vehicle sales of 16.7 million SAAR from AutoData).
Note that this was an easy comparison to last August, since sales in August 2017 were negatively impacted by hurricanes. The increase in sales at the end of 2017 was due to buying following the hurricanes.
Sales will probably decline in 2018 after setting new sales records in both 2015 and 2016.
 The second graph shows light vehicle sales since the BEA started keeping data in 1967.
Note: dashed line is current estimated sales rate.
This was below the consensus forecast for August.
Trade Deficit increased to $50.1 Billion in July
by Calculated Risk on 9/05/2018 08:42:00 AM
From the Department of Commerce reported:
The U.S. Census Bureau and the U.S. Bureau of Economic Analysis announced today that the goods and services deficit was $50.1 billion in July, up $4.3 billion from $45.7 billion in June, revised. … July exports were $211.1 billion, $2.1 billion less than June exports. July imports were $261.2 billion, $2.2 billion more than June imports.
 Click on graph for larger image.
Exports decreased and imports increased in July.
Exports are 28% above the pre-recession peak and up 8% compared to July 2017; imports are 12% above the pre-recession peak, and up 9% compared to July 2017.
In general, trade has been picking up.
The second graph shows the U.S. trade deficit, with and without petroleum.
 The blue line is the total deficit, and the black line is the petroleum deficit, and the red line is the trade deficit ex-petroleum products.
Oil imports averaged $64.63 in July, up from $62.42 in June, and up from $43.13 in July 2017.
The trade deficit with China increased to $36.8 billion in July, from $33.6 billion in July 2017.
MBA: Mortgage Applications Decreased Slightly in Latest Weekly Survey
by Calculated Risk on 9/05/2018 07:00:00 AM
From the MBA: Mortgage Applications Slightly Decrease in Latest MBA Weekly Survey
Mortgage applications decreased 0.1 percent from one week earlier, according to data from the Mortgage Bankers Association’s (MBA) Weekly Mortgage Applications Survey for the week ending August 31, 2018.
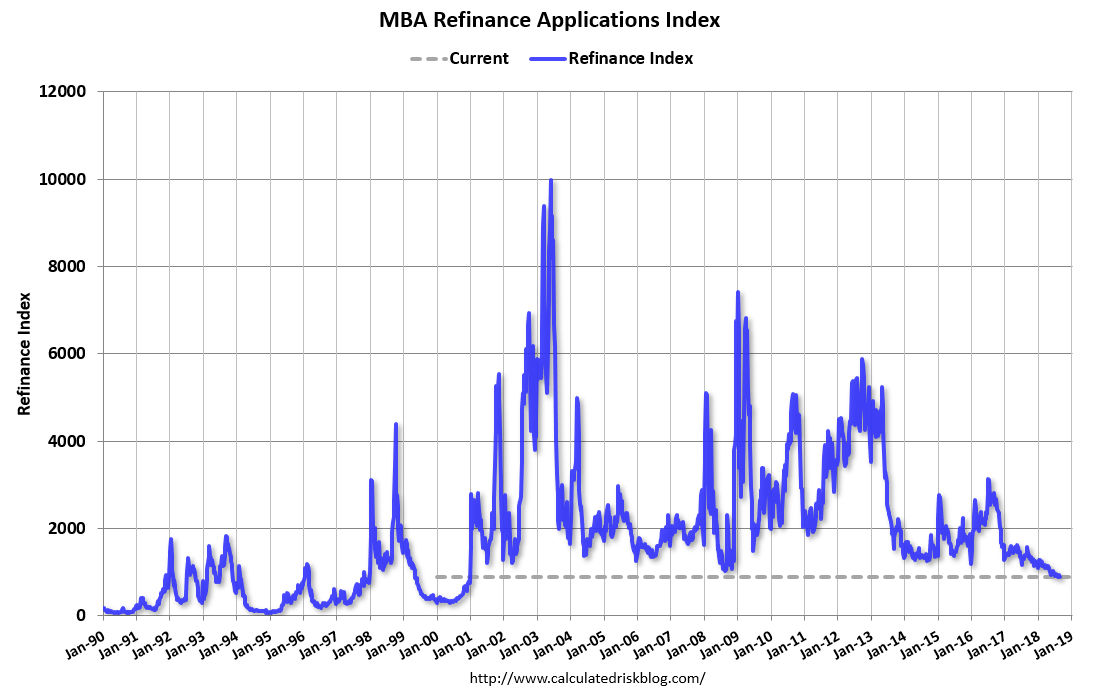
... The Refinance Index decreased 1 percent from the previous week. The seasonally adjusted Purchase Index increased 1 percent from one week earlier. The unadjusted Purchase Index decreased 2 percent compared with the previous week and was 2 percent higher than the same week one year ago. ...
The average contract interest rate for 30-year fixed-rate mortgages with conforming loan balances ($453,100 or less) increased to 4.80 percent from 4.78 percent, with points decreasing to 0.43 from 0.46 (including the origination fee) for 80 percent loan-to-value ratio (LTV) loans.
emphasis added
 Click on graph for larger image.
The first graph shows the refinance index since 1990.
Refinance activity will not pick up significantly unless mortgage rates fall 50 bps or more from the recent level.
 The second graph shows the MBA mortgage purchase index
 According to the MBA, purchase activity is up 2% year-over-year.
Tuesday, September 04, 2018
Wednesday: Trade Deficit
by Calculated Risk on 9/04/2018 07:31:00 PM
From Matthew Graham at Mortgage News Daily: Mortgage Rates Snap Back to Recent Highs
Mortgage rates moved higher today, reversing the improvement seen last Friday. The average lender is now back in line with their highest levels of the past few weeks, although that statement requires some qualification. During that time, mortgage rates have been in such a narrow range that we can only measure day-to-day changes in terms of upfront closing costs/credits. Actual interest rates haven't moved, but "effective rates" are back at recent highs. [30YR FIXED - 4.625% - 4.75%]Wednesday:
emphasis added
• At 7:00 AM ET: The Mortgage Bankers Association (MBA) will release the results for the mortgage purchase applications index.
• At 8:30 AM: Trade Balance report for July from the Census Bureau. The consensus is for the U.S. trade deficit to be at $50.2 billion in July from $46.3 billion in June.
Update: Framing Lumber Prices Off from Record Highs
by Calculated Risk on 9/04/2018 04:50:00 PM
Here is another monthly update on framing lumber prices. Lumber prices declined in August from the recent record highs, but are still up year-over-year.
This graph shows two measures of lumber prices: 1) Framing Lumber from Random Lengths through August 24, 2018 (via NAHB), and 2) CME framing futures.
 Click on graph for larger image in graph gallery.
Right now Random Lengths prices are up 11% from a year ago, and CME futures are up about 19% year-over-year.
There is a seasonal pattern for lumber prices. Prices frequently peak around May, and bottom around October or November - although there is quite a bit of seasonal variability.
Construction Spending increased 0.1% in July
by Calculated Risk on 9/04/2018 11:16:00 AM
Earlier today, the Census Bureau reported that overall construction spending increased slightly in July:
Construction spending during July 2018 was estimated at a seasonally adjusted annual rate of $1,315.4 billion, 0.1 percent above the revised June estimate of $1,314.2 billion. The July figure is 5.8 percent above the July 2017 estimate of $1,242.8 billion.Private spending decreased and public spending increased:
Spending on private construction was at a seasonally adjusted annual rate of $1,010.9 billion, 0.1 percent below the revised June estimate of $1,011.9 billion. ...
In July, the estimated seasonally adjusted annual rate of public construction spending was $304.5 billion, 0.7 percent above the revised June estimate of $302.3 billion.
emphasis added
 Click on graph for larger image.
This graph shows private residential and nonresidential construction spending, and public spending, since 1993. Note: nominal dollars, not inflation adjusted.
Private residential spending has been increasing, but is still 17% below the bubble peak.
Non-residential spending is 9% above the previous peak in January 2008 (nominal dollars).
Public construction spending is now 6% below the peak in March 2009, and 16% above the austerity low in February 2014.
 The second graph shows the year-over-year change in construction spending.
On a year-over-year basis, private residential construction spending is up 7%. Non-residential spending is up 3% year-over-year. Public spending is up 8% year-over-year.
This was below the consensus forecast of a 0.4% increase for July. Also, construction spending for May and June were revised down.
ISM Manufacturing index increased to 61.3 in August
by Calculated Risk on 9/04/2018 10:04:00 AM
The ISM manufacturing index indicated expansion in August. The PMI was at 61.3% in August, up from 58.1% in July. The employment index was at 58.5%, up from 56.5% last month, and the new orders index was at 65.1%, up from 60.2%.
From the Institute for Supply Management: August 2018 Manufacturing ISM® Report On Business®
Economic activity in the manufacturing sector expanded in August, and the overall economy grew for the 112th consecutive month, say the nation’s supply executives in the latest Manufacturing ISM® Report On Business®.
The report was issued today by Timothy R. Fiore, CPSM, C.P.M., Chair of the Institute for Supply Management® (ISM®) Manufacturing Business Survey Committee: “The August PMI® registered 61.3 percent, an increase of 3.2 percentage points from the July reading of 58.1 percent. The New Orders Index registered 65.1 percent, an increase of 4.9 percentage points from the July reading of 60.2 percent. The Production Index registered 63.3 percent, a 4.8-percentage point increase compared to the July reading of 58.5 percent. The Employment Index registered 58.5 percent, an increase of 2 percentage points from the July reading of 56.5 percent. The Supplier Deliveries Index registered 64.5 percent, a 2.4-percentage point increase from the July reading of 62.1 percent. The Inventories Index registered 55.4 percent, an increase of 2.1 percentage points from the July reading of 53.3 percent. The Prices Index registered 72.1 percent in August, a 1.1-percentage point decrease from the July reading of 73.2 percent, indicating higher raw materials prices for the 30th consecutive month.
…
"Respondents are again overwhelmingly concerned about tariff-related activity, including how reciprocal tariffs will impact company revenue and current manufacturing locations."
emphasis added
 Click on graph for larger image.
Here is a long term graph of the ISM manufacturing index.
This was above expectations of 57.6%, and suggests manufacturing expanded at a faster pace in August than in July.
This was a strong report.


