 RSS Feed
 by Calculated Risk on 8/28/2018 04:28:00 PM
Tuesday, August 28, 2018
Zillow Case-Shiller Forecast: Slower House Price Gains in July
The Case-Shiller house price indexes for June were released today. Zillow forecasts Case-Shiller a month early, and I like to check the Zillow forecasts since they have been pretty close.
From Aaron Terrazas at Zillow: June Case-Shiller Results and July Forecast
It’s hard not to notice the winds beginning to shift in the housing market. But those changes have yet to reach the point where they’ve fully transitioned from home buyer headwinds into tailwinds, and likely won’t until at least the end of the decade.The Zillow forecast is for the year-over-year change for the Case-Shiller National index to be smaller in July than in June.
Still, the signs of change are here: The U.S. National Case-Shiller Home Price Index climbed 6.2 percent in June from a year earlier, slightly slower than the 6.4 percent annual growth recorded in May. June prices rose 0.3 percent from May – slightly below expectations.
...
But the slowdown, and the changes it brings, will be gradual. Inventory, when it begins to rise, will be coming up from incredibly low levels. Home value growth remains well above historic norms, even as it slows in some markets – and that rapid growth still makes saving an adequate down payment a challenge for many buyers. And while sellers are seemingly more open to cutting their initial asking price than in recent months, that trend is more prominent at the upper end of the market where there is more selection.
...
Zillow’s expects Case-Shiller data for July, to be released September 25, to show national home-price appreciation of 6.1 percent year-over-year.

Update: A few comments on the Seasonal Pattern for House Prices
by Calculated Risk on 8/28/2018 01:02:00 PM
CR Note: This is a repeat of earlier posts with updated graphs.
A few key points:
1) There is a clear seasonal pattern for house prices.
2) The surge in distressed sales during the housing bust distorted the seasonal pattern.
3) Even though distressed sales are down significantly, the seasonal factor is based on several years of data - and the factor is now overstating the seasonal change (second graph below).
4) Still the seasonal index is probably a better indicator of actual price movements than the Not Seasonally Adjusted (NSA) index.
For in depth description of these issues, see former Trulia chief economist Jed Kolko's article "Let’s Improve, Not Ignore, Seasonal Adjustment of Housing Data"
Note: I was one of several people to question the change in the seasonal factor (here is a post in 2009) - and this led to S&P Case-Shiller questioning the seasonal factor too (from April 2010). I still use the seasonal factor (I think it is better than using the NSA data).
 Click on graph for larger image.
This graph shows the month-to-month change in the NSA Case-Shiller National index since 1987 (through June 2018). The seasonal pattern was smaller back in the '90s and early '00s, and increased once the bubble burst.
The seasonal swings have declined since the bubble.
 The second graph shows the seasonal factors for the Case-Shiller National index since 1987. The factors started to change near the peak of the bubble, and really increased during the bust.
The swings in the seasonal factors has started to decrease, and I expect that over the next several years - as recent history is included in the factors - the seasonal factors will move back towards more normal levels.
However, as Kolko noted, there will be a lag with the seasonal factor since it is based on several years of recent data.
Real House Prices and Price-to-Rent Ratio in June
by Calculated Risk on 8/28/2018 11:01:00 AM
Here is the earlier post on Case-Shiller: Case-Shiller: National House Price Index increased 6.2% year-over-year in June
It has been over eleven years since the bubble peak. In the Case-Shiller release this morning, the seasonally adjusted National Index (SA), was reported as being 9.8% above the previous bubble peak. However, in real terms, the National index (SA) is still about 9.6% below the bubble peak (and historically there has been an upward slope to real house prices). The composite 20, in real terms, is still 15.7% below the bubble peak.
The year-over-year increase in prices is mostly moving sideways now around 6%. In June, the index was up 6.2% YoY.
Usually people graph nominal house prices, but it is also important to look at prices in real terms (inflation adjusted). Case-Shiller and others report nominal house prices. As an example, if a house price was $200,000 in January 2000, the price would be close to $285,000 today adjusted for inflation (42%). That is why the second graph below is important - this shows "real" prices (adjusted for inflation).
Nominal House Prices
 The first graph shows the monthly Case-Shiller National Index SA, and the monthly Case-Shiller Composite 20 SA (through June) in nominal terms as reported.
In nominal terms, the Case-Shiller National index (SA)and the Case-Shiller Composite 20 Index (SA) are both at new all times highs (above the bubble peak).
Real House Prices
 The second graph shows the same two indexes in real terms (adjusted for inflation using CPI less Shelter). Note: some people use other inflation measures to adjust for real prices.
In real terms, the National index is back to December 2004 levels, and the Composite 20 index is back to June 2004.
In real terms, house prices are at 2004 levels.
Price-to-Rent
In October 2004, Fed economist John Krainer and researcher Chishen Wei wrote a Fed letter on price to rent ratios: House Prices and Fundamental Value. Kainer and Wei presented a price-to-rent ratio using the OFHEO house price index and the Owners' Equivalent Rent (OER) from the BLS.
 Here is a similar graph using the Case-Shiller National and Composite 20 House Price Indexes.
This graph shows the price to rent ratio (January 2000 = 1.0).
On a price-to-rent basis, the Case-Shiller National index is back to February 2004 levels, and the Composite 20 index is back to November 2003 levels.
In real terms, prices are back to mid 2004 levels, and the price-to-rent ratio is back to late 2003, early 2004.
Richmond Fed: "Fifth District Manufacturing Firms Reported Strong Growth in August"
by Calculated Risk on 8/28/2018 10:05:00 AM
From the Richmond Fed: Fifth District Manufacturing Firms Reported Strong Growth in August
Fifth District manufacturing activity expanded in August, according to results of the most recent survey from the Federal Reserve Bank of Richmond. The composite index rose from 20 in July to 24 in August, as all three components (shipments, new orders, and employment) increased. Respondents remained optimistic in August, expecting growth to continue in the coming months.This was the last of the regional Fed surveys for August.
Employment and wages continued to rise, yet manufacturing firms continued to struggle to find workers with the skills they needed, as this indicator dropped to −17, its lowest value on record.
emphasis added
Here is a graph comparing the regional Fed surveys and the ISM manufacturing index:
 Click on graph for larger image.
The New York and Philly Fed surveys are averaged together (yellow, through August), and five Fed surveys are averaged (blue, through August) including New York, Philly, Richmond, Dallas and Kansas City. The Institute for Supply Management (ISM) PMI (red) is through July (right axis).
Based on these regional surveys, it seems likely the ISM manufacturing index will be solid in August, but below 60 (to be released on Tuesday, September 4th).
Case-Shiller: National House Price Index increased 6.2% year-over-year in June
by Calculated Risk on 8/28/2018 09:11:00 AM
S&P/Case-Shiller released the monthly Home Price Indices for June ("June" is a 3 month average of April, May and June prices).
This release includes prices for 20 individual cities, two composite indices (for 10 cities and 20 cities) and the monthly National index.
Note: Case-Shiller reports Not Seasonally Adjusted (NSA), I use the SA data for the graphs.
From S&P: Las Vegas Leads Price Gains in June According to the S&P CoreLogic Case-Shiller Index
The S&P CoreLogic Case-Shiller U.S. National Home Price NSA Index, covering all nine U.S. census divisions, reported a 6.2% annual gain in June, down from 6.4% in the previous month. The 10-City Composite annual increase came in at 6.0%, down from 6.2% in the previous month. The 20-City Composite posted a 6.3% year-over-year gain, down from 6.5% in the previous month.
Las Vegas, Seattle and San Francisco continued to report the highest year-over-year gains among the 20 cities. In June, Las Vegas led the way with a 13.0% year-over-year price increase, followed by Seattle with a 12.8% increase and San Francisco with a 10.7% increase. Six of the 20 cities reported greater price increases in the year ending June 2018 versus the year ending May 2018.
...
Before seasonal adjustment, the National Index posted a month-over-month gain of 0.8% in June. The 10-City and 20-City Composites reported increases of 0.4% and 0.5%, respectively. After seasonal adjustment, the National Index recorded a 0.3% month-over-month increase in June. The 10-City and 20-City Composites both posted 0.1% month-over-month increases. Nineteen of 20 cities reported increases in June before seasonal adjustment, while 17 of 20 cities reported increases after seasonal adjustment.
“Home prices continue to rise across the U.S.” says David M. Blitzer, Managing Director and Chairman of the Index Committee at S&P Dow Jones Indices. “However, even as home prices keep climbing, we are seeing signs that growth is easing in the housing market. Sales of both new and existing homes are roughly flat over the last six months amidst news stories of an increase in the number of homes for sale in some markets. Rising mortgage rates – 30 year fixed rate mortgages rose from 4% to 4.5% since January – and the rise in home prices are affecting housing affordability.
“The west still leads the rise in home prices with Las Vegas displacing Seattle as the market with the fastest price increase. Population and employment growth often drive homes prices. Las Vegas is among the fastest growing U.S. cities based on both employment and population, with its unemployment rate dropping below the national average in the last year. The northeast and mid-west are seeing smaller home price increases. Washington, Chicago and New York City showed the three slowest annual price gains among the 20 cities covered.”
emphasis added
 Click on graph for larger image.
 The first graph shows the nominal seasonally adjusted Composite 10, Composite 20 and National indices (the Composite 20 was started in January 2000).
The Composite 10 index is off 0.9% from the bubble peak, and up 0.1% in June (SA).
The Composite 20 index is 2.3% above the bubble peak, and up 0.1% (SA) in June.
The National index is 9.8% above the bubble peak (SA), and up 0.3% (SA) in June. The National index is up 48.5% from the post-bubble low set in December 2011 (SA).
 The second graph shows the Year over year change in all three indices.
The Composite 10 SA is up 6.0% compared to June 2017. The Composite 20 SA is up 6.3% year-over-year.
The National index SA is up 6.2% year-over-year.
Note: According to the data, prices increased in 17 of 20 cities month-over-month seasonally adjusted.
I'll have more later.
Monday, August 27, 2018
Tuesday: Case-Shiller House Prices, Richmond Fed Mfg
by Calculated Risk on 8/27/2018 07:36:00 PM
From Matthew Graham at Mortgage News Daily: Mortgage Rates Higher (or Lower) Depending on Lender
Mortgage rates moved higher for some lenders and lower for others, depending on how that particular lender adjusted their rate sheets on Friday afternoon. … moves are relatively quite small in the bigger picture. On this scale, we're only talking about the upfront costs associated with any given rate as opposed to the actual payment ("note") rate itself. [30YR FIXED - 4.625% - 4.75%]Tuesday:
emphasis added
• At 9:00 AM ET, S&P/Case-Shiller House Price Index for June. The consensus is for a 6.5% year-over-year increase in the Comp 20 index for June.
• At 10:00 AM ET, Richmond Fed Survey of Manufacturing Activity for August. This is the last of the regional surveys for August.
Vehicle Sales Forecast: Sales Around 16.8 Million SAAR in August
by Calculated Risk on 8/27/2018 04:24:00 PM
The automakers will report August vehicle sales on Tuesday, September 4th.
Note: There were 27 selling days in August 2018, unchanged from 27 in August 2017.
From J.D. Power: Retail Sales Poised for Largest Gain of 2018; Spending Expected to Fall for Second Straight Month
New-vehicle retail sales in August are expected to rise from a year ago according to a forecast developed jointly by J.D. Power and LMC Automotive. Retail sales are projected to reach 1,280,400 units, a 1.3% increase compared with August 2017. [16.8 million SAAR] (Note: August 2018 has the same number of selling days as last year.)It appears August will be another solid month for vehicle sales. Through July, sales were down slightly compared to the same period in 2017.
“With no large disruptions from storms this year, new vehicle sales in August are expected to see the largest gain of the year,” said Thomas King, Senior Vice President of the Data and Analytics Division at J.D. Power. “Last year, Hurricanes Harvey and Irma made landfall during the end of the month, affecting Labor Day sales events. Labor Day remains one of the most heavily shopped periods in the year, accounting for nearly 3% of annual sales, as consumers take advantage of discounts that extend through the first weekend of September.”
emphasis added
Last year, August was the weakest sales month of the year at 16.45 million SAAR, due to the impact of the hurricanes. Following the hurricanes, sales were strong through the end of the year in 2017 as hurricane victims replaced cars damaged during the storms. So, even though sales will be up YoY in August, sales will probably down YoY for the last four months of the year.
Housing Inventory Tracking
by Calculated Risk on 8/27/2018 01:34:00 PM
Update: Watching existing home "for sale" inventory is very helpful. As an example, the increase in inventory in late 2005 helped me call the top for housing.
And the decrease in inventory eventually helped me correctly call the bottom for house prices in early 2012, see: The Housing Bottom is Here.
And in 2015, it appeared the inventory build in several markets was ending, and that boosted price increases.
I don't have a crystal ball, but watching inventory helps understand the housing market.
Inventory, on a national basis, was unchanged year-over-year (YoY) in July, this followed 37 consecutive months with a YoY decline.
The graph below shows the YoY change for non-contingent inventory in Houston, Las Vegas, Sacramento and also Phoenix (through July) and total existing home inventory as reported by the NAR (through July 2018).
 Click on graph for larger image.
This shows the YoY change in inventory for Houston, Las Vegas, Phoenix, and Sacramento. The black line is the year-over-year change in inventory as reported by the NAR.
Note that inventory in Sacramento was up 20% year-over-year in July (inventory was still very low), and has increased YoY for ten consecutive months.
Also note that inventory was up slightly YoY in Las Vegas in July (red), the first YoY increase in Las Vegas since May 2015.
Houston is a special case, and inventory was up for several years due to lower oil prices, but declined YoY recently as oil prices increased.
Inventory is a key for the housing market, and I will be watching inventory for the impact of the new tax law and higher mortgage rates on housing. I expect national inventory will be up YoY at the end of 2018 (but still be low).
This is not comparable to late 2005 when inventory increased sharply signaling the end of the housing bubble, but it does appear that inventory is bottoming nationally.
Dallas Fed: "Robust Expansion in Texas Manufacturing Continues"
by Calculated Risk on 8/27/2018 11:19:00 AM
From the Dallas Fed: Robust Expansion in Texas Manufacturing Continues
exas factory activity maintained its strong momentum in August, according to business executives responding to the Texas Manufacturing Outlook Survey. The production index, a key measure of state manufacturing conditions, held steady at 29.3.The regional surveys for August have mostly indicated somewhat slower growth as compared to July. The last of the regional surveys (Richmond Fed) for August will be released tomorrow.
Other indexes of manufacturing activity also indicated continued solid expansion in August. The new orders index changed little at 23.9, while the growth rate of orders index moved up three points to 19.9. The capacity utilization index was unchanged at 25.2, and the shipments index slipped five points to 26.0.
Perceptions of broader business conditions remained highly positive this month, although uncertainty remained elevated. The general business activity index edged down to 30.9, while the company outlook index rose seven points to 27.3, with more than 30 percent of manufacturers saying their outlook had improved from July. The index measuring uncertainty regarding companies’ outlooks held fairly steady in August at 16.2, well above its readings in the first half of the year.
Labor market measures continued to suggest robust hiring and longer work hours. The employment index remained at a 13-year high of 28.9. Thirty-four percent of firms noted net hiring, compared with 5 percent noting net layoffs. The hours worked index edged down to 19.0.
emphasis added
Chicago Fed "Index points to a moderation in economic growth in July"
by Calculated Risk on 8/27/2018 08:37:00 AM
From the Chicago Fed: Index points to a moderation in economic growth in July
Led by slower growth in production-related indicators, the Chicago Fed National Activity Index (CFNAI) declined to +0.13 in July from +0.48 in June. Three of the four broad categories of indicators that make up the index decreased from June, but three of the four categories made positive contributions to the index in July. The index’s three-month moving average, CFNAI-MA3, moved down to +0.05 in July from +0.20 in June.This graph shows the Chicago Fed National Activity Index (three month moving average) since 1967.
emphasis added
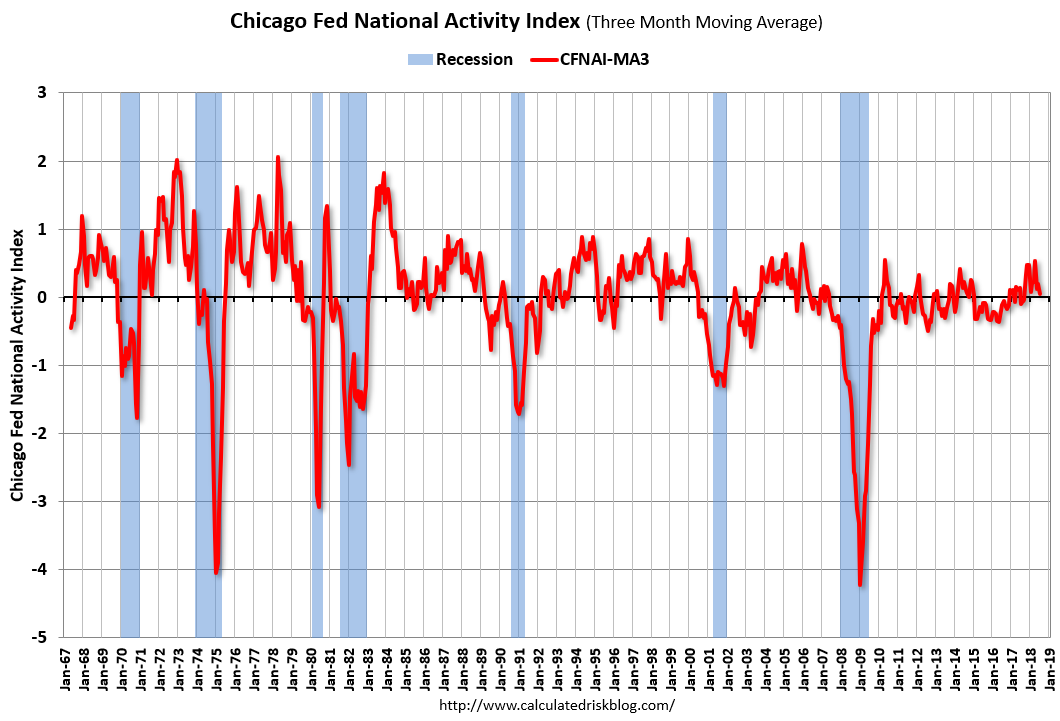 Click on graph for larger image.
This suggests economic activity was close to the historical trend in July (using the three-month average).
According to the Chicago Fed:
The index is a weighted average of 85 indicators of growth in national economic activity drawn from four broad categories of data: 1) production and income; 2) employment, unemployment, and hours; 3) personal consumption and housing; and 4) sales, orders, and inventories.
...
A zero value for the monthly index has been associated with the national economy expanding at its historical trend (average) rate of growth; negative values with below-average growth (in standard deviation units); and positive values with above-average growth.


