 RSS Feed
 by Calculated Risk on 4/06/2018 08:43:00 AM
Friday, April 06, 2018
March Employment Report: 103,000 Jobs Added, 4.1% Unemployment Rate
From the BLS:
Total nonfarm payroll employment edged up by 103,000 in March, and the unemployment rate was unchanged at 4.1 percent, the U.S. Bureau of Labor Statistics reported today. Employment increased in manufacturing, health care, and mining.
...
The change in total nonfarm payroll employment for January was revised down from +239,000 to +176,000, and the change for February was revised up from +313,000 to +326,000. With these revisions, employment gains in January and February combined were 50,000 less than previously reported.
...
In March, average hourly earnings for all employees on private nonfarm payrolls rose by 8 cents to $26.82. Over the year, average hourly earnings have increased by 71 cents, or 2.7 percent.
emphasis added
 Click on graph for larger image.
The first graph shows the monthly change in payroll jobs, ex-Census (meaning the impact of the decennial Census temporary hires and layoffs is removed - mostly in 2010 - to show the underlying payroll changes).
Total payrolls increased by 103 thousand in March (private payrolls increased 102 thousand).
Payrolls for January and February were revised down by a combined 50 thousand.
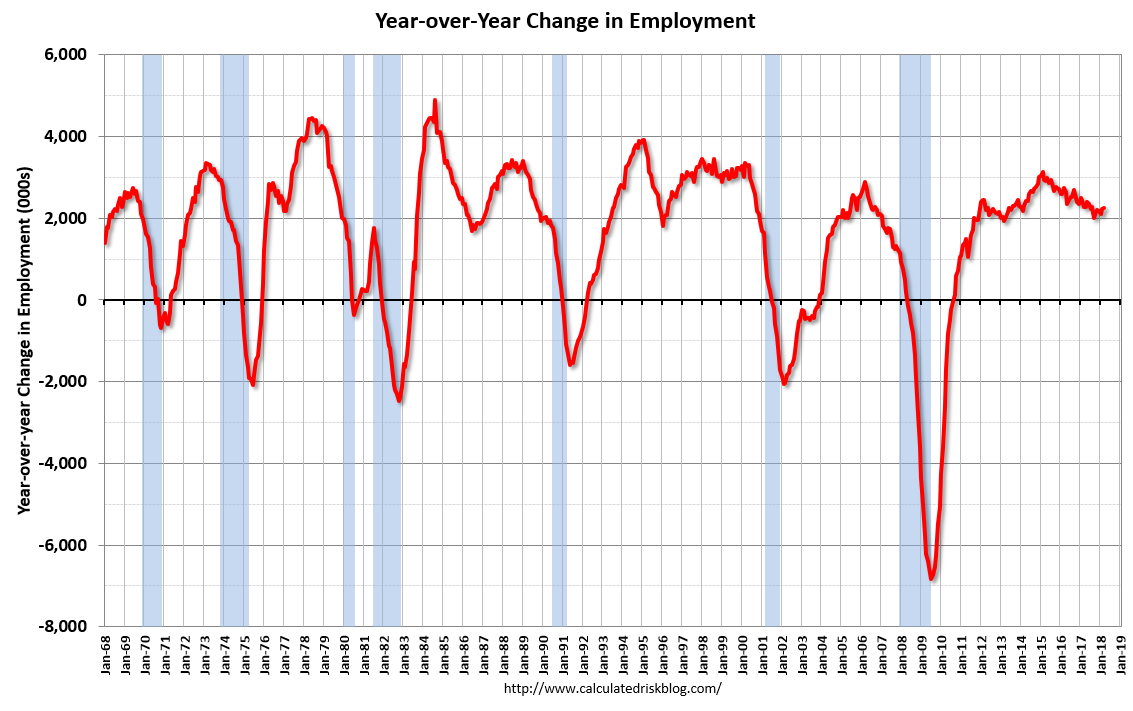 This graph shows the year-over-year change in total non-farm employment since 1968.
In March the year-over-year change was 2.261 million jobs.
The third graph shows the employment population ratio and the participation rate.
 The Labor Force Participation Rate was decreased in March to 62.9%. This is the percentage of the working age population in the labor force. A large portion of the recent decline in the participation rate is due to demographics.
 The Employment-Population ratio was unchanged at 60.4% (black line).
I'll post the 25 to 54 age group employment-population ratio graph later.
 The fourth graph shows the unemployment rate.
 The unemployment rate was unchanged in March at 4.1%.
This was well below the consensus expectations of 175,000 jobs, and the previous two months combined were revised down by 50,000.
I'll have much more later ...
Las Vegas Real Estate in March: Sales Down Slightly YoY, Inventory down 26%
by Calculated Risk on 4/06/2018 08:00:00 AM
This is a key distressed market to follow since Las Vegas saw the largest price decline, following the housing bubble, of any of the Case-Shiller composite 20 cities.
The Greater Las Vegas Association of Realtors reported Southern Nevada home prices continue to bloom heading into spring season; GLVAR housing statistics for March 2018
Local home prices rose again in March while the local housing supply stayed tight, according to a report released today by the Greater Las Vegas Association of REALTORS® (GLVAR).1) Overall sales were down slightly year-over-year from 3,903 in March 2017 to 3,886 in March 2018.
...
The total number of existing local homes, condos and townhomes sold during March was 3,886. Compared to one year ago, March sales were down 1.3 percent for homes, but up 3.7 percent for condos and townhomes.
By the end of March, GLVAR reported 3,835 single-family homes listed for sale without any sort of offer. That’s down 30.1 percent from one year ago. For condos and townhomes, the 761 properties listed without offers in March represented a 6.4 percent increase from one year ago.
Southern Nevada still has less than a two-month supply of existing homes available for sale when a six-month supply is considered a balanced market.
“We still need more homes to sell,” Bishop said. “But at least our inventory didn’t shrink any further between February and March.”
...
Meanwhile, the number of so-called distressed sales continues to decline. GLVAR reported that short sales and foreclosures combined accounted for 2.9 percent of all existing local home sales in March, compared to 9.8 percent of all sales one year ago.
emphasis added
2) Active inventory (single-family and condos) is down sharply from a year ago, from a total of 6,203 in March 2017 to 4,596 in March 2018. Note: Total inventory was down 26% year-over-year - a large decline - but the smallest year-over-year decline in inventory since 2016.
3) Fewer distressed sales.
Thursday, April 05, 2018
Friday: Employment Report, Speech by Fed Chair Jerome Powell
by Calculated Risk on 4/05/2018 06:56:00 PM
On the impact of weather from Chicago Fed economist Francois Gourio
"Updated weather effect estimates - weather should lower NFP in March by 60K according to our preferred model - a payback from unusually warm February"My March Employment Preview
Goldman: March Payrolls Preview
Friday:
• At 8:30 AM ET, Employment Report for March. The consensus is for an increase of 175,000 non-farm payroll jobs added in March, down from the 313,000 non-farm payroll jobs added in February. The consensus is for the unemployment rate to decrease to 4.0%.
• At 1:30 PM, Speech by Fed Chair Jerome Powell, Economic Outlook, Watch Live on YouTube, At the Economic Club of Chicago, Chicago, Illinois
• At 3:00 PM, Consumer Credit from the Federal Reserve. The consensus is for consumer credit to increase $15.0 billion in February.
Goldman: March Payrolls Preview
by Calculated Risk on 4/05/2018 02:34:00 PM
A few brief excerpts from a note by Goldman Sachs economist Spencer Hill:
We estimate that nonfarm payrolls increased 200k in March, 15k above consensus. While we believe elevated snowfall will cause job growth to decelerate from the +276k average pace in the prior two months, labor market fundamentals remain solid and appear to have improved further.
...
we estimate the unemployment rate fell to 4.0% in March. ... We estimate a 0.3% month-over-month increase in average hourly earnings (and 2.7% year-on-year), reflecting somewhat favorable calendar effects. ...
emphasis added
March Employment Preview
by Calculated Risk on 4/05/2018 11:12:00 AM
On Friday at 8:30 AM ET, the BLS will release the employment report for March. The consensus, according to Bloomberg, is for an increase of 175,000 non-farm payroll jobs in March (with a range of estimates between 112,000 to 225,000), and for the unemployment rate to decline to 4.0%.
The BLS reported 313,000 jobs added in February.
Note on Weather: Most estimates show that warmer than normal weather boosted February employment by 80,000 to 90,000 jobs, and there should be some payback in the March report.
Here is a summary of recent data:
• The ADP employment report showed an increase of 241,000 private sector payroll jobs in March. This was well above consensus expectations of 180,000 private sector payroll jobs added. The ADP report hasn't been very useful in predicting the BLS report for any one month, but in general, this suggests employment growth above expectations.
• The ISM manufacturing employment index decreased in March to 57.3%. A historical correlation between the ISM manufacturing employment index and the BLS employment report for manufacturing, suggests that private sector BLS manufacturing payroll increased about 20,000 in March. The ADP report indicated manufacturing jobs increased 29,000 in March.
The ISM non-manufacturing employment index increased in March to 56.6%. A historical correlation between the ISM non-manufacturing employment index and the BLS employment report for non-manufacturing, suggests that private sector BLS non-manufacturing payroll jobs increased about 250,000 in March.
Combined, the ISM indexes suggests employment gains of about 270,000. This suggests employment growth above expectations.
• Initial weekly unemployment claims averaged 228,000 in March, up from 224,000 in February. For the BLS reference week (includes the 12th of the month), initial claims were at 227,000, up from 220,000 during the reference week in February.
The slight increase during the reference week suggests a weaker employment report in March than in February.
• The final March University of Michigan consumer sentiment index increased to 101.4 from the February reading of 99.7. Sentiment is frequently coincident with changes in the labor market, but there are other factors too like gasoline prices and politics.
• Merrill Lynch has introduced a new payrolls tracker based on private internal BAC data. The tracker suggests private payrolls increased by 223,000 in March, and this suggests employment growth above expectations.
• Conclusion: In general, these reports suggest a solid employment report. However, there should be some payback from the weather boost in February. My guess is that the employment report will be below the consensus in March.
Trade Deficit at $57.6 Billion in February
by Calculated Risk on 4/05/2018 08:49:00 AM
From the Department of Commerce reported:
The U.S. Census Bureau and the U.S. Bureau of Economic Analysis announced today that the goods and services deficit was $57.6 billion in February, up $0.9 billion from $56.7 billion in January, revised. ... February exports were $204.4 billion, $3.5 billion more than January exports. February imports were $262.0 billion, $4.4 billion more than January imports.
 Click on graph for larger image.
Both exports and imports increased in February.
Exports are 24% above the pre-recession peak and up 7% compared to February 2017; imports are 13% above the pre-recession peak, and up 11% compared to February 2017.
In general, trade has been picking up.
The second graph shows the U.S. trade deficit, with and without petroleum.
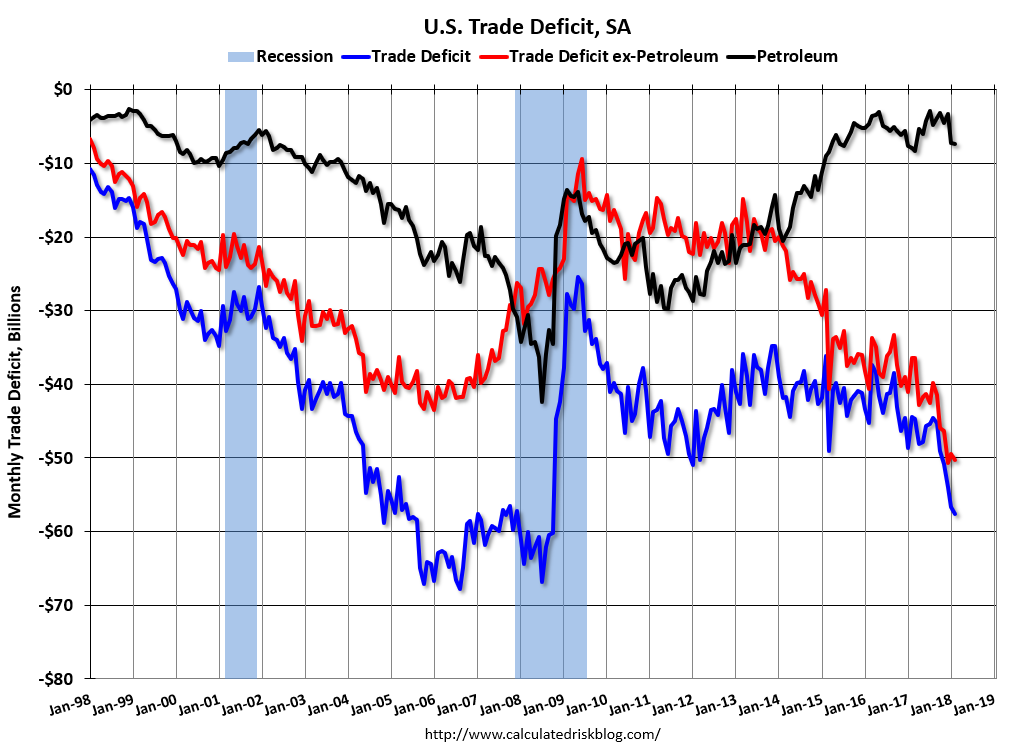 The blue line is the total deficit, and the black line is the petroleum deficit, and the red line is the trade deficit ex-petroleum products.
Oil imports averaged $54.61 in February, down slightly from $54.76 in January, and up from $45.25 in February 2017.
The petroleum deficit increased over the last two months, and this is the main reason the overall trade deficit increased in January and February.
The trade deficit with China increased to $29.3 billion in February, from $23.0 billion in February 2017. The trade deficit with China was boosted by the timing of the Chinese New Year this year.
Weekly Initial Unemployment Claims increase to 242,000
by Calculated Risk on 4/05/2018 08:33:00 AM
The DOL reported:
In the week ending March 31, the advance figure for seasonally adjusted initial claims was 242,000, an increase of 24,000 from the previous week's revised level. The previous week's level was revised up by 3,000 from 215,000 to 218,000. The 4-week moving average was 228,250, an increase of 3,000 from the previous week's revised average. The previous week's average was revised up by 750 from 224,500 to 225,250.The previous week was revised up.
Claims taking procedures in Puerto Rico and in the Virgin Islands have still not returned to normal.
emphasis added
The following graph shows the 4-week moving average of weekly claims since 1971.
 Click on graph for larger image.
The dashed line on the graph is the current 4-week average. The four-week average of weekly unemployment claims increased to 228,250.
This was higher than the consensus forecast. The low level of claims suggest relatively few layoffs.
Wednesday, April 04, 2018
Thursday: Unemployment Claims, Trade Deficit
by Calculated Risk on 4/04/2018 06:40:00 PM
From Matthew Graham at Mortgage News Daily: Mortgage Rates Still Solid Despite Warning Signs
Mortgage rates were sideways to slightly lower today, depending on the lender. ... If nothing changes about underlying markets by tomorrow morning, most lenders will likely be slightly worse off. Of course, "worse" is a relative term, because today's rates are in line with 2-month lows. On the other hand, the overall range has been very narrow over that 2-month time frame. [30YR FIXED - 4.5%]Thursday:
emphasis added
• At 8:30 AM ET, The initial weekly unemployment claims report will be released. The consensus is for 226 thousand initial claims, up from 215 thousand the previous week.
• Also at 8:30 AM, Trade Balance report for February from the Census Bureau. The consensus is for the U.S. trade deficit to be at $56.8 billion in February from $56.8 billion in January.
U.S. Heavy Truck Sales up Year-over-year in March
by Calculated Risk on 4/04/2018 03:28:00 PM
The following graph shows heavy truck sales since 1967 using data from the BEA. The dashed line is the March 2018 seasonally adjusted annual sales rate (SAAR).
Heavy truck sales really collapsed during the great recession, falling to a low of 181 thousand in April and May 2009, on a seasonally adjusted annual rate basis (SAAR). Then sales increased more than 2 1/2 times, and hit 480 thousand SAAR in June 2015.
Heavy truck sales declined again - probably mostly due to the weakness in the oil sector - and bottomed at 364 thousand SAAR in October 2016.

Click on graph for larger image.
With the increase in oil prices over the last year, heavy truck sales increased too.
Heavy truck sales were at 455 thousand SAAR in March, down from 475 thousand in February, and up from 391 thousand in March 2017.
Annual Vehicle Sales: On Pace to be Unchanged in 2018
by Calculated Risk on 4/04/2018 12:17:00 PM
Through March, light vehicle sales are on pace to be unchanged in 2018 compared to 2017.
This would still make 2018 tied with 2017 for the fourth best year on record after 2016, 2015, and 2000.
My guess is vehicle sales will finish the year with sales lower than in 2017. A small decline in sales this year isn't a concern - I think sales will move mostly sideways at near record levels (however there is concern about the impact of tariffs).
As I noted last year, this means the economic boost from increasing auto sales is over (from the bottom in 2009, auto sales boosted growth every year through 2016).

Click on graph for larger image.
This graph shows annual light vehicle sales since 1976. Source: BEA.
Sales for 2018 are estimated at the pace of the first three months.


