 RSS Feed
 by Calculated Risk on 3/01/2017 03:10:00 PM
Wednesday, March 01, 2017
U.S. Light Vehicle Sales at 17.5 million annual rate in February
Based on a preliminary estimate from WardsAuto, light vehicle sales were at a 17.47 million SAAR in February.
That is down about 1% from February 2016, and unchanged from last month.

Click on graph for larger image.
This graph shows the historical light vehicle sales from the BEA (blue) and an estimate for February (red, light vehicle sales of 17.47 million SAAR from WardsAuto).
This was below the consensus forecast of 17.7 million for February.
After two consecutive years of record sales, it looks like sales will mostly move sideways in 2017.
 The second graph shows light vehicle sales since the BEA started keeping data in 1967.
Note: dashed line is current estimated sales rate.
Fed's Beige Book: Modest to Moderate expansion, Tight labor markets
by Calculated Risk on 3/01/2017 02:09:00 PM
Fed's Beige Book "This report was prepared at the Federal Reserve Bank of New York based on information collected on or before February 17, 2017."
Reports from all twelve Federal Reserve Districts indicated that the economy expanded at a modest to moderate pace from early January through mid-February. ... Labor markets remained tight in early 2017, with some Districts noting widening labor shortages. Employment grew moderately in most of the nation, though three Districts characterized growth as modest and two reported that it was little changed. A number of Districts noted that staffing firms were seeing brisk business for this time of year, and one noted more conversions from temporary to permanent workers. In general, wages in most Districts rose modestly or moderately, with a few reporting some pickup in the pace of wage growth. A number of Districts noted that shortages of skilled workers--particularly engineers and IT workers--were driving up their wages, and there were also some reports of labor shortages in the leisure and hospitality, construction and manufacturing industries.And on real estate:
emphasis added
Home construction and sales continued to expand modestly in most Districts, while residential rental markets were mixed. Home prices were steady to up modestly in most Districts, and a number of Districts noted low inventories of existing homes. Commercial real estate construction grew modestly, and sales and leasing activity grew moderately. Lending activity was steady to somewhat higher.Note that residential rental markets "were mixed".
Construction Spending decreased in January
by Calculated Risk on 3/01/2017 12:20:00 PM
Earlier today, the Census Bureau reported that overall construction spending decreased in January:
Construction spending during January 2017 was estimated at a seasonally adjusted annual rate of $1,180.3 billion, 1.0 percent below the revised December estimate of $1,192.2 billion. The January figure is 3.1 percent above the January 2016 estimate of $1,144.9 billion.Private spending increased, however public spending decreased in January:
Spending on private construction was at a seasonally adjusted annual rate of $911.6 billion, 0.2 percent above the revised December estimate of $909.4 billion ...
In January, the estimated seasonally adjusted annual rate of public construction spending was $268.7 billion, 5.0 percent below the revised December estimate of $282.8 billion.
emphasis added
 Click on graph for larger image.
This graph shows private residential and nonresidential construction spending, and public spending, since 1993. Note: nominal dollars, not inflation adjusted.
Private residential spending has been generally increasing, and is still 30% below the bubble peak.
Non-residential spending is now 5% above the previous peak in January 2008 (nominal dollars).
Public construction spending is now 17% below the peak in March 2009, and only 2% above the austerity low in February 2014.
 The second graph shows the year-over-year change in construction spending.
On a year-over-year basis, private residential construction spending is up 6%. Non-residential spending is up 9% year-over-year. Public spending is down 9% year-over-year.
Looking forward, all categories of construction spending should increase in 2017.
This was below the consensus forecast of a 0.2% increase for January, however the previous months were revised up.
ISM Manufacturing index increased to 57.7 in February
by Calculated Risk on 3/01/2017 10:04:00 AM
The ISM manufacturing index indicated expansion in February. The PMI was at 57.7% in February, up from 56.0% in January. The employment index was at 54.2%, down from 56.1% last month, and the new orders index was at 65.1%, up from 60.4%.
From the Institute for Supply Management: February 2017 Manufacturing ISM® Report On Business®
Economic activity in the manufacturing sector expanded in February, and the overall economy grew for the 93rd consecutive month, say the nation’s supply executives in the latest Manufacturing ISM® Report On Business®.
The report was issued today by Bradley J. Holcomb, CPSM, CPSD, chair of the Institute for Supply Management® (ISM®) Manufacturing Business Survey Committee: “The February PMI® registered 57.7 percent, an increase of 1.7 percentage points from the January reading of 56 percent. The New Orders Index registered 65.1 percent, an increase of 4.7 percentage points from the January reading of 60.4 percent. The Production Index registered 62.9 percent, 1.5 percentage points higher than the January reading of 61.4 percent. The Employment Index registered 54.2 percent, a decrease of 1.9 percentage points from the January reading of 56.1 percent. Inventories of raw materials registered 51.5 percent, an increase of 3 percentage points from the January reading of 48.5 percent. The Prices Index registered 68 percent in February, a decrease of 1 percentage point from the January reading of 69 percent, indicating higher raw materials prices for the 12th consecutive month. Comments from the panel largely indicate strong sales and demand, and reflect a positive view of business conditions with a watchful eye on commodities and the potential for inflation.”
emphasis added
 Click on graph for larger image.
Here is a long term graph of the ISM manufacturing index.
This was above expectations of 56.1%, and suggests manufacturing expanded at as faster pace in February than in January.
Another solid report.
Personal Income increased 0.4% in January, Spending increased 0.2%
by Calculated Risk on 3/01/2017 09:02:00 AM
The BEA released the Personal Income and Outlays report for January:
Personal income increased $63.0 billion (0.4 percent) in January according to estimates released today by the Bureau of Economic Analysis ... personal consumption expenditures (PCE) increased $22.2 billion (0.2 percent).The January PCE price index increased 1.9 percent year-over-year (compared to 1.6 percent YoY in December) and the January PCE price index, excluding food and energy, increased 1.7 percent year-over-year (same as in December).
...
Real PCE decreased 0.3 percent. The PCE price index increased 0.4 percent. Excluding food and energy, the PCE price index increased 0.3 percent.
The following graph shows real Personal Consumption Expenditures (PCE) through January 2017 (2009 dollars). Note that the y-axis doesn't start at zero to better show the change.
 Click on graph for larger image.
The dashed red lines are the quarterly levels for real PCE.
The increase in personal income was above consensus, and the increase in PCE was below consensus expectations.
MBA: Mortgage Applications Increase in Latest Weekly Survey
by Calculated Risk on 3/01/2017 07:00:00 AM
From the MBA: Mortgage Applications Increase in Latest MBA Weekly Survey
Mortgage applications increased 5.8 percent from one week earlier, according to data from the Mortgage Bankers Association’s (MBA) Weekly Mortgage Applications Survey for the week ending February 24, 2017. This week’s results included an adjustment for the Presidents’ Day holiday.
... The Refinance Index increased 5 percent from the previous week to its highest level since December 2016. The seasonally adjusted Purchase Index increased 7 percent from one week earlier. The unadjusted Purchase Index decreased 1 percent compared with the previous week and was 5 percent lower than the same week one year ago, which did not include the Presidents’ Day holiday.
...
The average contract interest rate for 30-year fixed-rate mortgages with conforming loan balances ($424,100 or less) decreased to 4.30 percent from 4.36 percent, with points increasing to 0.38 from 0.35 (including the origination fee) for 80 percent loan-to-value ratio (LTV) loans.
emphasis added
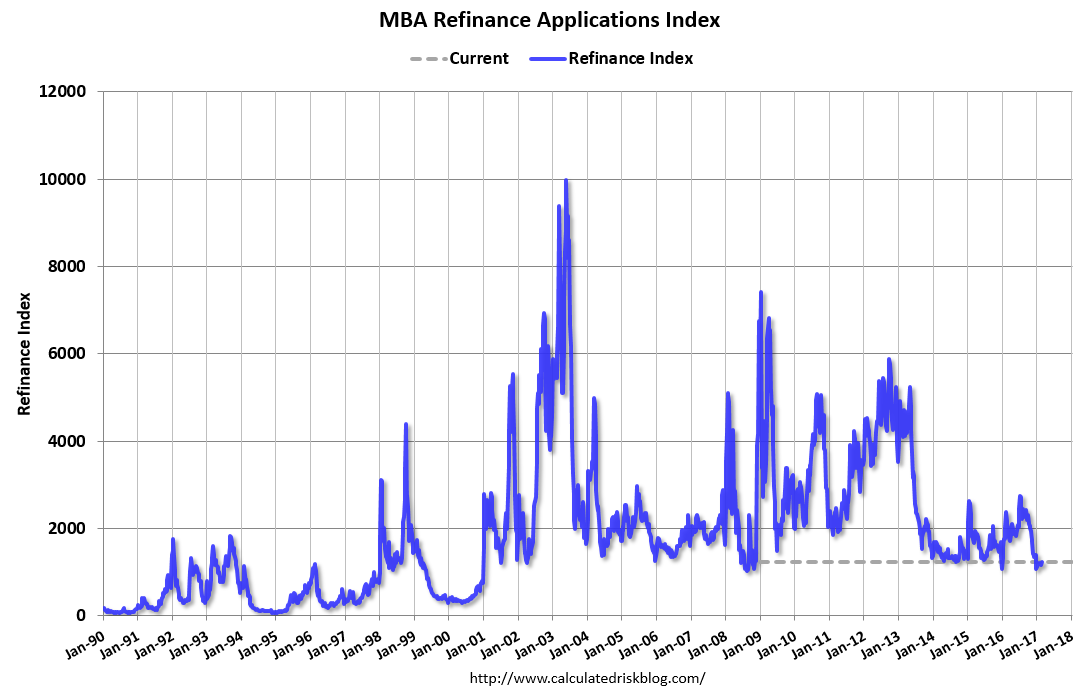 Click on graph for larger image.
The first graph shows the refinance index since 1990.
It would take a substantial decrease in mortgage rates to see a significant increase in refinance activity.
 The second graph shows the MBA mortgage purchase index.
 Even with the recent increase in mortgage rates, purchase activity is still holding up.
However refinance activity has declined significantly since rates increased.
Tuesday, February 28, 2017
Wednesday: Personal Income and Outlays, Auto Sales, ISM Mfg Survey, Construction Spending, Beige Book
by Calculated Risk on 2/28/2017 08:11:00 PM
Wednesday:
• At 7:00 AM ET, The Mortgage Bankers Association (MBA) will release the results for the mortgage purchase applications index.
• All day, Light vehicle sales for February. The consensus is for light vehicle sales to increase to 17.7 million SAAR in February, from 17.5 million in January (Seasonally Adjusted Annual Rate).
• At 8:30 AM, Personal Income and Outlays for January. The consensus is for a 0.3% increase in personal income, and for a 0.3% increase in personal spending. And for the Core PCE price index to increase 0.2%.
• At 10:00 AM, ISM Manufacturing Index for February. The consensus is for the ISM to be at 56.1, up from 54.7 in December.
• Also at 10:00 AM, Construction Spending for January. The consensus is for a 0.2% increase in construction spending.
• At 2:00 PM, the Federal Reserve Beige Book, an informal review by the Federal Reserve Banks of current economic conditions in their Districts.
Freddie Mac: Mortgage Serious Delinquency rate falls below 1.0% in January, Lowest since June 2008
by Calculated Risk on 2/28/2017 05:31:00 PM
Freddie Mac reported that the Single-Family serious delinquency rate in January was at 0.99%, down from 1.00% in December. Freddie's rate is down from 1.33% in January 2016.
Freddie's serious delinquency rate peaked in February 2010 at 4.20%.
This is the lowest serious delinquency rate since June 2008.
These are mortgage loans that are "three monthly payments or more past due or in foreclosure".
 Click on graph for larger image
Although the rate is declining, the "normal" serious delinquency rate is under 1%.
Maybe the rate will decline another 0.25 percentage points or so to a cycle bottom, but this is pretty close to normal.
Note: Fannie Mae will report soon.
FDIC: Fewer Problem banks, Residential REO Declined in Q4
by Calculated Risk on 2/28/2017 03:48:00 PM
The FDIC released the Quarterly Banking Profile for Q4 today:
Commercial banks and savings institutions insured by the Federal Deposit Insurance Corporation (FDIC) reported aggregate net income of $43.7 billion in the fourth quarter of 2016, up $3.1 billion (7.7 percent) from a year earlier. The increase in earnings was mainly attributable to an $8.4 billion (7.6 percent) increase in net interest income. Financial results for the fourth quarter of 2016 are included in the FDIC's latest Quarterly Banking Profile released today.
Of the 5,913 insured institutions reporting fourth quarter financial results, 59 percent reported year-over-year growth in quarterly earnings. The proportion of banks that were unprofitable in the fourth quarter fell to 8.1 percent from 9.6 percent a year earlier.
...
Deposit Insurance Fund’s Reserve Ratio Rises to 1.20 Percent: The DIF increased $2.5 billion during the fourth quarter to $83.2 billion at the end of December, largely driven by assessment income. The DIF reserve ratio rose from 1.18 percent to 1.20 percent during the quarter. Estimated insured deposits increased 1.4 percent in the fourth quarter. For all of 2016, estimated insured deposits increased 6 percent.
emphasis added
 Click on graph for larger image.
The FDIC reported the number of problem banks declined:
“Problem Bank List” Shows Further Improvement: The number of banks on the FDIC’s Problem Bank List fell from 132 to 123 during the fourth quarter. This is the smallest number of problem banks in more than seven years and is down significantly from the peak of 888 in the first quarter of 2011. Total assets of problem banks rose slightly from $24.9 billion to $27.6 billion during the fourth quarter.
 The dollar value of 1-4 family residential Real Estate Owned (REOs, foreclosure houses) declined from $3.98 billion in Q3 2016 to $3.90 billion in Q4. This is the lowest level of REOs since Q1 2007.
This graph shows the nominal dollar value of Residential REO for FDIC insured institutions. Note: The FDIC reports the dollar value and not the total number of REOs.
Since REOs are reported in dollars, and house prices have increased, it is unlikely FDIC institution REOs will get back to the $2.0 to $2.5 billion range back that happened in 2003 to 2005. FDIC REOs will probably bottom closer to $3 billion.
Real House Prices and Price-to-Rent Ratio in December
by Calculated Risk on 2/28/2017 01:14:00 PM
Here is the earlier post on Case-Shiller: Case-Shiller: National House Price Index increased 5.8% year-over-year in December
It has been more than ten years since the bubble peak. In the Case-Shiller release this morning, the seasonally adjusted National Index (SA), was reported as being 1.4% above the previous bubble peak. However, in real terms, the National index (SA) is still about 14.5% below the bubble peak.
The year-over-year increase in prices is mostly moving sideways now just over 5%. In December, the index was up 5.8% YoY.
In the earlier post, I graphed nominal house prices, but it is also important to look at prices in real terms (inflation adjusted). Case-Shiller, CoreLogic and others report nominal house prices. As an example, if a house price was $200,000 in January 2000, the price would be close to $278,000 today adjusted for inflation (38.9%). That is why the second graph below is important - this shows "real" prices (adjusted for inflation).
Nominal House Prices
 The first graph shows the monthly Case-Shiller National Index SA, the monthly Case-Shiller Composite 20 SA, and the CoreLogic House Price Indexes (through November) in nominal terms as reported.
In nominal terms, the Case-Shiller National index (SA) is at a new peak, and the Case-Shiller Composite 20 Index (SA) is back to August 2005 levels, and the CoreLogic index (NSA) is back to September 2005.
Real House Prices
 The second graph shows the same three indexes in real terms (adjusted for inflation using CPI less Shelter). Note: some people use other inflation measures to adjust for real prices.
In real terms, the National index is back to April 2004 levels, the Composite 20 index is back to December 2003, and the CoreLogic index back to March 2004.
In real terms, house prices are back to late 2003 / early 2004 levels.
Price-to-Rent
In October 2004, Fed economist John Krainer and researcher Chishen Wei wrote a Fed letter on price to rent ratios: House Prices and Fundamental Value. Kainer and Wei presented a price-to-rent ratio using the OFHEO house price index and the Owners' Equivalent Rent (OER) from the BLS.
 Here is a similar graph using the Case-Shiller National, Composite 20 and CoreLogic House Price Indexes.
This graph shows the price to rent ratio (January 1998 = 1.0).
On a price-to-rent basis, the Case-Shiller National index is back to October 2003 levels, the Composite 20 index is back to July 2003 levels, and the CoreLogic index is back to July 2003.
In real terms, and as a price-to-rent ratio, prices are back to late 2003 / early 2004 - and the price-to-rent ratio maybe moving a little more sideways now.


