 RSS Feed
 by Calculated Risk on 11/16/2015 10:05:00 AM
Monday, November 16, 2015
HUD: FHA'S 2015 Annual Report Shows Capital Reserves Now Exceed 2%, First Time Since 2008
From HUD: FHA'S 2015 ANNUAL REPORT SHOWS CAPITAL RESERVES NOW EXCEED 2%
The U.S. Department of Housing and Urban Development (HUD) today released its annual report to Congress on the financial condition of the Federal Housing Administration’s Mutual Mortgage Insurance (MMI) Fund. The independent actuarial analysis shows the MMI Fund’s capital ratio stands at 2.07 percent—the first time since 2008 that FHA’s reserve ratio exceeded the congressionally required 2 percent threshold. The economic value of the MMI Fund gained $19 billion in Fiscal Year 2015, driven by strong actions to reduce risk, cut losses and improve recoveries.From the report:
This is the third consecutive year of economic growth for the MMI Fund, allowing FHA to expand credit access to qualified borrowers even as the broader housing market continues to recover. FHA’s annual report also notes a significant increase in loan volume during FY 2015, due largely to a reduction in annual mortgage insurance premium prices announced in January. Read a comprehensive summary of the report released today.
“FHA is on solid financial footing and positioned to continue playing its vital role in assisting future generations of homeowners,” said HUD Secretary Julián Castro. “We’ve taken a number of steps to strengthen the Fund and increase credit access to responsible borrowers. Today’s report demonstrates that we struck the right balance in responsibly growing the Fund, reducing premiums, and doing what FHA was born to do – allowing hardworking Americans to become homeowners and spurring growth in the housing market as well as the broader economy.”
 Click on graph for larger image.
The quality of new business is reflected by early payment delinquencies (EPD) rates. The EPD rate is the rate at which loans experience 90-day delinquencies within the first six months of origination, another metric that suggests the sustainability of the recovery in the Forward portfolio. EPD rates provide the first indication of potential credit performance of newly insured loans and are a leading indicator of the long-term claim risk of a particular book of business.
The EPD performance of FHA’s portfolio in FY 2015 continued trends seen in recent years, as newer books of business vastly outperform those insured in prior years. EPD rates for the FY 2010 through February 2015 vintages are less than 20 percent of the EPD rates for the FY 2007 and 2008 vintages (Exhibit II-7).

The number of seriously delinquent FHA loans (loans that are 90 or more days past due) continued to decline in FY 2015. Exhibit II-8 shows the serious delinquency rate has fallen by 35 percent over the last four years, a nearly $35 billion improvement in the size of the seriously delinquent portfolio over that time.
NY Fed: Manufacturing Activity Declined in November
by Calculated Risk on 11/16/2015 08:41:00 AM
From the NY Fed: Empire State Manufacturing Survey
Business activity declined for a fourth consecutive month for New York manufacturers, according to the November 2015 survey. The general business conditions index was little changed at -10.7.This is the first regional survey for November, and manufacturing contracted further in the NY region. This was well below the consensus forecast of a reading of -5.0.
...
Labor market conditions continued to weaken. The index for number of employees was little changed at -7.3, a sign that employment levels fell for a third consecutive month, and the average workweek index moved down seven points to -14.6, its lowest level since mid-2011.
...
Indexes for the six-month outlook were little changed from last month, and suggested that optimism about future business conditions remained muted.
emphasis added
Sunday, November 15, 2015
Sunday Night Futures
by Calculated Risk on 11/15/2015 06:22:00 PM
From the LA Times: El Niño 'is here, and it is huge,' as officials race to prep for winter
El Niño continues to gain strength in the Pacific Ocean, climate experts said, with unusually wet conditions expected to hit California between January and March -- and perhaps into May.It will probably be a crazy winter. Goldman Sachs thinks El Niño will provide a small economic boost: El Niño: A Potential Small Boost to Growth This Winter
The El Niño climatological event that began this spring is currently on track to be one of the five strongest episodes since 1950. ... we assess the implications for the US economy.Monday:
Weather conditions have varied widely during previous major El Niño events, and considerable uncertainty remains about this winter’s conditions. On average, the US has had about 1 standard deviation more precipitation and fewer heating degree days (warmer weather) during El Niño winters, with the South generally wetter and the North generally warmer.
If weather this winter is in line with conditions during the average major El Niño, we would expect warmer temperatures to boost growth by about 0.2pp during Q1. On the inflation side, while food prices have been somewhat higher and energy prices somewhat lower during El Niño winters, we would not expect a significant impact on core inflation.
• At 8:30 AM ET, the NY Fed Empire State Manufacturing Survey for November. The consensus is for a reading of -5.0, up from -11.4.
Weekend:
• Schedule for Week of November 15, 2015
From CNBC: Pre-Market Data and Bloomberg futures: currently S&P futures are down 16 and DOW futures are down 119 (fair value).
Oil prices were down over the last week with WTI futures at $40.74 per barrel and Brent at $44.47 per barrel. A year ago, WTI was at $75, and Brent was at $77 - so prices are down about 40% year-over-year (It was a year ago that prices were falling sharply).
Here is a graph from Gasbuddy.com for nationwide gasoline prices. Nationally prices are at $2.15 per gallon (down about $0.75 per gallon from a year ago).
LA area Port Traffic declined in October
by Calculated Risk on 11/15/2015 09:33:00 AM
First, from the WSJ: Quiet U.S. Ports Spark Slowdown Fears
For the first time in at least a decade, imports fell in both September and October at each of the three busiest U.S. seaports, according to data from trade researcher Zepol Corp. analyzed by The Wall Street Journal. ...Note: There were some large swings in LA area port traffic earlier this year due to labor issues that were settled in late February. Port traffic surged in March as the waiting ships were unloaded (the trade deficit increased in March too), and port traffic declined in April.
...
The declines came during a stretch from late summer to early fall known in the transportation world as peak shipping season, when cargo volumes typically surge through U.S. ports. It is a crucial few months for the U.S. economy as well: High import volumes can signal a confident view on the economy among retailers and manufacturers, while fears of a slowdown grow when ports are quiet.
Container traffic gives us an idea about the volume of goods being exported and imported - and usually some hints about the trade report since LA area ports handle about 40% of the nation's container port traffic.
The following graphs are for inbound and outbound traffic at the ports of Los Angeles and Long Beach in TEUs (TEUs: 20-foot equivalent units or 20-foot-long cargo container).
To remove the strong seasonal component for inbound traffic, the first graph shows the rolling 12 month average.
 Click on graph for larger image.
On a rolling 12 month basis, inbound traffic was down 0.2% compared to the rolling 12 months ending in October. Outbound traffic was down 0.5% compared to 12 months ending in October.
The recent downturn in exports might be due to the strong dollar and weakness in China.
For imports, August was the all time inbound record, so some of September and October traffic probably arrived in August.
The 2nd graph is the monthly data (with a strong seasonal pattern for imports).
 Usually imports peak in the July to October period as retailers import goods for the Christmas holiday, and then decline sharply and bottom in February or March (depending on the timing of the Chinese New Year).
 Imports were down 2% year-over-year in October; exports were down 6% year-over-year.
For the July through October peak period, imports were up 2.1% year-over-year - not the weakness described in the WSJ article (although the WSJ article included New York harbor).
Saturday, November 14, 2015
Schedule for Week of November 15th
by Calculated Risk on 11/14/2015 08:11:00 AM
The key economic reports this week is October housing starts on Wednesday.
For prices, CPI will be released on Tuesday.
For manufacturing, October Industrial Production will be released on Tuesday, and the November New York, Philly, and Kansas City Fed manufacturing surveys will be released this week.
A key focus will be on the FOMC minutes on Wednesday.
8:30 AM: NY Fed Empire State Manufacturing Survey for November. The consensus is for a reading of -5.0, up from -11.4.
8:30 AM: The Consumer Price Index for October from the BLS. The consensus is for a 0.2% increase in CPI, and a 0.2% increase in core CPI.
 9:15 AM: The Fed will release Industrial Production and Capacity Utilization for October.
This graph shows industrial production since 1967.
The consensus is for a 0.1% increase in Industrial Production, and for Capacity Utilization to be unchanged at 77.5%.
10:00 AM: The November NAHB homebuilder survey. The consensus is for a reading of 64, unchanged from October. Any number above 50 indicates that more builders view sales conditions as good than poor.
10:00 AM: The Mortgage Bankers Association (MBA) Q3 2015 National Delinquency Survey (NDS).
7:00 AM ET: The Mortgage Bankers Association (MBA) will release the results for the mortgage purchase applications index.
 8:30 AM: Housing Starts for October.
 Total housing starts increased to 1.206 million (SAAR) in September. Single family starts increased to 740 thousand SAAR in September.
The consensus for 1.162 million, down from September.
During the day: The AIA's Architecture Billings Index for October (a leading indicator for commercial real estate).
2:00 PM: The Fed will release the FOMC Minutes for the Meeting of October 27-28, 2015
8:30 AM: The initial weekly unemployment claims report will be released. The consensus is for 270 thousand initial claims, down from 276 thousand the previous week.
10:00 AM: the Philly Fed manufacturing survey for November. The consensus is for a reading of 0.0, up from -4.5.
10:00 AM ET: Regional and State Employment and Unemployment for October.
11:00 AM: the Kansas City Fed manufacturing survey for November.
Friday, November 13, 2015
Goldman: Decline in Oil Prices boosted GDP by 0.2% in 2015
by Calculated Risk on 11/13/2015 08:35:00 PM
A few excerpts from a Goldman Sachs research piece by economist Daan Struyven: Shale, States and the Shrinking Oil Stimulus
Crude oil prices are down more than 50% from their level in mid-2014. As oil prices declined, many observers—ourselves included—expected substantial positive effects from cheaper oil on US growth. But 18 months later, the size of the stimulus—and how much might be left in the tank—remains a source of debate.
The energy profile of the US has changed substantially over the past decade. The US is now more self-reliant because of the fracking revolution, and energy investment plays an increasingly important role in the economy.
We revisit the impact of cheaper oil on GDP growth and payrolls using a disaggregated view in this week’s Analyst. Specifically, we exploit the fact that oil-producing states lose from price declines while oil-consuming states gain. The differential effects across states can therefore help uncover the economy-wide impact of oil shocks.
Our state-level analysis suggests that a 50% decline in oil prices is associated with an eventual rise in aggregate output of 0.4% and 400,000 to 500,000 extra jobs. These estimates are broadly consistent with our most recent research, but below the impact implied by many earlier studies. Taking together our new state-level estimates as well as our earlier work and a few back-of-the-envelope calculations, our best estimate would be that cheaper oil has boosted GDP growth in 2015 by 0.2 pp. Looking ahead, we think that about 0.1 pp of oil growth stimulus is left in the tank, which should lift growth over the next 18 months.
Hotels: RevPAR up 35% over the last 6 years
by Calculated Risk on 11/13/2015 02:12:00 PM
RevPAR (revenue per available room) was $80.23 last week. For the same week in 2009, RevPAR was $59.28. An increase of 35% in six years.
Here is weekly update on hotel occupancy from HotelNewsNow.com: STR: US results for week ending 7 November
The U.S. hotel industry recorded positive results in the three key performance measurements during the week of 1-7 November 2015, according to data from STR, Inc.The following graph shows the seasonal pattern for the hotel occupancy rate using the four week average. Hotels are now in the Fall business travel season.
In year-over-year measurements, the industry’s occupancy increased 0.2% to 66.4%. Average daily rate for the week was up 3.1% to US$120.73. Revenue per available room increased 3.3% to finish the week at US$80.23.
emphasis added
 The red line is for 2015, dashed orange is 2014, blue is the median, and black is for 2009 - the worst year since the Great Depression for hotels. Purple is for 2000.
I added 2001 (yellow) to show the impact of 9/11/2001 on hotel occupancy. Occupancy was already down in 2001 compared to 2000 due to the recession, and then really collapsed following 9/11.
For 2015, the 4-week average of the occupancy rate is solidly above the median for 2000-2007, and above last year.
Right now 2015 is above 2000 (best year for hotels), and 2015 will probably be the best year ever for hotels.
Occupancy Rate Year-to-date:
1) 2015 67.6%
2) 2000 66.9%
3) 2014 66.4%
Data Source: Smith Travel Research, Courtesy of HotelNewsNow.com
Flashback to 2006: "Housing prices have got a long way to fall"
by Calculated Risk on 11/13/2015 12:21:00 PM
Sometimes I look back through some older posts. Back in 2005 and 2006, the primary subject of my posts were the housing bubble, and the potential impact of the then coming housing bust on the US economy.
There were a number of people warning about the housing bust. Here is an interview I came across this morning. In this September 2006 post, I linked to a Bloomberg video of Paul Krugman discussing housing:
"I think we are looking at a housing cycle that we've never seen.On a national basis, according to Case-Shiller, house prices declined 25% following that interview to the post-bubble lows. In Las Vegas, house prices fell 60%.
...
If history is any guide, housing prices have got a long way to fall and the housing industry is going to go through a long drought."
And on the "long drought" ... housing starts fell over 70% ... and are still 30% below the level of September 2006.
Sometimes economists and analysts get it right.
Preliminary November Consumer Sentiment increases to 93.1
by Calculated Risk on 11/13/2015 10:02:00 AM
The preliminary University of Michigan consumer sentiment index for November was at 93.1, up from 90.0 in October.
"Confidence rose in early November mainly due to a stronger outlook for the domestic economy. Overall, the most recent confidence reading was equal to the average during the first ten months of 2015, and higher than any year since 2004. Two trends dominated the early November data: consumers anticipated somewhat larger income increases during the year ahead as well as expected a somewhat lower inflation rate. This meant that consumers held the most favorable inflation-adjusted income expectations since 2007. Moreover, the somewhat larger gains were anticipated by lower income households. Buying plans for large discretionary purchases improved, especially for vehicles. Overall, the data indicate an expected rate of growth in personal consumption expenditures of 2.9% in 2016. "This was above the consensus forecast of 92.0.

Click on graph for larger image.
Retail Sales increased 0.1% in October
by Calculated Risk on 11/13/2015 08:40:00 AM
On a monthly basis, retail sales were up 0.1% from September to October (seasonally adjusted), and sales were up 1.7% from October 2014.
From the Census Bureau report:
The U.S. Census Bureau announced today that advance estimates of U.S. retail and food services sales for October, adjusted for seasonal variation and holiday and trading-day differences, but not for price changes, were $447.3 billion, an increase of 0.1 percent from the previous month, and 1.7 percent above October 2014. ... The August 2015 to September 2015 percent change was revised from +0.1 percent to virtually unchanged.
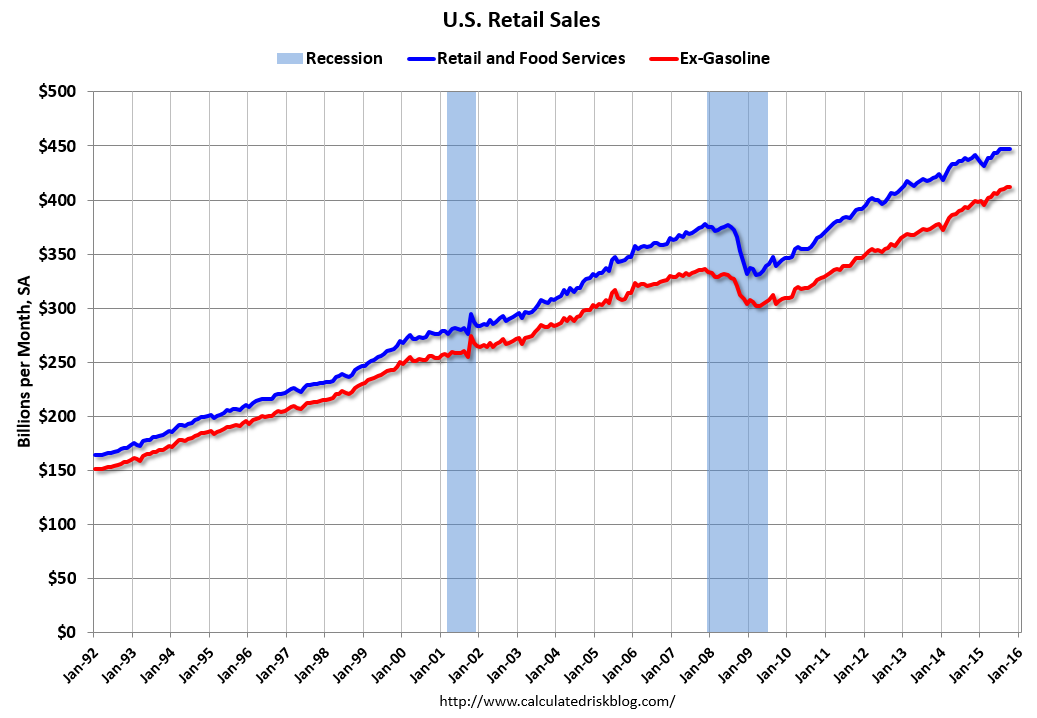 Click on graph for larger image.
This graph shows retail sales since 1992. This is monthly retail sales and food service, seasonally adjusted (total and ex-gasoline).
Retail sales ex-gasoline increased 0.1%.
The second graph shows the year-over-year change in retail sales and food service (ex-gasoline) since 1993.
 Retail and Food service sales ex-gasoline increased by 4.1% on a YoY basis (1.7% for all retail sales including gasoline).
The increase in October was below expectations of a 0.3% increase,and sales in August and September were revised down. This was a weak report, however sales ex-gasoline are still up a decent 4.1% YoY.


