 RSS Feed
 by Calculated Risk on 3/30/2015 07:51:00 PM
Monday, March 30, 2015
Tuesday: Case-Shiller House Prices, Chicago PMI
From the WSJ: Fed’s Fischer Floats Ideas for Regulating Shadow Banks
The Federal Reserve’s No. 2 official floated a series of ideas for regulating nonbank financial companies, the latest indication that top U.S. policy makers are focusing on risks in the so-called shadow banking sector.Tuesday:
“While there has been progress on the financial reform front, we should not be complacent about the stability of the financial system,” said Fed Vice Chairman Stanley Fischer in remarks prepared for a conference here hosted by the Federal Reserve Bank of Atlanta. He noted existing rules create an incentive for risky activities to move into less-regulated financial firms and said “we should expect that further reforms will certainly be needed down the road.”
• 9:00 AM ET, the S&P/Case-Shiller House Price Index for January. Although this is the January report, it is really a 3 month average of November, December and January prices. The consensus is for a 4.6% year-over-year increase in the National Index for January. The Zillow forecast is for the National Index to increase 4.6% year-over-year in January, and for prices to increase 0.5% month-to-month seasonally adjusted.
• At 9:45 AM, the Chicago Purchasing Managers Index for March. The consensus is for a reading of 50.2, up from 45.8 in February.
Demographics and GDP: 2% is the new 4%
by Calculated Risk on 3/30/2015 03:08:00 PM
Note: This is a repeat of a post I wrote early this year. Based on some recent comments I've seen, I think this is worth repeating.
For amusement, I checked out the WSJ opinion page comments on the Q4 GDP report. As usual, the WSJ opinion is pure politics - but it does bring up an excellent point (that the WSJ conveniently ignores).
First, from the WSJ opinion page:
The fourth quarter report means that growth for all of 2014 clocked in at 2.4%, which is the best since 2.5% in 2010. It also means another year, an astonishing ninth in a row, in which the economy did not grow by 3%.This period of low growth isn't "astonishing". First, usually following a recession, there is a brief period of above average growth - but not this time due to the financial crisis and need for households to deleverage. So we didn't see a strong bounce back (sluggish growth was predicted on the blog for the first years of the recovery).
And overall, we should have been expecting slower growth this decade due to demographics - even without the housing bubble-bust and financial crisis (that the WSJ opinion page missed).
One simple way to look at the change in GDP is as the change in the labor force, times the change in productivity. If the labor force is growing quickly, GDP will be higher with the same gains in productivity. And the opposite is true.
So here is a graph of the year-over-year change in the labor force since 1950 (data from the BLS).
 Click on graph for larger image
The data is noisy - because of changes in population controls and the business cycle - but the pattern is clear as indicated by the dashed red trend line. The labor force has been growing slowly recently after declining for some time.
We could also look at just the prime working age population - I've pointed out before the that prime working age population has just started growing again after declining for a few years (see Prime Working-Age Population Growing Again)
Now here is a look at GDP for the same period.
 The GDP data (year-over-year quarterly) is also noisy, and the dashed blue line shows the trend.
 GDP was high in the early 50s - and early-to-mid 60s because of government spending (Korean and Vietnam wars). As in example, in 1951, national defense added added 6.5 percentage points to GDP. Of course we don't want another war ...
Now lets put the two graphs together.
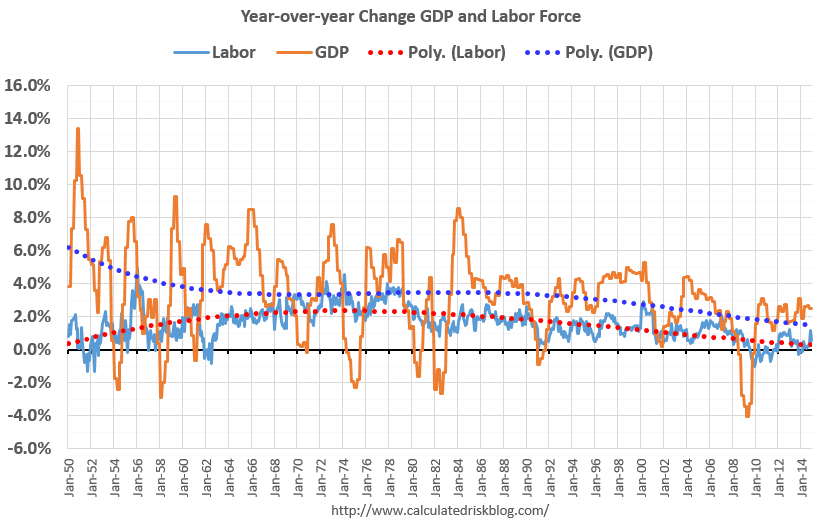 It isn't a surprise. Other than the early period with a boost from government spending, the growth in GDP has been tracking the growth in the labor force pretty well. The difference in growth between the dashed blue and red lines is due to gains in productivity.
The good news is that will change going forward (prime working age population will grow faster next decade). The bad news is the political hacks will continue to ignore demographics.
Right now, due to demographics, 2% GDP growth is the new 4%.
NAR: Pending Home Sales Index increased 3.1% in February, up 12% year-over-year
by Calculated Risk on 3/30/2015 10:08:00 AM
From the NAR: Pending Home Sales Rise in February Behind Solid Gains in Midwest, West
The Pending Home Sales Index, a forward-looking indicator based on contract signings, rose 3.1 percent to 106.9 in February from a slight downward revision of 103.7 in January and is now 12.0 percent above February 2014 (95.4). The index is at its highest level since June 2013 (109.4), has increased year-over-year for six consecutive months and is above 100 – considered an average level of activity – for the 10th consecutive month.This was well above the consensus forecast, but as expected by housing economist Tom Lawler.
...
The PHSI in the Northeast fell 2.3 percent to 81.7 in February, but is 4.1 percent above a year ago. In the Midwest the index leaped 11.6 percent to 110.4 in February, and is now 13.8 percent above February 2014.
Pending home sales in the South decreased 1.4 percent to an index of 120.2 in February, but is still 10.8 percent above last February. The index in the West climbed 6.6 percent in February to 102.1 (highest since June 2013 at 111.4) and is now 18.3 percent above a year ago.
Note: Contract signings usually lead sales by about 45 to 60 days, so this would usually be for closed sales in March and April.
Personal Income increased 0.4% in February, Spending increased 0.1%
by Calculated Risk on 3/30/2015 08:30:00 AM
The BEA released the Personal Income and Outlays report for February:
Personal income increased $58.6 billion, or 0.4 percent ... in February, according to the Bureau of Economic Analysis. Personal consumption expenditures (PCE)increased $11.8 billion, or 0.1 percent.The following graph shows real Personal Consumption Expenditures (PCE) through February 2015 (2009 dollars). Note that the y-axis doesn't start at zero to better show the change.
...
Real PCE -- PCE adjusted to remove price changes -- decreased 0.1 percent in February, in contrast to an increase of 0.2 percent in January. ... The price index for PCE increased 0.2 percent in February, in contrast to a decrease of 0.4 percent in January. The PCE price index, excluding food and energy, increased 0.1 percent in February, the same increase as in January.
The February price index for PCE increased 0.3 percent from February a year ago. The February PCE price index, excluding food and energy, increased 1.4 percent from February a year ago.
 Click on graph for larger image.
The dashed red lines are the quarterly levels for real PCE.
The increase in personal income was higher than expected, The increase in PCE was below the 0.2% increase consensus.
On inflation: The PCE price index increased 0.3 percent year-over-year due to the sharp decline in oil prices. The core PCE price index (excluding food and energy) increased 1.4 percent year-over-year in February.
Using the two-month method to estimate Q1 PCE growth, PCE was increasing at a 2.0% annual rate in Q1 2015 (using the mid-month method, PCE was increasing 0.8%). This is a slowdown in PCE.
Sunday, March 29, 2015
Monday: Personal Income and Outlays, Pending Home Sales, Dallas Fed Mfg
by Calculated Risk on 3/29/2015 08:08:00 PM
From the NY Times: A Deadline for Greece, and U.S. Jobs Data
Greece hopes to gain approval on Monday for a detailed list of economic changes that its international creditors have demanded ...Monday:
... recent economic data has been anemic, and it is likely that hiring has not kept up with the blistering pace of gains reached in late 2014. In fact, some economists say hiring could fall below the 200,000 level because of a combination of bad weather and weakness in certain sectors like drilling and energy production.
• 8:30 AM ET, Personal Income and Outlays for February. The consensus is for a 0.3% increase in personal income, and for a 0.2% increase in personal spending. And for the Core PCE price index to increase 0.1%.
• At 10:00 AM, the Pending Home Sales Index for February. The consensus is for a 0.3% increase in the index.
• At 10:30 AM, Dallas Fed Manufacturing Survey for March.
Weekend:
• Schedule for Week of March 29, 2015
• Lawler: Possible Upside Surprise for Pending Home Sales Index
• Merrill and Nomura Forecasts for March Employment Report
From CNBC: Pre-Market Data and Bloomberg futures: currently S&P futures are down slightly and DOW futures are flat (fair value).
Oil prices were up slightly over the last week with WTI futures at $48.34 per barrel and Brent at $55.97 per barrel. A year ago, WTI was at $101, and Brent was at $106 - so prices are down 50% or so year-over-year.
Below is a graph from Gasbuddy.com for nationwide gasoline prices. Nationally prices are up to $2.42 per gallon (down more than $1.10 per gallon from a year ago). Prices in California are now declining following a refinery fire in February and a strike that is now over.
If you click on "show crude oil prices", the graph displays oil prices for WTI, not Brent; gasoline prices in most of the U.S. are impacted more by Brent prices.
| Orange County Historical Gas Price Charts Provided by GasBuddy.com |
Lawler: Possible Upside Surprise for Pending Home Sales Index
by Calculated Risk on 3/29/2015 05:16:00 PM
CR Note: The NAR is scheduled to release Pending Home Sales for February tomorrow at 10:00 AM ET. The consensus is for a 0.3% increase in the index. Housing economist Tom Lawler mentioned in his existing home sales forecast a week ago:
While not enough local realtors/MLS either report data on new pending sales or report accurate/consistent data on new pending sales for me to produce a “national” estimate, most or the realtors/MLS that do report such data showed significantly faster YOY growth in pending sales in February compared to January.Note: The NAR reported Pending Home sales increased 1.7% in January.
Lawler sent me a note today:
Based on the admittedly limited number of other publicly-available regional/MLS reports on pending home sales, I'd look for an "upside surprise" to the NAR's Pending Home Sales Index for February.Lawler added this example of local data from the California Association of Realtors:
• California pending home sales jumped in February, with the Pending Home Sales Index (PHSI)* increasing 24.8 percent from a revised 89.9 in January to 112.2, based on signed contracts. The month-to-month increase easily topped the long-run average increase of 17.9 percent observed in the last seven years.Note: The YOY increase in the CAR PHSI in January was 6.0%.
• Statewide pending home sales were up 15.6 percent on an annual basis from the 97.1 index recorded in February 2014. The yearly increase was the largest since April 2009 and was the first double-digit gain since April 2012.
Look for a possible upside surprise tomorrow.
Merrill and Nomura Forecasts for March Employment Report
by Calculated Risk on 3/29/2015 11:38:00 AM
Here are some excepts from two research reports ... first from Merrill Lynch:
The recent employment reports have been exceptionally strong with job growth averaging 293,000 a month for the past six months. Although we expect a slight moderation in March with job growth of 270,000, this would still be a healthy number. Within the components, we should continue to see a shedding of jobs in the mining sector, which lost a cumulative 14,000 over the past two months. The plunge in oil prices has resulted in layoffs in oil and gas production. Elsewhere, we expect decent growth in construction jobs but a slowdown in manufacturing hiring given the recent weakness in the PMI surveys. We will also be closely looking at the trend in retail hiring as an indicator of the beginning of the spring shopping season. Overall, this will leave private payroll growth of 260,000 and public of 10,000.From Nomura:
Despite strong job growth, we think the unemployment rate will tick up to 5.6%. The unrounded unemployment rate in February was 5.54%, making it a “high” 5.5%. The risk is that the labor force participation rate increases, reversing the decline in February. As always, the focus will be on wages. We look for a 0.2% gain, an improvement from the 0.12% increase in February. This would leave the yoy rate at 2.0%. We think the risk, however, is that average hourly earnings surprises on the upside relative to our forecast.
Job growth has been very strong recently. Incoming data have tilted negative in March, but on balance still suggest that payrolls increased at a solid pace. Regional manufacturing surveys released thus far in March have come in less optimistic, suggesting that manufacturing jobs probably grew at a slower rate. Initial and continuing jobless claims have remained low throughout the month but were higher in the BLS survey period in March compared with the same period in February.The consensus is for an increase of 247,000 non-farm payroll jobs in March, down from the 295,000 non-farm payroll jobs added in February.
Based on readings of these labor market indicators, we forecast a 220k increase in private payrolls, with a 5k increase in government jobs, implying that total nonfarm payrolls will gain 225k. Given the weaker regional manufacturing surveys, we expect manufacturing employment to grow by 5k, compared with 8k in February. We forecast that average hourly earnings for private employees rose by 0.3% m-o-m in March, indicative of our expectation for a gradual pickup in wage growth as a result of the tightening labor market and also representing some bounce back after the unusually weak number in February. Last, we expect the household survey to show that the unemployment rate ticked down by 0.1pp to 5.4%.
The consensus is for the unemployment rate to be unchanged at 5.5% in March.
I'll write an employment report preview later this week after more data for March is released.
Saturday, March 28, 2015
Schedule for Week of March 29, 2015
by Calculated Risk on 3/28/2015 01:41:00 PM
The key report this week is the March employment report on Friday.
Other key indicators include the February Personal Income and Outlays report on Monday, March ISM manufacturing index also on Wednesday, March vehicle sales on Wednesday, and the February Trade Deficit on Thursday.
Also, Reis will release their quarterly surveys of rents and vacancy rates for offices, apartments and malls.
8:30 AM ET: Personal Income and Outlays for February. The consensus is for a 0.3% increase in personal income, and for a 0.2% increase in personal spending. And for the Core PCE price index to increase 0.1%.
10:00 AM: Pending Home Sales Index for February. The consensus is for a 0.3% increase in the index.
10:30 AM: Dallas Fed Manufacturing Survey for March.
 9:00 AM: S&P/Case-Shiller House Price Index for January. Although this is the January report, it is really a 3 month average of November, December and January prices.
This graph shows the nominal seasonally adjusted National Index, Composite 10 and Composite 20 indexes through the December 2014 report (the Composite 20 was started in January 2000).
The consensus is for a 4.6% year-over-year increase in the National Index for January. The Zillow forecast is for the National Index to increase 4.6% year-over-year in January, and for prices to increase 0.5% month-to-month seasonally adjusted.
9:45 AM: Chicago Purchasing Managers Index for March. The consensus is for a reading of 50.2, up from 45.8 in February.
7:00 AM: The Mortgage Bankers Association (MBA) will release the results for the mortgage purchase applications index.
8:15 AM: The ADP Employment Report for March. This report is for private payrolls only (no government). The consensus is for 225,000 payroll jobs added in March, up from 212,000 in February.
 10:00 AM: ISM Manufacturing Index for March. The consensus is for a decrease to 52.5 from 52.9 in February.
Here is a long term graph of the ISM manufacturing index.
The ISM manufacturing index indicated expansion in February at 52.9%. The employment index was at 51.4%, and the new orders index was at 52.5%.
10:00 AM: Construction Spending for February. The consensus is for a 0.2% increase in construction spending.
Early: Reis Q1 2015 Office Survey of rents and vacancy rates.
 All day: Light vehicle sales for March. The consensus is for light vehicle sales to increase to 16.8 million SAAR in March from 16.2 million in February (Seasonally Adjusted Annual Rate).
This graph shows light vehicle sales since the BEA started keeping data in 1967. The dashed line is the February sales rate.
8:30 AM: The initial weekly unemployment claims report will be released. The consensus is for claims to increase to 285 thousand from 282 thousand.
 8:30 AM: Trade Balance report for February from the Census Bureau.
 This graph shows the U.S. trade deficit, with and without petroleum, through January. The blue line is the total deficit, and the black line is the petroleum deficit, and the red line is the trade deficit ex-petroleum products.
The consensus is for the U.S. trade deficit to be at $41.5 billion in February from $41.8 billion in January.
Early: Reis Q1 2015 Apartment Survey of rents and vacancy rates.
10:00 AM: Manufacturers' Shipments, Inventories and Orders (Factory Orders) for February. The consensus is for no change in February orders.
8:30 AM: Employment Report for March. The consensus is for an increase of 247,000 non-farm payroll jobs added in March, down from the 295,000 non-farm payroll jobs added in February.
The consensus is for the unemployment rate to be unchanged at 5.5%.
 This graph shows the year-over-year change in total non-farm employment since 1968.
In February, the year-over-year change was 3.3 million jobs. This was the highest year-over-year gain since the '90s.
As always, a key will be the change in real wages - and as the unemployment rate falls, wage growth should start to pickup.
Early: Reis Q1 2015 Mall Survey of rents and vacancy rates.
Unofficial Problem Bank list decline to 349 Institutions in March, Q1 2015 Transition Matrix
by Calculated Risk on 3/28/2015 09:03:00 AM
This is an unofficial list of Problem Banks compiled only from public sources.
Here is the unofficial problem bank list for March 2015.
Changes and comments from surferdude808:
Update on the Unofficial Problem Bank List for March 2015. During the month, the list fell from 357 institutions to 349 after nine removals and one addition. Assets dropped by $2.9 billion to an aggregate $106.2 billion. A year ago, the list held 538 institutions with assets of $174.3 billion.
Actions were terminated against First National Community Bank Dunmore, PA, ($969 million Ticker: FNCB); Colorado East Bank & Trust, Lamar, CO, ($769 million); Bay Cities Bank, Tampa, FL ($519 million); The Citizens Bank, Nashville, GA, ($259 million); Grand Bank & Trust of Florida, West Palm Beach, FL ($208 million); The Bank of Washington, Lynnwood, WA, ($152 million); Capitol National Bank, Lansing, MI ($115 million Ticker: CBCRQ); and Fox River State Bank, Burlington, WI ($73 million).
First Tuskegee Bank, Tuskegee, AL ($52 million) find its way off the list by merging with the minority-controlled Liberty Bank and Trust Company that is based in New Orleans, LA.
The addition this month was Harvest Community Bank, Pennsville, NJ ($184 million Ticker: HCBP).

With it being the end of the first quarter, we bring an update on the transition matrix. Since the Unofficial Problem Bank List was first published on August 7, 2009 with 389 institutions, a total of 1,691 institutions have appeared on the list at some point. There have been 1,342 institutions have come and gone on the list. Departure methods include 724 action terminations, 391 failures, 213 mergers, and 14 voluntary liquidations. The first quarter of 2015 started with 401 institutions on the list, so the 48 action terminations during the quarter reduced the list by 12 percent. Although it is easier to achieve a high removal percentage given the smaller overall list count, the 12 percent quarterly removal rate is the fastest since the list has been published. Of the 389 institutions on the first published list, 45 still remain nearly six years later. The 391 failures are 23.1 percent of the 1,691 institutions that have appeared on the list. This failure rate is well above the 10-12 percent rate frequently cited in media reports on the failure rate of banks on the FDIC's official list.
| Unofficial Problem Bank List | |||
|---|---|---|---|
| Change Summary | |||
| Number of Institutions | Assets ($Thousands) | ||
| Start (8/7/2009) | 389 | 276,313,429 | |
| Subtractions | |||
| Action Terminated | 150 | (57,648,218) | |
| Unassisted Merger | 36 | (8,760,484) | |
| Voluntary Liquidation | 4 | (10,584,114) | |
| Failures | 154 | (184,269,578) | |
| Asset Change | (4,361,945) | ||
| Still on List at 3/31/2015 | 45 | 10,689,090 | |
| Additions after 8/7/2009 | 304 | 95,551,036 | |
| End (3/31/2015) | 349 | 106,240,126 | |
| Intraperiod Deletions1 | |||
| Action Terminated | 574 | 234,619,564 | |
| Unassisted Merger | 177 | 75,762,416 | |
| Voluntary Liquidation | 10 | 2,324,142 | |
| Failures | 237 | 119.479,684 | |
| Total | 998 | 432,185,806 | |
| 1Institution not on 8/7/2009 or 3/31/2015 list but appeared on a weekly list. | |||
Friday, March 27, 2015
Hotels: On Pace for Best Year on Record
by Calculated Risk on 3/27/2015 06:13:00 PM
From HotelNewsNow.com: STR: US hotel results for week ending 21 March
The U.S. hotel industry recorded positive results in the three key performance measurements during the week of 15-21 March 2015, according to data from STR, Inc.Note: ADR: Average Daily Rate, RevPAR: Revenue per Available Room.
In year-over-year measurements, the industry’s occupancy rose 3.2 percent to 69.3 percent. Average daily rate increased 6.6 percent to finish the week at US$122.46. Revenue per available room for the week was up 10.0 percent to finish at US$84.89.
emphasis added
The following graph shows the seasonal pattern for the hotel occupancy rate using the four week average.
Hotels are now in the Spring travel period and business travel will be solid over the next couple of months.
 Click on graph for larger image.
The red line is for 2015, dashed orange is 2014, blue is the median, and black is for 2009 - the worst year since the Great Depression for hotels. Purple is for 2000.
The 4-week average of the occupancy rate is solidly above the median for 2000-2007, and solidly above 2014.
So far 2015 is at slightly above the level for 2000 (best year for hotels) - and 2015 will probably be the best year on record for hotels.
Data Source: Smith Travel Research, Courtesy of HotelNewsNow.com


