 RSS Feed
 by Calculated Risk on 1/07/2013 09:06:00 PM
Monday, January 07, 2013
Tuesday: Apartment Vacancy Rate
From Alan Zibel and Nick Timiraos at the WSJ: Watchdog to Set Loan Rules
This week, the Consumer Financial Protection Bureau will define standards that all mortgage lenders are likely to follow when originating home loans. ...In the long run this is an important step. This will insure that most loans are made to a somewhat reasonable standard (43% of pretax income is pretty high) - and no stated income or Alt-A loans will meet these standards (Great news!).
The rules don't specify a minimum down payment and instead focus on ensuring that banks document borrowers' ability to make their monthly loan payments. Loans in which borrowers make only interest payments for a set period and those in which the principal balance can increase are excluded by law from being "qualified" mortgages. ...
CFPB is likely to offer two ways in which lenders can meet the regulator's standard ... Under the first approach, the regulator will consider as qualified mortgages all loans that receive an approval after being run through the automated underwriting engines maintained by [Fannie, Freddie, FHA], even if they aren't ultimately sold to or insured by those institutions.
Under the second approach, loans would be deemed qualified mortgages if borrowers are spending no more than 43% of their pretax income on monthly debt payments.
Tuesday economic release:
• Early: Reis Q4 2012 Apartment survey of rents and vacancy rates. In Q3 Reis reported the apartment vacancy rate declined to 4.6%, from 4.7% in Q2. The vacancy rate peaked at 8.0% in Q4 2008 and Q1 2009. With a combination of more supply coming online, and the probable bottom for house prices (motivating some renters to buy), most of the decline in the vacancy rate is probably behind us.
• At 7:30 AM ET, the NFIB Small Business Optimism Index for December will be released. The consensus is for an increase to 87.9 from 87.5 in November.
• At 3:00 PM, Consumer Credit for November from the Federal Reserve. The consensus is for credit to increase $13.2 billion in November.
Housing: Inventory down 24% year-over-year in early January
by Calculated Risk on 1/07/2013 06:57:00 PM
Inventory declines every year in December and January as potential sellers take their homes off the market for the holidays. That is why it helps to look at the year-over-year change in inventory.
According to the deptofnumbers.com for (54 metro areas), overall inventory is down 23.9% year-over-year in early January, and probably at the lowest level since the early '00s.
This graph shows the NAR estimate of existing home inventory through November (left axis) and the HousingTracker data for the 54 metro areas through early January.
 Click on graph for larger image.
Since the NAR released their revisions for sales and inventory in 2011, the NAR and HousingTracker inventory numbers have tracked pretty well.
On a seasonal basis, housing inventory usually bottoms during the holidays and then starts increasing in February - and peaks in mid-summer. So inventory is probably near the seasonal bottom right now and should start increasing again soon.
The second graph shows the year-over-year change in inventory for both the NAR and HousingTracker.
 HousingTracker reported that the early January listings, for the 54 metro areas, declined 23.9% from the same period last year.
The year-over-year declines will probably start to get smaller since inventory is already very low. It seems very unlikely we will see 20%+ year-over-year declines this summer, and I think overall inventory might be bottoming right now.
Question #8 for 2013: Will Housing inventory bottom in 2013?
by Calculated Risk on 1/07/2013 04:24:00 PM
Earlier I posted some questions for this year: Ten Economic Questions for 2013. I'll try to add some thoughts, and maybe some predictions for each question.
Note: Here is a review of my 2012 Forecasts
8) Housing Inventory: Over the last few years, we've seen a dramatic plunge in existing home inventory. Will inventory bottom in 2013?
This is an interesting question and the lack of supply is one of the reasons house prices were up about 6% in 2012. Economist Jed Kolko at Trulia wrote about inventory last month:
The key question in 2013, though, is whether prices will rise enough so that for-sale inventory–which has fallen 43% nationally since the summer of 2010–will hit bottom and start expanding again. ... Rising prices should lead to more inventory, for two reasons: (1) rising prices encourage new construction, and (2) rising prices encourage some homeowners to sell.This graph shows nationwide inventory for existing homes through November.
 Click on graph for larger image.
According to the NAR, inventory declined to 2.03 million in November down from 2.11 million in October. This is the lowest level of inventory since December 2001. Inventory is not seasonally adjusted, and usually inventory decreases from the seasonal high in mid-summer to the seasonal lows in December and January as sellers take their homes off the market for the holidays.
If we see the usually seasonal decline in December (not reported yet) and January, then NAR reported inventory will probably fall to the 1.80 to 1.85 million range. That would be the lowest level since January 2001.
Important: The NAR reports active listings, and although there is some variability across the country in what is considered active, most "contingent short sales" are not included. When we compare inventory to earlier periods, we need to remember there were essentially no "short sale contingent" listings prior to 2006.
 The second graph shows the year-over-year (YoY) change in reported existing home inventory and months-of-supply. Since inventory is not seasonally adjusted, it really helps to look at the YoY change. Note: Months-of-supply is based on the seasonally adjusted sales and not seasonally adjusted inventory.
Inventory decreased 22.5% year-over-year in November from November 2011. This was the 21st consecutive month with a YoY decrease in inventory.
Months of supply declined to 4.8 months in November. This is the lowest level based on months-of-supply since September 2005.
Whenever I talk with real estate agents, I ask why they think inventory is so low. A common answer is that people don't want to sell at the bottom. In a market with falling prices, sellers rush to list their homes, and inventory increases. But if sellers think prices have bottomed, then they believe they can be patient, and inventory declines. Another reason is that many homeowners are "underwater" on their mortgage and can't sell.
Note: the Mortgage Debt Relief Act of 2007 was extended for another year. This means homeowners can sell their homes "short" (for less than they owe if the lender approves) and they don't have to pay taxes on the debt forgiveness. This will keep the short sale market active in 2013.
If prices increase enough then some of the potential sellers will come off the fence, and some of these underwater homeowners will be able to sell. It might be enough for inventory to bottom in 2013.
Right now my guess is active inventory will bottom in 2013, probably in January. At the least, the rate of year-over-year inventory decline will slow sharply. It will be very interesting to see how much inventory comes on the market during the spring selling season!
Here are the ten questions for 2013 and a few predictions:
• Question #1 for 2013: US Fiscal Policy
• Question #2 for 2013: Will the U.S. economy grow in 2013?
• Question #3 for 2013: How many payroll jobs will be added in 2013?
• Question #4 for 2013: What will the unemployment rate be in December 2013?
• Question #5 for 2013: Will the inflation rate rise or fall in 2013?
• Question #6 for 2013: What will happen with Monetary Policy and QE3?
• Question #7 for 2013: What will happen with house prices in 2013?
• Question #8 for 2013: Will Housing inventory bottom in 2013?
• Question #9 for 2013: How much will Residential Investment increase?
• Question #10 for 2013: Europe and the Euro
Thoughts on the Budget Deficit
by Calculated Risk on 1/07/2013 01:57:00 PM
Note: The US government is on a fiscal year that runs from October 1st through September 30th of the following year. Fiscal year 2012 ended on September 30th of 2012, and fiscal year 2013 started on October 1, 2012. The graphs below use fiscal year GDP.
A few points on "short term" vs. "long term" issues, and cyclical vs. structural deficits. None of this should be controversial (or political).
1. The "fiscal cliff" was about reducing the deficit too quickly in the short term. This was concerning because a rapid reduction in the deficit (aka "austerity") would probably have taken the economy back into recession. The fiscal agreement reduces the deficit this year compared to fiscal 2012 - the payroll tax hike alone adds almost $120 billion in revenue this year. Those saying "nothing was accomplished" are possibly confusing the short term with the long term.
2. There is a long term budget problem mostly related to spending for health care. I'll have more on this in a future post, but I think it helps to focus on the short term right now.
3. There is a significant difference between a "structural" budget deficit, and a "cyclical" deficit. A cyclical deficit happens when the economy goes into recession because tax revenues decline, and spending on safety net programs like unemployment insurance and food stamps increases. A cyclical deficit is expected during recessions, and the Federal government is (and should be) counter-cyclical. (this should not be controversial).
4. A structural deficit is a mismatch between tax revenue and outlays even during good times. A structural deficit is much worse for the economy than a cyclical deficit since a cyclical deficit will decline as the economy recovers, but a structural deficit is ongoing.
Here are a couple of graphs.
 Click on graph for larger image.
The first graph shows revenue and outlays as a percent of GDP. Clearly, in fiscal 2012, the government had BOTH a revenue and spending problem. Both revenue and spending have been impacted by the great recession, and are slowly recovering.
There was also a structural deficit starting in fiscal 2002, and even during the housing boom, revenue was below outlays. So the recent low level revenue was due to both cyclical and structural reasons.
In fiscal 2013, revenue will increase due to the payroll tax increase, an increase in the tax rate on high income earners, and an improving economy. Spending will probably decrease as a percent of GDP due to some defense spending cuts and an improving economy.
Here are the data sources for these graphs. CBO: Historical Budget Data and An Update to the Budget and Economic Outlook: Fiscal Years 2012 to 2022, BEA: GDP Tables
 The second graph shows the budget deficit each year as a percent of GDP. As David Wessel at the WSJ recently noted: Putting the Brakes on Cutting the Deficit
In the depths of the most recent recession, the fiscal year that ended Sept. 30, 2009, the deficit was 10.1% of gross domestic product, the value of all the goods and services produced. Since then, the deficit has declined to 9% of GDP in 2010, 8.7% in 2011 and 7.0% in fiscal 2012. Private analysts predict the deficit will be between 5.5% and 6.0% of GDP in fiscal 2013 ...My guess is the deficit will decline to around 5.5% of GDP this year. If there is no change in policy, I expect the deficit to continue to decline over the next few years.
However, later this decade, the deficit will probably start to increase again, mostly due to rising health care expenditures. This is the long term issue, and health care spending needs to be addressed to put the debt on a sustainable path long term.
The key points are: the cyclical deficit will slowly decline, and there is a long term issue, mostly related to health care costs that we need to start to address in the next few years.
We'd be in better shape without the structural deficit and if we had avoided the great recession (I did my best to alert policymakers in 2005). But that is water over the dam. The bottom line is this is all very solvable.
Office Vacancy Rate and Office Investment
by Calculated Risk on 1/07/2013 10:26:00 AM
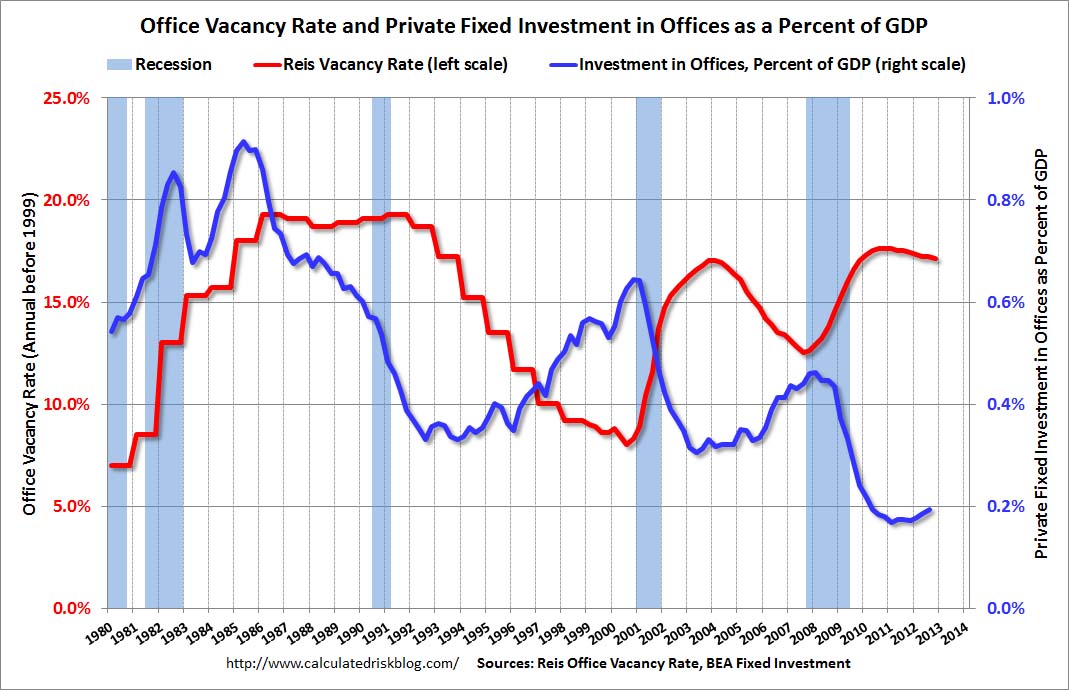
Earlier this morning I noted that Reis reported the office vacancy rate declined slightly to 17.1% in Q4 from 17.2% in Q3.
A key question is when will new office investment increase. The answer depends on how quickly the vacancy rate falls. The following graph shows the office vacancy rate and office investment as a percent of GDP. Note: Office investment also includes improvements - and as Reis Senior Economist Ryan Severino noted this morning, there is very little new construction.
Here is Reis Senior Economist Ryan Severino's office forecast for 2013:
"The outlook for 2013 is slightly better than what we experienced in 2012. Although some of the uncertainty over the potential “fiscal cliff” has been resolved, spending decisions still remain and the debt situation in Europe, which oscillates in and out of panic, is still uncertain. Moreover, higher payroll and income taxes are likely to reduce consumption and the government is expected to implement some spending cuts, if not outright sequestration. Nonetheless, job growth is expected to accelerate slightly during 2013 while the unemployment rate is expected to tick marginally lower. Reflecting this moderate improvement, we expect an acceleration in both rent growth and vacancy compression next year, but it is important to keep expectations aligned with reality. And the reality for 2013 is another year of languorous recovery."
 Click on graph for larger image.
This graph shows the office vacancy rate starting in 1980 (prior to 1999 the data is annual). Back in the early '80s, there was overbuilding in the office sector even as the vacancy rate was rising. This was due to the very loose lending that led to the S&L crisis.
In the '90s, office investment picked up as the vacancy rate fell. Following the bursting of the stock bubble, the vacancy rate increased sharply and office investment declined.
During the housing bubble, office investment started to increase even before the vacancy rate had fallen below 14%. This was due to loose lending - again. Investment essentially stopped following the financial crisis.
Like Reis, I expect the office vacancy rate to slowly decline, and I don't expect a significant pickup in new investment until the vacancy rate is close to 14%.
Office vacancy data courtesy of Reis.
Reis: Office Vacancy Rate declines slightly in Q4 to 17.1%
by Calculated Risk on 1/07/2013 08:15:00 AM
Reis released their Q4 Office Vacancy survey this morning. Reis reported that the office vacancy rate declined slightly to 17.1% from 17.2% in Q3.
On absorption from Reis Senior Economist Ryan Severino:
During the fourth quarter 3.691 million square feet were absorbed. This represents a decrease versus the 4.819 million square feet that were absorbed during the third quarter and the 4.842 million square feet that were absorbed during the fourth quarter of 2011. However, this is the eighth consecutive quarter of positive net absorption.On new construction:
3.170 million square feet were delivered during the fourth quarter, versus 3.821 million square feet during the third quarter. This is also a slowdown compared to the 3.653 million square feet of office space that were delivered during the fourth quarter of 2011. For calendar year 2012, 12.025 million square feet were completed. This is a decline from the 15.164 million square feet that were completed during 2011.On rents:
Asking and effective rents both grew by 0.8% during the fourth quarter. This exceeded the third quarter performance when asking and effective rents both grew 0.2%. This was the ninth consecutive quarter that asking and effective rents have increased. This was the strongest performance of both measures since mid‐2008 before the downturn in the office market.
 Click on graph for larger image.
This graph shows the office vacancy rate starting in 1980 (prior to 1999 the data is annual).
Reis is reporting the vacancy rate declined in Q4 to 17.1%, down slightly from 17.2% in Q3, and down from 17.4% in Q4 2011. The vacancy rate peaked in this cycle at 17.6% in Q3 and Q4 2010, and Q1 2011.
As Severino noted, net absorption was still positive, even though demand for office space was low - because there is so little new construction. This remains a sluggish recovery for office space, and new construction will stay low until the vacancy rate falls much further.
Sunday, January 06, 2013
Sunday Night Futures
by Calculated Risk on 1/06/2013 09:18:00 PM
From the NY Times: Deal in Foreclosure Case Is Imminent, Officials Say
A $10 billion settlement to resolve claims of foreclosure abuses by 14 major lenders is expected to be announced as early as Monday, several people with knowledge of the discussions said on Sunday.This agreement ends the foreclosure review process that was apparently not effective. This is an addition to the settlement last year.
The settlement comes after weeks of negotiations between federal regulators and the banks, and covers abuses like flawed paperwork and botched loan modifications ...
An estimated $3.75 billion of the $10 billion is to be distributed in cash relief to Americans who went through foreclosure in 2009 and 2010, these people said. An additional $6 billion is to be directed toward homeowners in danger of losing their homes after falling behind on their monthly payments.
Monday economic release:
• Reis Q4 2012 Office survey of rents and vacancy rates. In Q3 Reis reported the office vacancy rate declined to 17.1%, from 17.2% in Q2. The vacancy rate peaked in this cycle at 17.6% in Q3 and Q4 2010.
Weekend:
• Summary for Week Ending Jan 4th
• Schedule for Week of Jan 6th
• Question #9 for 2013: How much will Residential Investment increase?
• Question #10 for 2013: Europe and the Euro
The Asian markets are mixed tonight; the Shanghai Composite index is up slightly, and the Nikkei is down 0.4%.
From CNBC: Pre-Market Data and Bloomberg futures: the S&P futures are down 2 and DOW futures are down 20.
Oil prices have moved up a recently with WTI futures at $92.97 per barrel and Brent at $111.32 per barrel. Gasoline prices have also increased a little recently.
Question #9 for 2013: How much will Residential Investment increase?
by Calculated Risk on 1/06/2013 06:26:00 PM
Earlier I posted some questions for next year: Ten Economic Questions for 2013. I'll try to add some thoughts, and maybe some predictions for each question.
Note: Here is a review of my 2012 Forecasts
9) Residential Investment: Residential investment (RI) picked up in 2012, with new home sales and housing starts increasing 20% or so. Note: RI is mostly investment in new single family structures, multifamily structures, home improvement and commissions on existing home sales. This still leaves RI at a historical low level. How much will RI increase in 2013?
First a graph of RI as a percent of Gross Domestic Product (GDP) through Q3 2012.
 Click on graph for larger image.
Usually residential investment is a strong contributor to GDP growth and employment in the early stages of a recovery, but not this time - and that weakness was a key reason why the recovery was sluggish so far. Residential investment finally turned positive during 2011 and made a positive contribution to GDP in 2012.
Residential investment as a percent of GDP is just above the record low, and it seems likely that residential investment as a percent of GDP will increase further in 2013.
 The second graph shows total and single family housing starts through November 2012.
Housing starts are on pace to increase about 25% in 2012. And even after the sharp increase last year, the approximately 770 thousand housing starts in 2012 will still be the 4th lowest on an annual basis since the Census Bureau started tracking starts in 1959 (the three lowest years were 2009 through 2011).
Here is a table showing housing starts over the last few years. No one should expect an increase to 2005 levels, however demographics and household formation suggest starts will return to close to the 1.5 million per year average from 1959 through 2000. That means starts will come close to doubling over the next few years from the 2012 level.
| Housing Starts (000s) | ||||
|---|---|---|---|---|
| Total | Change | Single Family | Change | |
| 2005 | 2,068.3 | --- | 1,715.8 | --- |
| 2006 | 1,800.9 | -12.9% | 1,465.4 | -14.6% |
| 2007 | 1,355.0 | -24.8% | 1,046.0 | -28.6% |
| 2008 | 905.5 | -33.2% | 622.0 | -40.5% |
| 2009 | 554.0 | -38.8% | 445.1 | -28.4% |
| 2010 | 586.9 | 5.9% | 471.2 | 5.9% |
| 2011 | 608.8 | 3.7% | 430.6 | -8.6% |
| 20121 | 770.0 | 26% | 535.0 | 24% |
| 12012 estimated | ||||
 The third graph shows New Home Sales since 1963 through November 2012. The dashed line is the current sales rate.
Just like for RI as a percent of GDP, and housing starts, new home sales were up in 2012, but are still near the low historically.
New home sales will still be competing with distressed sales (short sales and foreclosures) in many areas in 2013 - and probably even more foreclosures in some judicial states. Also I've heard some builders might be land constrained in 2013 (not enough finished lots in the pipeline). Both of these factors could slow the growth of residential investment, but I expect another solid year of growth.
Here are some recent forecasts for housing in 2013. I expect growth for new home sales and housing starts in the 20% to 25% range in 2013 compared to 2012. That would still make 2013 the sixth weakest year on record for housing starts (behind 2008 through 2012), and the seventh or eight weakest for new home sales. So I expect further growth in 2014 too.
Here are the ten questions for 2013 and a few predictions:
• Question #1 for 2013: US Fiscal Policy
• Question #2 for 2013: Will the U.S. economy grow in 2013?
• Question #3 for 2013: How many payroll jobs will be added in 2013?
• Question #4 for 2013: What will the unemployment rate be in December 2013?
• Question #5 for 2013: Will the inflation rate rise or fall in 2013?
• Question #6 for 2013: What will happen with Monetary Policy and QE3?
• Question #7 for 2013: What will happen with house prices in 2013?
• Question #8 for 2013: Will Housing inventory bottom in 2013?
• Question #9 for 2013: How much will Residential Investment increase?
• Question #10 for 2013: Europe and the Euro
Question #10 for 2013: Europe and the Euro
by Calculated Risk on 1/06/2013 02:44:00 PM
Earlier I posted some questions for next year: Ten Economic Questions for 2013. I'll try to add some thoughts, and maybe some predictions for each question.
Mostly I focus on the US, but like everyone I've been watching Europe a little more closely over the last few years. Unfortunately the situation in Europe remains grim, with high unemployment - especially in Greece and Spain - and most of the eurozone in recession.
However the crisis has eased a bit. There are several reasons - one key is the the ECB's longer-term refinancing operations (LTROs) that was offered in December 2011. These have a 36 month maturity, and the LTROs have helped lower borrowing costs in Europe.
 Click on graph for larger image in graph gallery.
This graph, from the Atlanta Fed, shows the 10-year bond spreads for a few European countries (this is the difference between the 10-year bond of each country to the 10-year of Germany).
By this measure, the financial crisis has eased recently (the recent agreements with Greece have helped too).
With a Greek deal in place, and Germany's Merkel motivated by the election later this year to keep the eurozone together, and a strong commitment by other policymakers to the euro, I think there is a good chance that the eurozone and the euro will make it through 2013 intact.
Even though I've been pessimistic on Europe (In 2011, I argued that the eurozone was heading into recession), I was less pessimistic than many others. Each of the last two years, I argued the eurozone would stay together (2011: Europe and the Euro and 2012: Europe and the Euro). My guess is the eurozone makes it through another year without losing any countries or a serious collapse. Obviously several countries are near the edge, and the key will be to return to expansion soon.
Note: unless the eurozone "implodes", I don't think Europe poses a large downside risk to the US. If there is a breakup of the euro (something I do not expect in 2013), then the impact on the US could be significant due to financial tightening.
Here are the ten questions for 2013 and a few predictions:
• Question #1 for 2013: US Fiscal Policy
• Question #2 for 2013: Will the U.S. economy grow in 2013?
• Question #3 for 2013: How many payroll jobs will be added in 2013?
• Question #4 for 2013: What will the unemployment rate be in December 2013?
• Question #5 for 2013: Will the inflation rate rise or fall in 2013?
• Question #6 for 2013: What will happen with Monetary Policy and QE3?
• Question #7 for 2013: What will happen with house prices in 2013?
• Question #8 for 2013: Will Housing inventory bottom in 2013?
• Question #9 for 2013: How much will Residential Investment increase?
• Question #10 for 2013: Europe and the Euro
Labor Force Participation Rate Update
by Calculated Risk on 1/06/2013 10:22:00 AM
I've written extensively about the participation rate, see: Understanding the Decline in the Participation Rate and Further Discussion on Labor Force Participation Rate.
In trying to forecast the change in the unemployment rate for 2013, it is important to forecast what will happen to the participation rate this year. The participation rate is the percentage of the working age population in the labor force. If more people join the workforce, then more jobs will be needed to push down the unemployment rate. However, if the participation rate stays flat in 2013 - or even declines further - then fewer jobs are needed to push down the unemployment rate.
 Click on graph for larger image in graph gallery.
Here is a repeat of a graph from the December employment report. The Labor Force Participation Rate was unchanged at 63.6% in December (blue line).
A key point: The recent decline in the participation rate was expected, and a large portion of the decline in the participation rate was due to changing demographics, as opposed to economic weakness.
 The second graph shows the changes in the participation rates for men and women since 1960 (in the 25 to 54 age group - the prime working years).
The participation rate for prime working age women increased significantly from the mid 30s to the mid 70s and has mostly flattened out since then. The participation rate for women increased slightly in December to 74.5% and might increase a little in 2013.
The participation rate for prime working age men has been decreasing for decades - from the high 90s in the 1950s to just over 90% in 2005. In December, the participation rate for men increased slightly to 88.4% .
I still expect a little bounce back for both prime working age men and women - but not much.
There are other key demographic trends - younger people have been staying in school, so the participation rate for those under 25 has been falling - and older people have been staying in the work force longer, so the participation rate for older workers has been increasing.
Overall I've been expecting some small bounce back in the participation rate, but I don't think any bounce back will be huge - and that means it will take fewer jobs than some expect to lower the unemployment rate in 2013. This remains a key number to watch.


