 RSS Feed
 by Calculated Risk on 12/24/2012 11:52:00 AM
Monday, December 24, 2012
Review of My 2012 Forecasts
Near the end of each year I try to post a few general forecasts for the coming year. The purpose is to try to provide an overview of how I think the economy will perform.
Some years there are BIG calls, like in late 2006 when I predicted a recession would start in 2007 (made it by one month!). Another “BIG” call example was in early 2009 when I started writing about a second half economic recovery.
Most of my forecasts are more mundane, as an example for 2012 GDP, I wrote:
“my guess is growth will be sluggish relative to the slack in the system, but above the 2011 growth rate. “Right now “sluggish” looks correct, and if Q4 2012 GDP is at or above 1.6% (annualized), then 2012 will actually be better than 2011 (Q4 over Q4 of previous year). But even if I had been wrong, I find it useful to write down some forecasts and then to understand why I was right or wrong. (I’d say my guess on growth was about right).
Of course my BIG call for 2012 was that house prices would finally find a bottom as measured by the national repeat sales indexes (see: The Housing Bottom is Here). In early 2012, I wrote:
“My guess is that nominal house prices, using the national repeat sales indexes and not seasonally adjusted, will bottom in March 2012.”As of right now – with prices up almost 5% seasonally adjusted since early this year – the house price bottom call looks correct.
Note: When I wrote that post, the consensus was house prices would decline throughout 2012. Since then the consensus has changed and most analysts now think prices bottomed early this year.
I did get a couple of forecasts wrong in 2012. For the unemployment rate, I wrote:
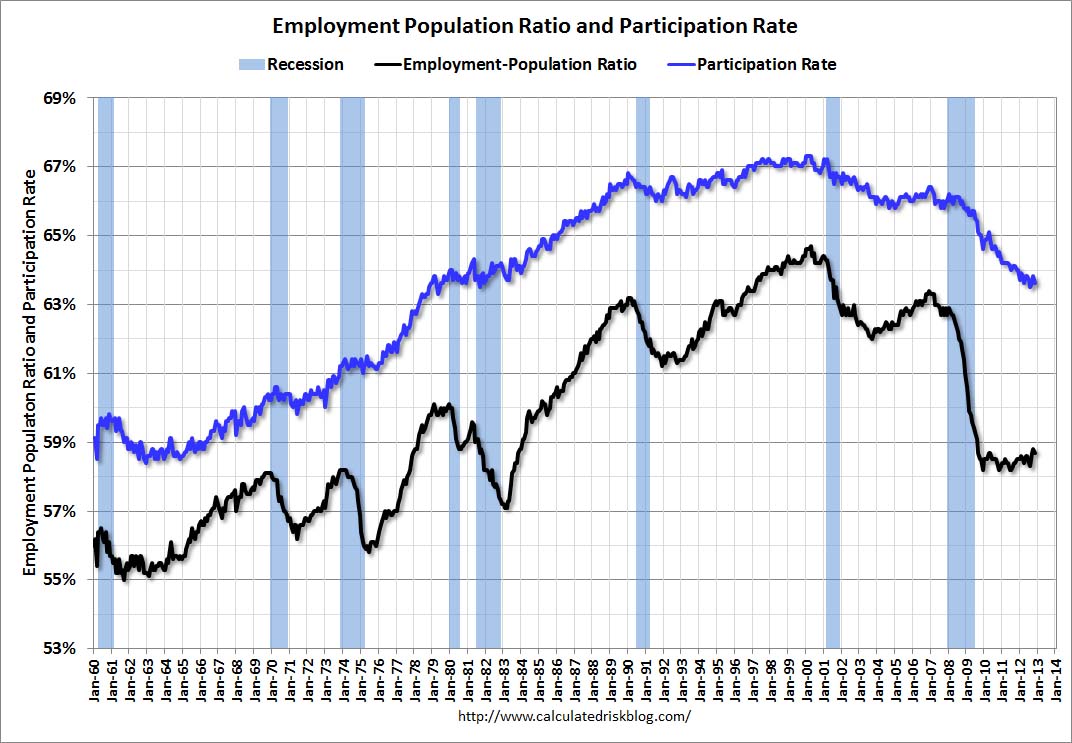
A couple of predictions.Even though I’ve been arguing that most of the decline in the participation rate over the last few years was due to changing demographics (as opposed to cyclical due to the recession), I still thought we’d see some slight increase in participation in 2012 – and that didn’t happen.
• The participation rate will rise slightly in 2012 and probably end the year in the 64.0% to 64.5% range.
• The unemployment rate will still be in the 8% to 9% range in December 2012.
 Click on graph for larger image.
The participation rate fell to 63.6% in November, and the unemployment rate declined to 7.7%. (Participation rate is the blue line. This is the percentage of the working age population in the labor force).
Since I was wrong on the participation rate, my forecast for the unemployment rate was too pessimistic.
I was also too pessimistic on foreclosures. I wrote:
Will foreclosure activity increase in 2012?The policy changes were announced, but the lenders focused more on modifications and short sales than foreclosures, and foreclosure activity has only picked up recently in some judicial foreclosure states.
This is a difficult question. There are several significant policy changes in the works: 1) a possible Mortgage Settlement, 2) HARP refinance (the automated program starts in March), and 3) a REO to rental program. It appears the overall goal of these policy changes is to reduce the large backlog of seriously delinquent loans while, at the same time, not flood the housing market with distressed homes.
My guess is the policy changes will all be announced in the next few months, and that foreclosure activity will increase significantly.
On employment I was close. I wrote:
My guess is private employment will increase around 150 to 200 thousand per month on average in 2012; about the same rate as in 2011.That was about right. The economy has added 1.7 million private sector jobs through November (over 1.8 million including the preliminary benchmark revision).
With over 13 million unemployed workers - and 5.6 million unemployed for more than 26 weeks - adding 2 million private sector jobs will not seem like much of job recovery for many Americans. Hopefully I'm too pessimistic.
A key forecast – that appears correct – was that the drag from state and local governments would end around mid-year. I wrote:
It is looking like there will be less drag from state and local governments in 2012, and that most of the drag will be over by the end of Q2 (end of FY 2012). This doesn't mean state and local government will add to GDP in the 2nd half of 2012, just that the drag on GDP and employment will probably end. Just getting rid of the drag will help.
 This graph shows total state and government payroll employment since January 2007. State and local governments lost 129,000 jobs in 2009, 262,000 in 2010, and 230,000 in 2011. So far in 2012, state and local governments have actually added a few jobs, and state and local government employment increased by 4,000 in November.
Note: The dashed line shows an estimate including the benchmark revision.
It appears most of the state and local government layoffs are over, however the Federal government layoffs are ongoing.
 This graph shows the contribution to percent change in GDP for residential investment and state and local governments since 2005.
The blue bars are for residential investment (RI), and RI was a significant drag on GDP for several years. Now RI has added to GDP growth for the last 6 quarters (through Q3 2012).
The red bars are for state and local governments. Although not as large a negative as the worst of the housing bust (and much smaller spillover effects), this decline has been relentless and unprecedented. The good news is the drag appears to be ending, and state and local governments actually added to GDP growth in Q3 2012 - for the first time since Q3 2009.
A few more forecasts - On monetary policy I wrote:
• I expect the Fed will change their communication strategy and add a likely future path of the Fed Funds rate to the quarterly economic forecasts.The Fed introduced the new communication strategy, and then changed it again near the end of 2012. They waited a little longer than I expected, and the FOMC announced QE3 in September.
• I think QE3 is likely, but more towards mid-year - and [timing] is data dependent.
And on inflation:
The bottom line is the inflation rate will probably stay low in 2012 with high unemployment and low resource utilization. I expect QE3 to be announced before mid-year, and that will probably keep the inflation rate near the Fed's target (as opposed to falling further). But I don't see inflation as a significant threat in 2012.The inflation outlook was correct. It is stunning how many analysts and policymakers have consistently been wrong on inflation for the last several years - and they still haven't changed their views or models!
And on Europe and the Euro:
So once again my guess is the euro will survive another year without losing any countries (Assuming a Greek debt deal). There will be plenty of blowups along the way, but I think the impact on the US economy will be fairly minimal.I was pessimistic on Europe, but less pessimistic than many others. And once again Europe made it through another year.
All and all the economy evolved about as I expected in 2012. I’ll try to post some forecasts for 2013 soon, but I’ll wait until we see the details of the fiscal agreement. Policy matters – and the key downside risk for the US economy in 2013 is rapid austerity.
"Fiscal Cliff": Weary eyes turn toward the Senate
by Calculated Risk on 12/24/2012 09:23:00 AM
From the NY Times: Search for Way Through Fiscal Impasse Turns to the Senate
Senators Kay Bailey Hutchison of Texas and Johnny Isakson of Georgia, both Republicans, implored Senate leaders to reach an accommodation with Mr. Obama when Congress returns on Thursday, even if that meant that taxes would go up for those with high incomes and that spending cuts would be put off.I think Isakson is correct about what will happen in January - that Congress will approve an agreement after the tax cuts expire so they can claim they are cutting taxes. Politics is weird.
“The president’s statement is right,” Mr. Isakson said Sunday on the ABC program “This Week.” “No one wants taxes to go up on the middle class."...
“The truth of the matter is, if we do fall off the cliff after the president is inaugurated, he’ll come back, propose just what he proposed yesterday in leaving Washington, and we’ll end up adopting it,” Mr. Isakson continued. “But why should we put the markets in such turmoil and the people in such misunderstanding or lack of confidence? Why not go ahead and act now?”
Sunday, December 23, 2012
Sunday Night Futures
by Calculated Risk on 12/23/2012 09:34:00 PM
Happy Holidays to all. There are no releases scheduled for Monday, and the U.S. markets will close early.
We will also get a two day break from the "fiscal cliff"!
Weekend:
• Summary for Week Ending Dec 21st
• Schedule for Week of Dec 23rd
The Asian markets are mostly green tonight, with both the Shanghai Composite and the Hang Seng up slightly.
From CNBC: Pre-Market Data and Bloomberg futures: the S&P futures are down 4 and DOW futures are down 30.
Oil prices have moved up a little recently withWTI futures at $88.46 per barrel and Brent at $108.80 per barrel. Gasoline prices are now near the low for the year.
Gasoline Prices near Low for Year, Expected to Increase
by Calculated Risk on 12/23/2012 05:39:00 PM
Another update on gasoline prices. It looks like prices will finish the year near the low, but probably increase soon.
From CNN: Gas prices slide, but the decline won't last, survey says
The average cost of a gallon of regular gasoline is $3.26, down 58 cents over the past 11 weeks, the Lundberg Survey found.Yesterday:
But that good news at the pump is unlikely to continue, says publisher Tribly Lundberg.
“Higher crude oil prices are translating into higher wholesale gasoline prices,” and retailers will need to pass them through, she says. Expect prices to jump 5 or 10 cents per gallon soon.
• Summary for Week Ending Dec 21st
• Schedule for Week of Dec 23rd
Here is a graph from Gasbuddy.com showing the roller coaster ride for gasoline prices. If you click on "show crude oil prices", the graph displays oil prices for WTI, not Brent; gasoline prices in most of the U.S. are impacted more by Brent prices.
| Orange County Historical Gas Price Charts Provided by GasBuddy.com |
DOT: Vehicle Miles Driven increased 0.3% in October
by Calculated Risk on 12/23/2012 01:39:00 PM
The Department of Transportation (DOT) reported Friday:
Travel on all roads and streets changed by +0.3% (0.9 billion vehicle miles) for October 2012 as compared with October 2011. Travel for the month is estimated to be 251.5 billion vehicle miles.Vehicle miles driven decreased in the Northeast (probably impacted by Hurricane Sandy) and increased in all other regions. The following graph shows the rolling 12 month total vehicle miles driven.
Cumulative Travel for 2012 changed by +0.6% (14.9 billion vehicle miles). The Cumulative estimate for the year is 2,464.5 billion vehicle miles of travel.
The rolling 12 month total is still moving sideways.
 Click on graph for larger image.
In the early '80s, miles driven (rolling 12 months) stayed below the previous peak for 39 months.
Currently miles driven has been below the previous peak for 59 months - and still counting.
The second graph shows the year-over-year change from the same month in the previous year.
 Gasoline prices were up in October compared to October 2011. In October 2012, gasoline averaged of $3.81 per gallon according to the EIA. Last year, prices in October averaged $3.51 per gallon.
 However, as I've mentioned before, gasoline prices are just part of the story. The lack of growth in miles driven over the last 5 years is probably also due to the lingering effects of the great recession (high unemployment rate and lack of wage growth), the aging of the overall population (over 55 drivers drive fewer miles) and changing driving habits of young drivers.
With all these factors, it may be years before we see a new peak in miles driven.
Fiscal Agreement Update
by Calculated Risk on 12/23/2012 10:33:00 AM
A few obvious points on the "fiscal cliff": 1) It is about the deficit shrinking too quickly next year, 2) there is no "drop dead" date and an agreement in early January still seems likely (the sites and TV stations with countdown times are embarrassing themselves), and 3) entitlements are not part of the "cliff" (although it was possible some changes might be part of an agreement).
Clearly there is going to be more austerity in the US at the Federal level next year. How much is unclear.
From Ezra Klein at Wonkblog: Obama’s “small deal” could lead to bigger tax increases
The talk in Washington now is about a “small deal.” That would likely include the Senate tax bill [to extend tax cuts for anyone making less than $250,000], some policy to turn off at least the defense side of the sequester and a handful of other policies to blunt or delay various parts of the fiscal cliff.This means the payroll tax cuts would expire (something I've expected) and tax rates for those making more than $250,000 would increase (also expected). There are many other issues - the medicare "doc" fix, mortgage debt relief, emergency unemployment benefits and on and on - that still need to be addressed.
That’s not a very good deal for the short-term health of the economy.
It is hard to guess the impact on the economy until we see the details.
And an interesting article from the NY Times: How Party of Budget Restraint Shifted to ‘No New Taxes,’ Ever
On a Saturday afternoon in October 1990, Senator Pete V. Domenici turned from a conversation on the Senate floor, caught the eye of a clerk by raising his right hand and voted in favor of a huge and contentious bill to reduce federal deficits. Then he put his hand back into his pocket and returned to the conversation.This shift in the Republican party (to no taxes ever) is why I think an early January agreement is likely. In my first post on the fiscal agreement, I wrote: "Given that the top marginal tax rate will increase - and that certain politicians can't vote for any bill with a tax increase - the agreement will probably be voted on in January after the Bush tax cuts expire." That may seem weird, but it is the current state of politics.
It was the end of an era, although no one knew it then. It was the last time any Congressional Republican has voted for higher income taxes.
...
In the early 1980s, majorities of Congressional Republicans voted for a pair of deficit deals orchestrated by President Ronald Reagan, even though tax increases accounted for more than 80 percent of the projected reductions.
Saturday, December 22, 2012
Unofficial Problem Bank list declines to 841 Institutions
by Calculated Risk on 12/22/2012 06:20:00 PM
Note: The first unofficial problem bank list was published in August 2009 with 389 institutions. The number of unofficial problem banks grew steadily and peaked at 1,002 institutions on June 10, 2011. The list has been declining since then.
This is an unofficial list of Problem Banks compiled only from public sources.
Here is the unofficial problem bank list for Dec 21, 2012.
Changes and comments from surferdude808:
As expected, the OCC released its enforcement actions through mid-November this week. For the week, there were eight removals and four additions to the Unofficial Problem Bank List. After the changes, the list holds 841 institutions with assets of $313.3 billion. A year ago, the list held 973 institutions with assets of $397.6 billion.Earlier:
The OCC terminated actions against National Bank of Kansas City, Overland Park, KS ($640 million); First Community Bank, National Association, Sugar Land, TX ($610 million); RiverWood Bank, Bemidji, MN ($156 million); The Midland National Bank of Newton, Newton, KS ($132 million); and Texas Republic Bank, National Association, Frisco, TX ($76 million).
The following three banks solved their problems by finding a healthier merger partner: The Community Bank, A Massachusetts Cooperative Bank, Brockton, MA ($317 million); Premier Bank, Tallahassee, FL ($272 million); and Stone County National Bank, Crane, MO ($81 million).
The OCC issued new actions against Los Alamos National Bank, Los Alamos, NM ($1.6 billion); Westbury Bank, West Bend, WI ($525 million); GCF Bank, Sewell, NJ ($314 million); and Home Loan Investment Bank, F.S.B., Warwick, RI ($196 million). Keen readers will know that Los Alamos National Bank is making its second appearance on the list after being removed in April 2012 when the OCC terminated an action issued in January 2010.
Next week, we look for the FDIC to release its actions through November but to shut it down as far as closings go. Wishing all a Merry Christmas and may you find a safe & sound bank under your tree.
• Summary for Week Ending Dec 21st
• Schedule for Week of Dec 23rd
Schedule for Week of Dec 23rd
by Calculated Risk on 12/22/2012 01:11:00 PM
Earlier:
• Summary for Week Ending Dec 21st
This will be a light week for economic data with the markets closing early on Monday, and closed on Tuesday, in observance of the Christmas Day holiday.
The key economic reports this week are the Case-Shiller house price indexes on Wednesday, and New Home sales on Thursday.
Happy Holidays to All. As usual, the Calculated Risk blog will be open.
SIFMA recommends US markets close at 2:00 PM ET in advance of the Christmas Day holiday.
US markets are closed in observance of the Christmas Day holiday.
Note: The Mortgage Bankers Association (MBA) will not release the mortgage purchase applications index this week. They will release two weeks of results on Thursday, January 3, 2013.
 9:00 AM: S&P/Case-Shiller House Price Index for October. Although this is the October report, it is really a 3 month average of August, September and October.
 This graph shows the nominal seasonally adjusted Composite 10 and Composite 20 indexes through September 2012 (the Composite 20 was started in January 2000).
The consensus is for a 4.1% year-over-year increase in the Composite 20 index (NSA) for September. The Zillow forecast is for the Composite 20 to increase 4.1% year-over-year, and for prices to increase 0.3% month-to-month seasonally adjusted.
10:00 AM: Richmond Fed Survey of Manufacturing Activity for December. The consensus is for a decrease to 6 for this survey from 9 in November (Above zero is expansion).
8:30 AM: The initial weekly unemployment claims report will be released. The consensus is for claims to increase to 365 thousand from 361 thousand last week. If correct, this would put the 4-week near the low for the year.
 10:00 AM: New Home Sales for November from the Census Bureau.
 This graph shows New Home Sales since 1963. The dashed line is the October sales rate.
The consensus is for an increase in sales to 375 thousand Seasonally Adjusted Annual Rate (SAAR) in November from 368 thousand in October.
10:00 AM: Conference Board's consumer confidence index for December. The consensus is for an decrease to 70.0 from 73.7 last month.
9:45 AM: Chicago Purchasing Managers Index for December. The consensus is for an increase to 51.0, up from 50.4 in November.
10:00 AM ET: Pending Home Sales Index for November. The consensus is for a 18% increase in the index
Summary for Week ending Dec 21st
by Calculated Risk on 12/22/2012 08:01:00 AM
The economic data released this week was encouraging. The November Personal Income and Outlays report suggests PCE might increase over 2% in Q4 - not great, but higher than most forecasts.
The housing numbers were solid. Housing starts are on pace to increase about 25% this year, and, for existing homes, inventory is down sharply and conventional sales up.
Other positives include Q3 GDP being revised up, the highest Architecture Billings Index since 2007, a rebound in the trucking index, a decline in the 4-week average of initial weekly unemployment claims, and another increase in builder confidence.
Manufacturing was still weak, but two of the three regional surveys were slightly better than expected. A negative was consumer sentiment, and that is probably related to the "fiscal cliff" debate in Washington that is still showing no signs of progress. I expect an agreement, but not until early January (although it could happen sooner). Next week will be a light week for economic data, but there are two key housing reports - new home sales and Case-Shiller house prices.
Here is a summary of last week in graphs:
• Housing Starts at 861 thousand SAAR in November
 Total housing starts were at 861 thousand (SAAR) in November, down 3.0% from the revised October rate of 888 thousand (SAAR).
A few key points:
• Housing starts are on pace to increase about 25% in 2012. This is a solid year-over-year increase, and residential investment is now making a positive contribution to GDP growth.
• Even after increasing 25% in 2012, the approximately 770 thousand housing starts this year will still be the 4th lowest on an annual basis since the Census Bureau started tracking starts in 1959 (the three lowest years were 2009 through 2011). Starts averaged 1.5 million per year from 1959 through 2000, and demographics and household formation suggests starts will return to close to that level over the next few years. That means starts will come close to doubling from the 2012 level.
• Residential investment and housing starts are usually the best leading indicator for economy. Nothing is foolproof, but this suggests the economy will continue to grow over the next couple of years.
This was slightly below expectations of 865 thousand starts in November.
• Existing Home Sales in November: 5.04 million SAAR, 4.8 months of supply
 The NAR reports: November Existing-Home Sales and Prices Maintain Uptrend
This graph shows existing home sales, on a Seasonally Adjusted Annual Rate (SAAR) basis since 1993.
Sales in November 2012 (5.04 million SAAR) were 5.9% higher than last month, and were 14.5% above the November 2011 rate.
The next graph shows the year-over-year (YoY) change in reported existing home inventory and months-of-supply. Since inventory is not seasonally adjusted, it really helps to look at the YoY change. Note: Months-of-supply is based on the seasonally adjusted sales and not seasonally adjusted inventory.
 Inventory decreased 22.5% year-over-year in November from November 2011. This is the 21st consecutive month with a YoY decrease in inventory.
Months of supply declined to 4.8 months in November.
This was above expectations of sales of 4.90 million. For existing home sales, the key number is inventory - and the sharp year-over-year decline in inventory is a positive for housing.
• Personal Income increased 0.6% in November, Spending increased 0.4%
 The BEA released the Personal Income and Outlays report for November.
This graph shows real PCE by month for the last few years. The dashed red lines are the quarterly levels for real PCE. Personal income increased more than expected in November and PCE for October was revised up.
The "two month method" for estimating Q4 PCE suggests PCE will increase close to 2.2% in Q4 - more growth than most expect - although this estimate is probably a little high because PCE was strong in September. Still better than expected, and we are already seeing some upward revisions to Q4 GDP forecasts.
• AIA: Architecture Billings Index increases in November, "Strongest conditions since end of 2007"
Note: This index is a leading indicator primarily for new Commercial Real Estate (CRE) investment.
 From AIA: Architecture Billings Index Signaling Gains for Fourth Straight Month
This graph shows the Architecture Billings Index since 1996. The index was at 53.2 in November, up from 52.8 in October. Anything above 50 indicates expansion in demand for architects' services.
This increase is mostly being driven by demand for design of multi-family residential buildings, but every building sector is now expanding. New project inquiries are also increasing. Note: This includes commercial and industrial facilities like hotels and office buildings, multi-family residential, as well as schools, hospitals and other institutions.
• Weekly Initial Unemployment Claims at 361,000
 "In the week ending December 15, the advance figure for seasonally adjusted initial claims was 361,000, an increase of 17,000 from the previous week's revised figure of 344,000."
The dashed line on the graph is the current 4-week average. The four-week average of weekly unemployment claims declined to 367,750.
The recent spike in the 4 week average was due to Hurricane Sandy as claims increased significantly in NY, NJ and other impacted areas. Now, as expected, the 4-week average is back to the pre-storm level.
Weekly claims were slightly higher than the 359,000 consensus forecast.
• Final December Consumer Sentiment declines to 72.9
 The final Reuters / University of Michigan consumer sentiment index for December declined to 72.9, down from the preliminary reading of 74.5, and was down from the November reading of 82.7.
This was below the consensus forecast of 75.0. The recent decline in sentiment is probably related to Congress and the so-called "fiscal cliff". This is similar to the sharp decline in 2011 when Congress threatened to force the US to default (not pay the bills).
I still think an agreement will be reached in early January - there is no drop dead date - but you never know.
Friday, December 21, 2012
Earlier: Chicago Fed National Activity Index improves, Kansas City Fed Mfg Survey shows contraction
by Calculated Risk on 12/21/2012 06:51:00 PM
A couple of reports from earlier this morning:
• The Chicago Fed released the national activity index (a composite index of other indicators): Economic Activity Increased in November
Led by improvements in production-related indicators, the Chicago Fed National Activity Index (CFNAI) increased to +0.10 in November from –0.64 in October. Two of the four broad categories of indicators that make up the index increased from October, but only the production and income category made a positive contribution to the index in November.This graph shows the Chicago Fed National Activity Index (three month moving average) since 1967.
The index’s three-month moving average, CFNAI-MA3, increased from –0.59 in October to –0.20 in November—its ninth consecutive reading below zero. November’s CFNAI-MA3 suggests that growth in national economic activity was below its historical trend. The economic growth reflected in this level of the CFNAI-MA3 suggests subdued inflationary pressure from economic activity over the coming year.
 Click on graph for larger image.
This suggests economic activity increased, but growth was still below trend in November.
According to the Chicago Fed:
What is the National Activity Index? The index is a weighted average of 85 indicators of national economic activity drawn from four broad categories of data: 1) production and income; 2) employment, unemployment, and hours; 3) personal consumption and housing; and 4) sales, orders, and inventories.• From the Kansas City Fed: Tenth District Manufacturing Activity Declined Further
A zero value for the index indicates that the national economy is expanding at its historical trend rate of growth; negative values indicate below-average growth; and positive values indicate above-average growth.
Tenth District manufacturing activity declined further in December, though by a smaller amount than in October or November. Factories’ production expectations were somewhat more optimistic than last month, but a higher share of firms plan to decrease employment in coming months. Approximately half of all contacts cited fiscal policy uncertainty as having impacted their hiring decisions. Price indexes mostly increased, particularly for future raw materials, with the increase driven heavily by food prices.This showed contraction, but the index was slightly better than expected.
The month-over-month composite index was -2 in December, up slightly from -6 in November and -4 in October ... The employment index decreased from 22 to 13 after rebounding solidly last month.
...
“We saw factory activity decline for the third straight month, which many firms blamed on the uncertainty created by the fiscal cliff talks", said [Chad Wilkerson, vice president and economist at the Federal Reserve Bank of Kansas City]. "Contacts still plan modest output expansion in the first half of 2012, but they now expect their employment to fall, before recovering later in the year.”


