 RSS Feed
 by Calculated Risk on 12/11/2012 10:00:00 AM
Tuesday, December 11, 2012
BLS: Job Openings "little changed" in October
From the BLS: Job Openings and Labor Turnover Summary
The number of job openings in October was 3.7 million, essentially unchanged from September.The following graph shows job openings (yellow line), hires (dark blue), Layoff, Discharges and other (red column), and Quits (light blue column) from the JOLTS.
...
The level of total nonfarm job openings in October was up from 2.4 million at the end of the recession in June 2009.
...
In October, the quits rate was unchanged for total nonfarm and total private, and little changed for government. The number of quits was 2.1 million in October compared to 1.8 million at the end of the recession in June 2009.
This series started in December 2000.
Note: The difference between JOLTS hires and separations is similar to the CES (payroll survey) net jobs headline numbers. This report is for October, the most recent employment report was for November.
 Click on graph for larger image.
Notice that hires (dark blue) and total separations (red and light blue columns stacked) are pretty close each month. This is a measure of turnover. When the blue line is above the two stacked columns, the economy is adding net jobs - when it is below the columns, the economy is losing jobs.
Jobs openings increased in October to 3.675 million, up from 3.547 million in September. The number of job openings (yellow) has generally been trending up, and openings are up about 8% year-over-year compared to October 2011.
Quits increased in October, and quits are up 4% year-over-year. These are voluntary separations. (see light blue columns at bottom of graph for trend for "quits").
The trend suggests a gradually improving labor market.
Trade Deficit increased in October to $42.2 Billion
by Calculated Risk on 12/11/2012 08:30:00 AM
The Department of Commerce reported:
[T]otal October exports of $180.5 billion and imports of $222.8 billion resulted in a goods and services deficit of $42.2 billion, up from $40.3 billion in September, revised. October exports were $6.8 billion less than September exports of $187.3 billion. October imports were $4.9 billion less than September imports of $227.6 billion.The trade deficit was smaller than the consensus forecast of $42.8 billion.
The first graph shows the monthly U.S. exports and imports in dollars through October 2012.
 Click on graph for larger image.
Both exports and imports decreased in October. US trade has slowed recently.
Exports are 9% above the pre-recession peak and up 1.0% compared to October 2011; imports are 4% below the pre-recession peak, and down 0.8% compared to October 2011.
The second graph shows the U.S. trade deficit, with and without petroleum, through October.
 The blue line is the total deficit, and the black line is the petroleum deficit, and the red line is the trade deficit ex-petroleum products.
Oil averaged $99.75 in October, up from $98.88 per barrel in September. The trade deficit with China increased to $29.5 billion in October, up from $28.1 billion in October 2011. Most of the trade deficit is still due to oil and China.
The trade deficit with the euro area was $8.9 billion in October, up from $7.1 billion in October 2011. It appears the eurozone recession is impacting trade.
Monday, December 10, 2012
Tuesday: Trade Deficit, JOLTS
by Calculated Risk on 12/10/2012 08:29:00 PM
The WSJ had a front page article on consumer spending yesterday: Consumer Spending Wobbles . The article starts with "U.S. consumer spending, a rare pillar of economic strength in recent months, is showing signs of weakening."
Tim Duy takes exception to both the "pillar of strength" and "signs of weakening": Wobbly Consumers?
I am not sure who exactly believed that the US consumer is a "rare pillar of economic strength," but I suspect they were somewhat delusional and perhaps overemphasizing the importance of consumer confidence surveys. I don't think the consumer is falling off the cliff, fiscal or otherwise, just yet, but household spending hasn't been exactly a source of strength for several months now. The fragility of the sector is not new.Dr. Duy has a number of charts supporting his view.
I don't think we will see a huge surge in spending, but I think Duy is correct and we will see continued growth in consumer spending. As I mentioned on Friday, seasonal retail hiring is solid, and that is usually a good sign. The LA Times noted it today: Holiday retail hiring could break record set 12 years ago
Here is the chart I posted last Friday:
 Click on graph for larger image.
Typically retail companies start hiring for the holiday season in October, and really increase hiring in November. Here is a graph that shows the historical net retail jobs added for October, November and December by year.
Retailers hired 465.5 thousand workers (NSA) net in November. The combined level for October and November is the highest ever. This suggests retailers are fairly optimistic about the holiday season. There is a decent correlation between retail hiring and retail sales, see: Retail: Seasonal Hiring vs. Retail Sales
As I wrote a month ago: "This is an old idea: Watch what they do, not what they say. And once again the retailers are hiring seasonal workers at a solid pace."
Tuesday economic releases:
• At 7:30 AM ET, the NFIB Small Business Optimism Index for November will be released. The consensus is for a decrease to 92.5 from 93.1 in October.
• At 8:30 AM, the Trade Balance report for October from the Census Bureau. The consensus is for the U.S. trade deficit to increase to $42.8 billion in October, up from from $41.5 billion in September. Export activity to Europe will be closely watched due to the European recession. Note: The strike at the ports of Long Beach and Los Angeles started in late November, and this report is for October.
• At 10:00 AM, the BLS will releases the Job Openings and Labor Turnover Survey for October. In general, job openings have generally been trending up.
• Also at 10:00 AM, the Monthly Wholesale Trade: Sales and Inventories for October. The consensus is for a 0.4% increase in inventories
Another question for the December economic prediction contest (Note: You can now use Facebook, Twitter, or OpenID to log in).
Weisenthal interview with Goldman's Jan Hatzius
by Calculated Risk on 12/10/2012 05:51:00 PM
From Joe Weisenthal at Business Insider: Goldman's Top Economist Explains The World's Most Important Chart, And His Big Call For The US Economy
Hatzius is bullish on the U.S. economy starting in the second half of 2013, because finally he expects private releveraging to occur at a nice clip, and to not be counteracted by a fiscal drag. Says Hatzius:The transcript of the interview is here, and check out the graph on Private Sector Surplus and Government Deficit.
"If the business sector is basically trying to reduce its financial surplus at a more rapid pace than the government is trying to reduce its deficit then you’re getting a net positive impulse to spending which then translates into stronger, higher, more income, and ultimately feeds back into spending."He has a specific explanation and numbers in mind, to explain the private sector's inclination to reduce its savings, and spend more.
"Since mid-2009, that surplus has gradually come down as businesses and households have gotten closer to where they need to be from a long-term balance sheet perspective. They’ve paid down debt, they’ve eliminated the excess supply of housing, and that’s basically allowed them to reduce the financial surpluses that they run. They’re still running large surpluses – still 5.5 to 7 percent of GDP, but they’re no longer as large. We expect those figures to come down as the balance sheet adjustment process makes further strides and that’s an underlying source of boost to the economy that’s happening on the one side."Of course, Hatzius's bullishness on the private sector's impulse to spend more is tempered by the fact that we're going to see some form of austerity early in 2013, even if there's a deal on the fiscal cliff.
Lawler: Preliminary Table of Short Sales and Foreclosures for Selected Cities in November
by Calculated Risk on 12/10/2012 03:55:00 PM
Economist Tom Lawler sent me the following preliminary table today of short sales and foreclosures for a few selected cities in November.
There will be more cities added soon.
For all of these cities, the percentage of foreclosures is down from a year ago. The percentage of short sales is up in Las Vegas and Reno, but down in Phoenix and in the mid-Atlantic area.
Look at the overall percent of distressed sales (combined foreclosures and short sales). There is a large year-over-year decline in distressed sales in all of these cities.
I think the two key numbers for real estate markets are 1) inventory, and 2) the percent of conventional sales (non-distressed sales). Inventory is falling, and the percent of conventional sales is increasing - and those are positive signs.
| Short Sales Share | Foreclosure Sales Share | Total "Distressed" Share | ||||
|---|---|---|---|---|---|---|
| 12-Nov | 11-Nov | 12-Nov | 11-Nov | 12-Nov | 11-Nov | |
| Las Vegas | 41.2% | 26.8% | 10.7% | 46.0% | 51.9% | 72.8% |
| Reno | 40.0% | 32.0% | 12.0% | 38.0% | 52.0% | 70.0% |
| Phoenix | 23.2% | 29.8% | 12.9% | 29.8% | 36.1% | 59.6% |
| Mid-Atlantic (MRIS) | 11.9% | 13.7% | 8.7% | 14.2% | 20.6% | 27.9% |
Las Vegas Real Estate: Sales and Inventory decreased in November
by Calculated Risk on 12/10/2012 01:13:00 PM
This is a key distressed market to follow since Las Vegas has seen the largest price decline of any of the Case-Shiller composite 20 cities.
From the GLVAR: GLVAR November 2012 Housing Statistics
GLVAR said the total number of local homes, condominiums and townhomes sold in November was 3,293. That’s down from 3,651 in October and down from 3,883 total sales in November 2011. Compared to October, single-family home sales during November decreased by 10.1 percent, while sales of condos and townhomes decreased by 8.5 percent. Compared to one year ago, home sales were down 15.1 percent, while condo and townhome sales were down 15.6 percent.A few key points:
...
The total number of homes listed for sale on GLVAR’s Multiple Listing Service declined in November, with a total of 15,637 single-family homes listed for sale at the end of the month. That’s down 6.8 percent from 16,778 homes listed for sale at the end October and down 24.9 percent from 2011. ...
The number of available homes listed for sale without any sort of pending or contingent offer also decreased from the previous month. By the end of November, GLVAR reported 3,849 single-family homes listed without any sort of offer. That’s down 5.6 percent from 4,079 such homes listed in October and down 60.6 percent from one year ago.
...
Meanwhile, 41.2 percent of all existing local homes sold during November were short sales. That’s down from 44.7 percent in October and from a record 44.8 percent in September, but still up from 26.8 percent one year ago. Continuing a trend of declining foreclosure sales, bank-owned homes accounted for 10.7 percent of all existing home sales in November, down from 11.6 percent in October.
• Inventory decreased in November, and inventory is down 24.9% from November 2011. For single family homes without contingent offers, inventory is down sharply from a year ago (down 60.6% year-over-year).
• Short sales are almost four times foreclosures now. The GLVAR reported 41.2% of sales were short sales, and only 10.7% foreclosures. We've seen a shift from foreclosures to short sales in most areas (not just in areas with new foreclosure laws). Note: If the Mortgage Debt Relief Act of 2007 is not extended, the number of short sales could decline significantly in 2013.
• The percent distressed sales was extremely high at 51.9% in November (short sales and foreclosures), but down from 56.3% in October. This means conventional sales are finally almost half the market in Las Vegas.
Overall these are signs of a distressed market slowly improving. The decline in overall sales is because of fewer distressed sales (Las Vegas had a record number of real estate sales last year, even higher than at the peak of the bubble in 2005, because of all the distressed sales!).
The numbers to watch are inventory (and non-contingent inventory), and the percent conventional sales. Inventory is down sharply, and conventional sales are increasing.
Q3 2012: Mortgage Equity Withdrawal strongly negative
by Calculated Risk on 12/10/2012 10:15:00 AM
Note: This is not Mortgage Equity Withdrawal (MEW) data from the Fed. The last MEW data from Fed economist Dr. Kennedy was for Q4 2008.
The following data is calculated from the Fed's Flow of Funds data and the BEA supplement data on single family structure investment. This is an aggregate number, and is a combination of homeowners extracting equity - hence the name "MEW", but there is little MEW right now - and normal principal payments and debt cancellation.
For Q3 2012, the Net Equity Extraction was minus $112 billion, or a negative 3.8% of Disposable Personal Income (DPI). This is not seasonally adjusted.
 Click on graph for larger image in new window.
This graph shows the net equity extraction, or mortgage equity withdrawal (MEW), results, using the Flow of Funds (and BEA data) compared to the Kennedy-Greenspan method.
There are smaller seasonal swings right now, perhaps because there is a little actual MEW (this is heavily impacted by debt cancellation right now).
The Fed's Flow of Funds report showed that the amount of mortgage debt outstanding declined sharply in Q3. Mortgage debt has declined by $1.15 trillion since the peak. This decline is mostly because of debt cancellation per foreclosures and short sales, and some from modifications. There has also been some reduction in mortgage debt as homeowners paid down their mortgages so they could refinance.
For reference:
Dr. James Kennedy also has a new method for calculating equity extraction: "A Simple Method for Estimating Gross Equity Extracted from Housing Wealth". Here is a companion spread sheet (the above uses my simple method).
For those interested in the last Kennedy data included in the graph, the spreadsheet from the Fed is available here.
The Italian Job
by Calculated Risk on 12/10/2012 09:10:00 AM
From the Financial Times: Monti decision to go rattles markets
Italy’s government borrowing costs jumped and its stock market fell sharply on Monday after Mario Monti’s weekend decision to resign as prime minister threatened to send a new shudder of uncertainty into the eurozone’s most vulnerable economies.According to Bloomberg, the yield on the Italian 2-year increased sharply to 2.32%, and the 10 year yield increased to 4.8%. A large jump, but still lower than a few months ago.
excerpt with permission
From the NY Times: Next Act in Italian Drama: Exit Monti the Technocrat, Enter Monti the Politician?
Mr. Monti’s surprise announcement on Saturday raised the prospect of more political uncertainty and market turmoil for Italy, Europe’s fourth-largest economy, in what is expected to be a gloves-off political campaign. But it also increased the possibility that Mr. Monti might run as a candidate — a shift from the role of an apolitical leader — who is open to governing if no clear winner emerges from elections expected as soon as February.
Three years into Europe’s debt crisis, the new developments in Italy underscored the clash between the economically sound and the politically sustainable. While Mr. Monti, an economist and a former European commissioner, has reassured investors and helped keep Italian borrowing rates down, the tax increases and spending cuts passed by his Parliament have eroded lawmakers’ standing with voters.
Sunday, December 09, 2012
Sunday Night Futures
by Calculated Risk on 12/09/2012 08:30:00 PM
Weekend:
• Labor Force Participation Rate Update
• FOMC Projections Preview
• Summary for Week Ending Dec 7th
• Schedule for Week of Dec 9th
The Asian markets are mostly green tonight, with the Nikkei up 0.2%.
From CNBC: Pre-Market Data and Bloomberg futures: the S&P futures are up slightly and DOW futures are up 15.
Oil prices are mostly moving sideways with WTI futures at $86.26 per barrel and Brent at $107.41 per barrel. Gasoline prices are now near the low for the year.
Here is a graph from Gasbuddy.com showing the roller coaster ride for gasoline prices. If you click on "show crude oil prices", the graph displays oil prices for WTI, not Brent; gasoline prices in most of the U.S. are impacted more by Brent prices.
| Orange County Historical Gas Price Charts Provided by GasBuddy.com |
Three more questions this week for the December economic prediction contest (Note: You can now use Facebook, Twitter, or OpenID to log in).
Labor Force Participation Rate Update
by Calculated Risk on 12/09/2012 04:08:00 PM
I've written extensively about the participation rate, see: Understanding the Decline in the Participation Rate and Further Discussion on Labor Force Participation Rate.
A key point: The recent decline in the participation rate was expected, and most of the decline in the participation rate was due to changing demographics, as opposed to economic weakness.
Here is an update to a few graphs I've posted before. Tracking the participation rate for various age groups monthly is a little like watching grass grow, but the trends are important.
 Click on graph for larger image in graph gallery.
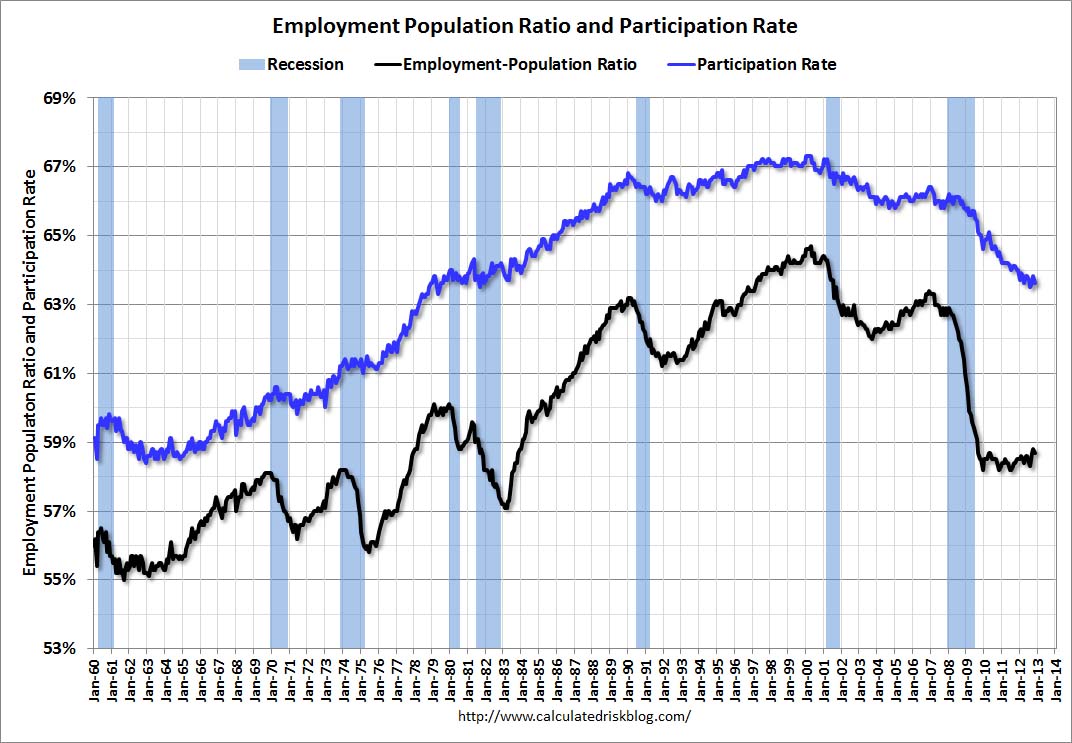
Here is a repeat of the graph I posted Friday showing the participation rate and employment-to-population ratio.
The Labor Force Participation Rate decreased to 63.6% in November (blue line. This is the percentage of the working age population in the labor force.
Here is a look at some of the long term trends (updating graphs through November 2012):
 This graph shows the changes in the participation rates for men and women since 1960 (in the 25 to 54 age group - the prime working years).
The participation rate for women increased significantly from the mid 30s to the mid 70s and has mostly flattened out. The participation rate for women was unchanged in November at 74.7%.
The participation rate for men decreased from the high 90s decades ago, to 88.2% in November 2012.
This is the lowest level recorded for prime working age men.
 This graph shows that participation rates for several key age groups.
There are a few key long term trends:
• The participation rate for the '16 to 19' age group has been falling for some time (red). This was unchanged in November at 34.7%, up from the record low of 33.5% in February 2011.
• The participation rate for the 'over 55' age group has been rising since the mid '90s (purple), although this has stalled out a little recently.
• The participation rate for the '20 to 24' age group fell recently too (more education before joining the labor force). This appears to have stabilized.
 The third graph shows the participation rate for several over 55 age groups. The red line is the '55 and over' total seasonally adjusted. All of the other age groups are Not Seasonally Adjusted (NSA).
The participation rate is generally trending up for all older age groups, and the 55 and over participation rate is at a record high.
The increase in participation of older cohorts might push up the '55 and over' participation rate over the next few years, however eventually the 'over 55' participation rate will start to decline as the oldest baby boomers move into even older age groups.
I've been expecting some small bounce back in the participation rate, but I don't think the bounce back will be huge - and that means it is taking fewer jobs than some expected to lower the unemployment rate. This will be a key number to watch over the next few years.
Earlier on employment:
• November Employment Report: 146,000 Jobs, 7.7% Unemployment Rate
• Employment Report: More Positives than Negatives
• All Employment Graphs


