 RSS Feed
 by Calculated Risk on 11/10/2012 08:05:00 AM
Saturday, November 10, 2012
Summary for Week Ending Nov 9th
The big event this week was the presidential election. For economic data, this was a pretty light week.
The key report was the trade deficit that showed exports increased more than imports in September, and the trade deficit declined. Also Consumer sentiment has increased to pre-recession levels.
Other data was a little weak: The ISM service index declined in October, and job openings declined in September.
Next week will be busier.
Here is a summary of last week in graphs:
• Trade Deficit declined in September to $41.5 Billion
 Click on graph for larger image.
The first graph shows the monthly U.S. exports and imports in dollars through September 2012.
Both exports and imports increased in September. Exports are at a new high. The trade deficit was smaller than the consensus forecast of $45.4 billion.
Exports are 13% above the pre-recession peak and up 3.5% compared to September 2011; imports are 1% below the pre-recession peak, and up about 1.5% compared to September 2011.
 The second graph shows the U.S. trade deficit, with and without petroleum, through September.
The blue line is the total deficit, and the black line is the petroleum deficit, and the red line is the trade deficit ex-petroleum products.
Oil averaged $98.88 in September, up from $94.36 per barrel in August. The trade deficit with China increased to $29.1 billion in September, up from $28.0 billion in September 2011. Most of the trade deficit is due to oil and China.
This suggests a small upward revision to Q3 GDP.
• ISM Non-Manufacturing Index decreases in October
 The October ISM Non-manufacturing index was at 54.2%, down from 55.1% in September. The employment index increased in October to 54.9%, up from 51.1% in September. Note: Above 50 indicates expansion, below 50 contraction.
This graph shows the ISM non-manufacturing index (started in January 2008) and the ISM non-manufacturing employment diffusion index.
This was below the consensus forecast of 54.9% and indicates slower expansion in October than in September. The internals were mixed with the employment index up, but new orders down.
• BLS: Job Openings "essentially unchanged" in September, Up year-over-year
 This graph shows job openings (yellow line), hires (dark blue), Layoff, Discharges and other (red column), and Quits (light blue column) from the JOLTS.
Notice that hires (dark blue) and total separations (red and light blue columns stacked) are pretty close each month. This is a measure of turnover. When the blue line is above the two stacked columns, the economy is adding net jobs - when it is below the columns, the economy is losing jobs.
Jobs openings decreased in September to 3.561 million, down slightly from 3.661 million in August. The number of job openings (yellow) has generally been trending up, and openings are only up about 2% year-over-year compared to September 2011.
Quits decreased in September, and quits are down slightly year-over-year. These are voluntary separations. (see light blue columns at bottom of graph for trend for "quits").
• Weekly Initial Unemployment Claims decline to 355,000
 The DOL reported: "In the week ending November 3, the advance figure for seasonally adjusted initial claims was 355,000, a decrease of 8,000 from the previous week's unrevised figure of 363,000. The 4-week moving average was 370,500, an increase of 3,250 from the previous week's unrevised average of 367,250."
The dashed line on the graph is the current 4-week average. The four-week average of weekly unemployment claims increased to 370,500. This is about 7,000 above the cycle low for the 4-week average of 363,000 in March.
Mostly moving sideways this year, but near the cycle bottom.
SPECIAL NOTE: Due to Hurricane Sandy, we will probably see an increase in initial unemployment claims over the next few weeks. The decline this week was probably because some people in a few states - like New York and New Jersey - were not able to file claims immediately.
• Fannie, Freddie, FHA REO inventory declined in Q3
 This graph shows the REO inventory for Fannie, Freddie and the FHA (FHA for August). This was the seventh straight quarterly decline in the "F's" REO inventory, and total "F" REO was down 12% from a year ago.
 This is only a portion of the total REO. There is also REO for private-label MBS, FDIC-insured institutions, VA and more. REO has been declining for those categories too.
The second graph shows the same data with Private Label Securities added.
 From Tom Lawler:
 Here is a chart showing some history of SF REO holdings of Fannie, Freddie, FHA, and private-label securities (from Barclays Capital). Note that FHA has not yet released its report to the FHA commissioner for September (everything there may be focused on the FY 2012 Actuarial Review due out next week, which could be a doozy!), and the number for the end of Q3/2012 (38,187) is actually the August inventory number.
More from CR: When the FDIC's Q3 quarterly banking profile is released in a couple of weeks, I'm sure Tom will add an estimate for REO at FDIC-insured institutions. This is not all REO: In addition to the FDIC-insured institution REO, this excludes non-FHA government REO (VA, USDA, etc.), credit unions, finance companies, non-FDIC-insured banks and thrifts, and a few other categories.
• Preliminary November Consumer Sentiment increases to 84.9
 The preliminary Reuters / University of Michigan consumer sentiment index for November increased to 84.9 from the October reading of 82.6. This was the highest level since July 2007 - before the recession started.
This was above the consensus forecast of 83.1. Overall sentiment is still somewhat weak - probably due to a combination of the high unemployment rate and the sluggish economy - but consumer sentiment has been improving recently.
However - remember - that sharp decline in sentiment in August 2011 was due to the threat of default and the debt ceiling debate. Hopefully we will not see that again early next year before the fiscal slope is resolved.
Friday, November 09, 2012
Las Vegas Real Estate: Sales increase slightly in October
by Calculated Risk on 11/09/2012 06:02:00 PM
This is a key distressed market to follow since Las Vegas has seen the largest price decline of any of the Case-Shiller composite 20 cities.
From the GLVAR: GLVAR reports increasing local home sales, as prices begin to level off heading into winter
GLVAR said the total number of local homes, condominiums and townhomes sold in October was 3,651. That’s up from 3,298 in September, but down from 3,881 total sales in October 2011.A few key points:
...
The total number of homes listed for sale on GLVAR’s Multiple Listing Service bounced back in October, with a total of 16,778 single-family homes listed for sale at the end of the month. That’s up from 16,775 homes listed for sale at the end September, but down 21.9 percent from one year ago. ...
The number of available homes listed for sale without any sort of pending or contingent offer also increased from the previous month. By the end of October, GLVAR reported 4,079 single-family homes listed without any sort of offer. That’s up 3.4 percent from 3,943 such homes listed in September, but still down 60.6 percent from one year ago.
...
Meanwhile, 44.7 percent of all existing local homes sold during October were short sales. That’s down slightly from a record 44.8 percent in September, but still up dramatically from 25.4 percent one year ago. Continuing a trend of declining foreclosure sales in recent months, bank-owned homes accounted for 11.6 percent of all existing home sales in October, down from 13.6 percent in September.
...
"The biggest thing I noticed in this month’s report is that the inventory of homes available for sale went up. We sold fewer homes in October than we listed,” GLVAR President Kolleen Kelley explained. “As inventory goes up, you’re not going to see prices go up as much. It’s supply and demand.”
• Inventory increased slightly in September, and inventory is down 21.9% from October 2011. However, for single family homes without contingent offers, inventory is still down sharply from a year ago (down 60.6% year-over-year).
• Short sales are almost four times foreclosures now. The GLVAR reported 44.7% of sales were short sales, and only 11.6% foreclosures. We've seen a shift from foreclosures to short sales in most areas (not just in areas with new foreclosure laws).
• The percent distressed sales was extremely high at 56.3% in September (short sales and foreclosures), but down from 58.4% in September.
• There is a push to complete short sales, from the article:
Kelley said many homeowners have been rushing to short-sell their homes by the end of 2012, when the Mortgage Forgiveness Debt Relief Act is set to expire unless Congress acts to extend it. If Congress does not extend this law by Dec. 31, she said any amount of money a bank writes off in agreeing to sell a home as part of a short sale will become taxable when sellers file their income taxes.
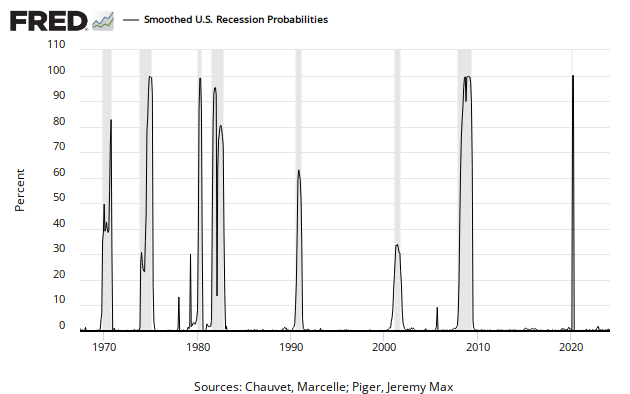
The Recession Probability Chart
by Calculated Risk on 11/09/2012 02:22:00 PM
One of the most frequent questions I receive via email is: "Is another recession starting?" There are quite a few people who have been calling a recession recently (ECRI has called several recessions since August 2011 or so). They still have time on their most recent calls, but their earlier calls were wrong.
Part of the problem in forecasting right now is the sluggish recovery has ups and downs, and each down looks like the start of a recession to some models. Another problem is that negative news sells ... and there is an entire industry that sells doom and gloom. And that industry has expanded significantly in recent years ...
There is a recession probability chart from the St Louis Fed making the rounds today. The chart shows that the odds of a recession have increased recently (ht Bruce).
 Click on graph for larger image in new window.
Here is the chart from FRED at the St Louis Fed: "This recession probabilities series from University of Oregon economist Jeremy Piger is a monthly measure of the probability of recession in the United States obtained from a dynamic-factor Markov-switching model applied to 4 monthly coincident variables: non-farm payroll employment, the index of industrial production, real personal income excluding transfer payments, and real manufacturing and trade sales."
However there are reasons this shouldn't be interpreted as indicating a new recession. Jeff Miller at a Dash of Insight does the heavy lifting: Debunking the 100% Recession Chart. Jeff actually read the underlying papers - and contacted the authors. Please read his post for more.
My view is the economy is not currently in a recession, and that economic growth will pickup in 2013, although there are downside risks from Europe and the potential for a policy mistake in the US (no agreement on the fiscal bluff). As I've noted before, I see two key reason for a pickup in the US: 1) I expect residential investment to increase next year (the key leading indicator for the economy), 2) I think the drag from state and local governments will subside.
Of course I could be wrong, but currently I'm not even on recession watch!
A few thoughts on Fiscal Agreement
by Calculated Risk on 11/09/2012 12:33:00 PM
A personal note: I'd like to thank Governor Romney for his personal sacrifice. I believe he is a decent man, and I think everyone should appreciate the sacrifice all candidates made in running for office (I'd never do it, even at the local level). I also think President Obama is a decent man, and I remain optimistic about the future.
From Reuters: Obama to Make Statement on Economy Friday
The president is likely to discuss looming tax increases and government spending cuts — the so-called fiscal cliff — that would go into effect early next year unless Congress acts to prevent them. He is due to make the statement from the East Room of the White House at 1:05 p.m.As I've noted before, there is no "cliff" and January 1st is not a drop dead date. Note: In the comments, Jackdawracy suggests "Fiscal Hillock" and energyecon suggests "fiscal bluff".
There are a few things that appear certain (but you never know with policy):
1) The top marginal tax rate will increase from 35% to 39.6%. The details still need to be worked out (at what income the highest bracket will start, and what happens with dividends and capital gains). The it is pretty clear the top tax rate will increase.
2) The payroll tax cut is probably going away. This was the 2% payroll tax reduction that workers received in 2010 and 2011. For a family with a $50,000 per year income, this is a tax increase of about $20 per week.
3) The Alternative Minimum Tax (AMT) relief will probably be extended (it is every year).
4) Given that the top marginal tax rate will increase - and that certain politicians can't vote for any bill with a tax increase - the agreement will probably be voted on in January after the Bush tax cuts expire.
I doubt we will see the current scheduled defense spending cuts (aka "sequestration"), but there will probably be some defense cuts.
Probably the most controversial issue, and least economically important (minimal drag on economy) is raising the top marginally tax rate. High income earners have a propensity to save, and raising their marginal rate a few percentage points will not have much impact on the economy - but it will significantly reduce the deficit.
 Click on graph for larger image in new window.
This graph shows the top marginal tax rate since 1920. There are many details missing (like the level of the top tax bracket). The current proposal is to raise the top tax bracket back to 39.6% from 35% - the same level as in the '90s.
Back in 1993, many analysts (like Larry Kudlow) argued raising the tax rate from 31% to 39.6% would take the economy into a deep recession or even depression. They were wrong. The other parts of the "fiscal cliff" are more important for the economy in the short run than the top tax rate.
One of the arguments against raising the top tax rate is that it will be a disincentive to start new companies. Wrong again. Note the top marginal tax rate in the 1970s - it was 70%. That was when Bill Gates started Microsoft, Steve Jobs started Apple and ... many others (Thomas Peterffy, who founded Interactive Brokers and ran many political ads recently started his company in 1977 with a 70% top tax rate). I've met with many entrepreneurs over the years, and none of them even mentioned the top personal tax rate - they were too focused on their company, products and market.
Hopefully this fiscal issue will be resolved without much disruption, and my guess is some sort of compromise will be reached early in 2013.
Preliminary November Consumer Sentiment increases to 84.9
by Calculated Risk on 11/09/2012 09:55:00 AM
Click on graph for larger image.
The preliminary Reuters / University of Michigan consumer sentiment index for November increased to 84.9 from the October reading of 82.6. This was the highest level since July 2007 - before the recession started.
This was above the consensus forecast of 83.1. Overall sentiment is still somewhat weak - probably due to a combination of the high unemployment rate and the sluggish economy - but consumer sentiment has been improving recently.
However - remember - that sharp decline in sentiment in August 2011 was due to the threat of default and the debt ceiling debate. Hopefully we will not see that again early next year before the fiscal slope is resolved.
Thursday, November 08, 2012
Friday: Consumer sentiment
by Calculated Risk on 11/08/2012 09:12:00 PM
Tim Duy remains depressed about Europe: Europe Back In The Spotlight
Europe faded from the news over the summer. European Central Bank President Mario Draghi's shift to allowing his institution to serve as a lender of last resort calmed nerves and took the worst case scenario of imminent breakup off the table even though the program has yet to be implemented. With crisis again averted, market participants shifted their focus to the Federal Reserve and the US elections.I wonder when we will see a headline reading "Europe is Back", instead of "Europe Back in he Spotlight"? Not any time in the near future. Very depressing.
In the meantime, economic conditions in Europe continued to slowly deteriorate. We are now looking at another year of dismal growth in the Eurozone. This crisis seems to have no end in sight.
...
Bottom Line: Yes, I remain a Euroskeptic. Maybe it is just in my blood. Europe still looks ugly, and will continue to be so for the next year at least (I tend to think wave after wave of austerity will push the Eurozone into a multi-year malaise, but let's just take it one year at a time for now). I expect European troubles will continue to cloud the global outlook and vex the earning plans of large multinationals for the time being.
Friday:
• At 8:30 AM, Import and Export Prices for October. The consensus is no change in import prices.
• At 9:55 AM, the Reuter's/University of Michigan's Consumer sentiment index (preliminary for November). The consensus is for sentiment to increase slightly to 83.3.
• At 10:00 AM, the Monthly Wholesale Trade: Sales and Inventories report for September will be released. The consensus is for a 0.3% increase in inventories.
New CBO report on "Fiscal Cliff"
by Calculated Risk on 11/08/2012 05:12:00 PM
Note: My baseline forecast assumes a compromise on the fiscal slope (more of a "slope" than a "cliff", and January 1st is not a drop dead date). My current guess is an agreement will be reached AFTER January 1st - so that the Bush tax cuts can expire and certain politicians can claim they didn't vote to raise taxes (silly, but that is politics).
I expect the relief from the Alternative Minimum Tax (AMT) will be extended, the tax cuts for low to middle income families will be reenacted, and that most, but not all, of the defense spending cuts will be reversed (aka "sequestration"). However I think the payroll tax cut will probably not be extended, and tax rates on high income earners will increase a few percentage points to the Clinton era levels.
It wasn't worth spending much time on this before the election, but now the details will be important. As the CBO notes, a policy mistake could lead to economic contraction (a new recession), but I think some reasonable agreement is likely.
From the Congressional Budget Office: CBO Releases a Report on the Economic Effects of Policies Contributing to Fiscal Tightening in 2013
Significant tax increases and spending cuts are slated to take effect in January 2013, sharply reducing the federal budget deficit and causing, by CBO’s estimates, a decline in the nation’s economic output and an increase in unemployment. What would be the economic effects of eliminating various components of that fiscal tightening—or what some term the fiscal cliff?
To answer that question, today CBO released a report—Economic Effects of Policies Contributing to Fiscal Tightening in 2013. This report provides additional details about the agency’s estimates—originally released in its August report An Update to the Budget and Economic Outlook: Fiscal Years 2012–2022—of the economic effects of reducing fiscal tightening.
As CBO projected in August, the sharp reduction in the deficit will cause the economy to contract but will also put federal debt on a path more likely to be sustainable over time. If certain scheduled tax increases and spending cuts would not take effect and current tax and spending policies were instead continued, the economy would grow in the short term, but the government’s debt would continue to increase.
This report focuses on the economic effects of eliminating individual components of the changes in policy that are scheduled to take effect: the automatic reductions in defense spending; the automatic reductions in nondefense spending and the scheduled reductions in Medicare’s payment rates for physicians; the extension of certain expiring tax cuts and indexation of the alternative minimum tax; and extension of the payroll tax cut and emergency unemployment benefits.
Eliminating the first three of those changes—which would capture all of the policies included in CBO’s “alternative fiscal scenario”—would boost real (inflation-adjusted) gross domestic product (GDP) by about 2¼ percent by the end of 2013. Eliminating all of those changes would boost real GDP in 2013 by about 3 percent. The bulk of that impact would stem from changes in tax policies, CBO estimates
Lawler: REO inventory of "the F's" and PLS
by Calculated Risk on 11/08/2012 04:00:00 PM
CR Note: Yesterday I posted a graph of REO inventory (lender Real Estate Owned) for the Fs (Fannie, Freddie and the FHA). Economist Tom Lawler has added estimates for PLS (private label securities). Note that the FHA data was for August.
From Tom Lawler:
Here is a chart showing some history of SF REO holdings of Fannie, Freddie, FHA, and private-label securities (from Barclays Capital). Note that FHA has not yet released its report to the FHA commissioner for September (everything there may be focused on the FY 2012 Actuarial Review due out next week, which could be a doozy!), and the number for the end of Q3/2012 (38,187) is actually the August inventory number.
Click on graph for larger image in new window.
More from CR: When the FDIC's Q3 quaterly banking profile is released in a couple of weeks, I'm sure Tom will add an estimate for REO at FDIC-insured institutions. This is not all REO: In addition to the FDIC-insured institution REO, this excludes non-FHA government REO (VA, USDA, etc.), credit unions, finance companies, non-FDIC-insured banks and thrifts, and a few other categories.
REO inventories have declined over the last year. This was a combination of more sales and fewer acquisitions.
Also note Tom's comment on the forthcoming FHA FY 2012 Actuarial Review. That will be interesting.
LPS: Mortgage Delinquency Rates increased in September
by Calculated Risk on 11/08/2012 02:17:00 PM
LPS released their Mortgage Monitor report for September today. According to LPS, 7.40% of mortgages were delinquent in September, up from 6.87% in August, and down from 7.72% in September 2011.
LPS reports that 3.87% of mortgages were in the foreclosure process, down from 4.04% in August, and down from 4.18% in September 2011.
This gives a total of 11.27% delinquent or in foreclosure. It breaks down as:
• 2,170,000 properties that are 30 or more days, and less than 90 days past due, but not in foreclosure.
• 1,530,000 properties that are 90 or more days delinquent, but not in foreclosure.
• 1,940,000 loans in foreclosure process.
For a total of 5,640,000 loans delinquent or in foreclosure in August. This is up from 5,450,000 last month, and down from 6,130,000 in September 2011.
This following graph shows the total delinquent and in-foreclosure rates since 1995.
 Click on graph for larger image.
The total delinquency rate has generally been trending down, although there was a pretty sharp increase in September.
Note: A normal rate is probably in the 4% to 5% range, so there is a long ways to go.
The in-foreclosure rate was at 3.87%. There are still a large number of loans in this category (about 1.9 million), but it appears this is starting to decline.
 The second graph (slide 18 from LPS) shows the number of delinquencies by stage.
From LPS:
The September Mortgage Monitor report released by Lender Processing Services looked at the significant month-over-month increase in the nation’s delinquency rates – up 7.7 percent from August, and representing the largest monthly increase since 2008. While September has historically been marked by seasonal rises in delinquencies, this was still a marked upturn. However, according to LPS Applied Analytics Senior Vice President Herb Blecher, it is important to view the month’s data in its proper context.As Blecher notes, this is just one month of data, and there might be some seasonal issues.
“September’s increase in the delinquency rate was indeed significant, but the overall trend is still one of improvement,” Blecher said. “Despite the monthly jump, delinquencies are down 30 percent from their January 2010 peak, and our analysis revealed some interesting factors related to the spike. Of course, one month’s data does not indicate a trend. We will be monitoring these factors over the coming months to see how the situation develops.”
Blecher continued, “September 2012 was notable in its short duration of business days and virtually all transactional or operational metrics we observed declined in volume for the month; foreclosure starts, foreclosure sales, delinquent cures and loan prepayments all dropped from their August levels. It is important to note that we also saw the percentage of re-defaulting modifications contributing to the delinquency rate actually declined from the month prior.”
NAHB: Builder Confidence in the 55+ Housing Market Increases in Q3
by Calculated Risk on 11/08/2012 11:25:00 AM
This is a quarterly index from the the National Association of Home Builders (NAHB) and is similar to the overall housing market index (HMI). The NAHB started this index in Q4 2008, so all readings are very low.
From the NAHB:
Builder Confidence in the 55+ Housing Market Continues to Improve in the Third Quarter
Builder confidence in the 55+ housing market for single-family homes showed significant improvement in the third quarter of 2012 compared to the same period a year ago, according to the National Association of Home Builders' (NAHB) latest 55+ Housing Market Index (HMI) released today. The index more than tripled year over year from a level of 12 to 36, which is the highest third-quarter reading since the inception of the index in 2008.
...
The 55+ multifamily condo HMI had a significant increase of 13 points to 23, which is the highest third-quarter reading since the inception of the index in 2008; however, condos remain the weakest segment of the 55+ housing market. All 55+ multifamily HMI components increased considerably compared to a year ago as present sales rose 13 points to 22, expected sales for the next six months jumped 19 points to 29 and traffic of prospective buyers climbed 11 points to 22.
...
"Like other segments of the housing industry, the market for 55+ housing is continuing on a steady upward path, driven by improving conditions in additional markets around some parts of the country" said NAHB Chief Economist David Crowe "While we expect the upward trend to continue as the recovery broadens, the speed of the recovery is being constrained by factors as tight mortgage credit, making it difficult for potential 55+ customers to sell their current homes, and shortages of inputs to construction such as buildable lots that are beginning to emerge in some market areas."
 Click on graph for larger image.
This graph shows the NAHB 55+ HMI through Q3 2012. All of the readings are very low for this index, but there has been a fairly sharp increase over the last year.
This is going to be a key demographic for household formation over the next couple of decades - if the baby boomers can sell their current homes!
There are two key drivers: 1) there is a large cohort moving into the 55+ group, and 2) the homeownership rate typically increases for people in the 55 to 70 year old age group.
 The second graph shows the homeownership rate by age for 1990, 2000, and 2010. This shows that the homeownership rate usually increases until 70 years old or so.
So demographics should be favorable for the 55+ market - if these people can sell their current homes.


