 RSS Feed
 by Calculated Risk on 10/11/2010 09:23:00 AM
Monday, October 11, 2010
CNBC Survey: Fed Certain to act in November
Market participants now expects QE2 to be announced at 2:15 PM ET on November 3rd (when the FOMC statement is released at the conclusion of the two day meeting).
From Steve Liesman at CNBC: Fed Certain to Act in November In a Big Way: Survey
[M]arket participants are now virtually certain that the Federal Reserve will announce [QE2] at the conclusion of its November meeting and do so in a sizeable way, according to an exclusive CNBC Fed Survey. ... participants forecast that the Fed will announce plans to purchase $500 billion in assets ...The FOMC might announce a large amount - or they might announce a monthly pace of purchases like the $100 billion we've discussed before, with the intention of reviewing the purchase pace at each subsequent FOMC meeting.
Note: This coming Friday, at 8:15 AM ET, Fed Chairman Ben Bernanke will address the tools and goals of QE2 at the Federal Reserve Bank of Boston Conference. His speech is titled: "Monetary Policy Objectives and Tools in a Low-Inflation Environment".
Sunday, October 10, 2010
Fed's Dudley: Costs of higher capital requirements under Basel III are "exaggerated"
by Calculated Risk on 10/10/2010 09:53:00 PM
Earlier:
The following speech focuses on Basel III capital and liquidity standards.
From NY Fed President William Dudley: Basel and the Wider Financial Stability Agenda
[T]he new standards will require banking organizations to significantly increase the amount of high-quality, loss-absorbing capital that they hold; significantly improve risk capture in trading, counterparty credit, securitization and other activities that the prior regulatory capital requirements did not adequately capture; make it more expensive for banks to provide liquidity guarantees to shadow banks; constrain the leverage that banking companies can take by introducing a credible, non-risk-based backstop; and increase the capacity of banks to absorb shocks that might temporarily impede their ability to access short-term funding markets. While these changes apply directly only to large internationally active banks, they will have wider ramifications for the financial system as a whole, including nonbanks and the capital markets.Note that the word "intended" is highlighted in the speech. The requirement are intended to encourage banks to change thier business models and reduce risk.
...
The new capital rules are intended to provide strong incentives for banks to change their business models in ways that make the system more stable and reduce the negative impact their actions have on others—for instance, by providing incentives to standardize OTC derivatives contracts and clear such standardized trades through central counterparties. To understand what these new requirements mean for the amount of capital banks will ultimately have to hold, it is important to note that one of the intended consequences of these changes is for banks to adjust their business models in ways that reduce the risks their activities generate.
And on the costs:
[S]ome argue that the new [Basel] standards are too severe. They argue that, in the short run, the higher standards could lead to a significant constraint in credit that could hurt the nascent economic expansion. And, they argue, in the long run, that the higher capital standards will inevitably drive up lending costs and that this will hurt economic performance. Although I believe the new standards do impose some real costs on the financial system in order to achieve real benefits, I believe that concerns over the costs are exaggerated.The new standards will be phased in over several years.
Summary for Week ending Oct 9th
by Calculated Risk on 10/10/2010 03:55:00 PM
A summary of last week - mostly in graphs.
The weak employment report all but guaranteed QE2 will be announced on November 3rd. The "whisper" number is for an announcement of an initial $500 billion in purchases of long term Treasury securities over the following six months.
 Click on graph for larger image.
This graph shows the job losses from the start of the employment recession, in percentage terms (as opposed to the number of jobs lost).
The dotted line is ex-Census hiring. The two lines have joined since the decennial Census is almost over.
The BLS reported:
1) Nonfarm payroll employment decreased by -95,000 in September
2) the Unemployment Rate was unchanged at 9.6%
3) Private employment increased by 64,000.
4) Government employment declined by 159,000 (mostly Census and local government).
5) Census 2010 employment decreased 77,000 in September.
6) so there were 18,000 payroll jobs lost ex-Census.
Note: This will be the last "ex-Census" report until the 2020 Census!
 The second graph shows the unemployment rate vs. recessions.
The unemployment rate has mostly moved sideways since falling to 9.7% in January 2010.
The economy has gained 334,000 jobs over the last year, and lost 7.75 million jobs since the recession started in December 2007. However the preliminary benchmark revision (to be announced with the January 2011 report) is for a downward revision of 366,000 jobs as of March 2010 - and that suggests over 8.1 million jobs have been lost since the start of the employment recession.
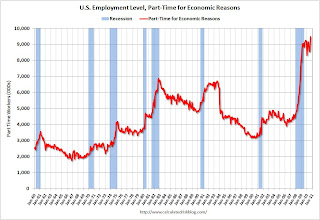 The number of workers only able to find part time jobs (or have had their hours cut for economic reasons) was at 9.472 million in September, up sharply from August.
 This is a new record high, and is obviously bad news.
These workers are included in the alternate measure of labor underutilization (U-6) that increased to 17.1% in September from 16.7% in August. The high for U-6 was 17.4% in October 2009.
 This graph shows the employment-population ratio; this is the ratio of employed Americans to the adult population.
The Employment-Population ratio was steady at 58.5% in September (the same low level as in August).
Note: the graph doesn't start at zero to better show the change.
The Labor Force Participation Rate was also steady at 64.7% in September. This is the percentage of the working age population in the labor force. The participation rate is well below the 66% to 67% rate that was normal over the last 20 years.
 The blue line is the number of workers unemployed for 27 weeks or more. The red line is the same data as a percent of the civilian workforce.
According to the BLS, there are 6.123 million workers who have been unemployed for more than 26 weeks and still want a job. This is 4.0% of the civilian workforce. It appears the number of long term unemployed has peaked ... Although this may be because people are giving up.
Employment Report Summary
The number of private sector jobs increased modestly by 64,000, otherwise the underlying details of the employment report were grim.
The negatives include the loss of 18,000 jobs ex-Census, the sharp increase in part time workers for economic reasons (and jump in U-6 unemployment rate), hours worked were flat (down for manufacturing workers), the employment-population ratio and labor force participation were flat at very low levels, and the unemployment rate was flat at a very high level.
This was another weak employment report.
 This graph shows the ISM non-manufacturing index (started in January 2008) and the ISM non-manufacturing employment diffusion index.
The September ISM Non-manufacturing index was at 53.2%, up from 51.5% in August - and above expectations of 52.0%. The employment index showed slight expansion in September at 50.2%, up from 48.2% in August. Note: Above 50 indicates expansion, below 50 contraction.
 This graph shows the office vacancy rate starting in 1991.
Reis is reporting the vacancy rate rose to 17.5% in Q3 2010, up from 17.4% in Q2 2010, and up from 16.6% in Q3 2009. The peak following the previous recession was 16.9%.
From the WSJ Signs of Recovery For Office Market
It appears the rate of increase in the vacancy rate has slowed - and rents may be stabilizing.
 Reis reported that the vacancy rate for large regional malls fell to 8.8% in Q3 from 9.0% in Q2. The vacancy rate at strip malls fell to 10.9%.
At regional malls, the record vacancy rate was 9.0% in Q2 2010 (Reis started tracking regional malls in 2000). The record vacancy rate for strip malls was in 1990 at 11.1%.
From Reuters: U.S. mall vacancy rate dips for first time in 3 years
And on apartment vacancies: From Ilaina Jonas at Reuters: US apartment vacancy rate drops sharply in 3rd qtr.
The national vacancy rate fell to 7.2 percent from 7.8 percent in the second quarter as renters soaked up 84,382 more units than were vacated ...This is for large apartment building in major cities, and it shows a significant drop in the vacancy rate.
Best wishes to all.
Schedule for Week of Oct 10th
by Calculated Risk on 10/10/2010 12:30:00 PM
The key release this week will be September retail sales on Friday. Also Fed Chairman Ben Bernanke will try to explain the objectives of QE2 on Friday "Monetary Policy Objectives and Tools in a Low-Inflation Environment".
Ceridian-UCLA Pulse of Commerce Index™ This is the diesel fuel index for September (a measure of transportation).
CoreLogic House Price Index for August. This release could show further declines in house prices. The index is a weighted 3 month average for June, July and August.
Association of American Railroads rail traffic indicators for September. Trucking, rail traffic and the Ceridian diesel fuel index are all measures of transportation (a coincident indicator).
2:45 PM ET: Federal Reserve Vice Chair Janet Yellen speaks at the National Association for Business Economics meeting in Denver: "Macroprudential Supervision and Monetary Policy in the Post-Crisis World"
7:30 AM: NFIB Small Business Optimism Index for September. This index has been showing small businesses remain pessimistic and the survey shows that the major concern of small businesses is lack of customers.
11:45 AM: Kansas City Fed President Thomas Hoenig speaks at the National Association for Business Economics meeting in Denver. "The Economic Outlook and Monetary Policy: Challenges Ahead"
2:00 PM: FOMC Minutes, Meeting of September 21, 2010. Investors will focus on any discussion of QE2.
7:00 AM: The Mortgage Bankers Association (MBA) will release the mortgage purchase applications index. This index declined sharply following the expiration of the tax credit. The index has increased a little recently - possibly due to borrowers trying to beat the slightly tighter FHA requirements.
7:45 PM: Richmond Fed President Jeffrey Lacker will speak in Chapel Hill, NC.
8:30 AM: The initial weekly unemployment claims report will be released. Consensus is for a slight decrease to 443K from 445K last week.
8:30 AM: Trade Balance report for August from the Census Bureau. The consensus is for the U.S. trade deficit to increase to $44 billion (from $42.8 billion in July).
8:30 AM: Producer Price Index for September. The consensus is for a 0.1% increase in producer prices.
8:15 AM: Fed Chairman Ben S. Bernanke will speak at the Federal Reserve Bank of Boston Conference "Monetary Policy Objectives and Tools in a Low-Inflation Environment"
8:30 AM: Consumer Price Index for September. The consensus is for a 0.2% increase in prices. This is being closely watched for further disinflation, and also because Q3 is the quarter the annual annual cost-of-living adjustment (COLA) is calculated for Social Security (this will make it official that there will be no change in 2011).
8:30 AM: Retail Sales for September. The consensus is for a 0.4% increase from August.
8:30 AM: Empire Manufacturing Survey for October. The consensus is for a reading of 8.0, up from 4.1 in September. These regional surveys have been showing a slowdown in manufacturing and are being closely watched right now.
9:15 AM: Atlanta Fed President Dennis Lockhart participates in a question-and-answer session on the economy in Atlanta.
9:55 AM: Reuters/University of Mich Consumer Sentiment preliminary for October. The consensus is for a slight increase to 69.0 from 68.2 in September.
10:00 AM: Manufacturing and Trade: Inventories and Sales for August. Consensus is for a 0.4% increase in inventories in August.
After 4:00 PM: The FDIC has really slowed down closing banks - even though the Unofficial problem bank list continues to increase. The pace of closures will probably pickup soon ...
8:15 AM: Boston Fed President Eric Rosengren speaks at Federal Reserve Bank of Boston Conference
Pearlstein on Foreclosure-Gate
by Calculated Risk on 10/10/2010 09:08:00 AM
From Steve Pearlstein at the WaPo: To sort this mess, both banks and borrowers must do the right thing
Listening to the fiery rhetoric about the mortgage mess emanating from politicians this week, you'd think that big bad banks were trying to foreclose on hundreds of thousands of homeowners who were current on their payments but had become victims of sloppy business practices.I've pointed this out several times: the basic facts are 1) the homeowners have a mortgage and 2) the homeowner is seriously delinquent.
...
But if, as appears to be the case, the overwhelming majority of homeowners facing foreclosure have fallen far behind on their payments, then it is a good deal harder to summon up the same moral outrage over reports that the banks and loan service companies cut corners, failed to keep the right documents and engaged in shoddy and even fraudulent practices. Just because the banks and servicers have screwed up doesn't mean they and their investors are no longer entitled to get their money back.
Certainly banks and servicers should, at their own expense, be sent back to do things right. Those who engaged in fraud should be punished. And if there are legitimate questions about who owns a loan, those will need to be resolved before the proceeds of any foreclosure are distributed.
But none of that changes the basic reality that there are millions of Americans who took out mortgages they could not support on houses they could not afford.
As Tom Lawler wrote "mortgage servicers who messed up should bear all of the costs associated with their mess up". And I'd prefer alternatives to foreclosure (mortgage modification or even short sales / deed-in-lieu), but we also need to remember that the basic facts are not in dispute.
Saturday, October 09, 2010
IMF: Concern about fragile economy and exchange rates
by Calculated Risk on 10/09/2010 09:57:00 PM
Via MarketWatch: Summary of IMF meeting communique
Global economy: “Economic recovery is proceeding, but remains fragile and uneven across the membership. Faced with this source of potential stress, we underscore our strong commitment to continue working collaboratively to secure strong, sustainable and balanced growth and to refrain from policy actions that would detract from this shared goal. ... The rejection of protectionism in all its forms must remain a key element of our coordinated response to the crisis; renewed efforts are urgently needed to bring the Doha Round to a successful conclusion.”Not that anything will come of this, but clearly the IMF is still concerned about the "fragile" economy, and about exchange rates.
...
Mandate for international monetary stability: “While the international monetary system has proved resilient, tensions and vulnerabilities remain as a result of widening global imbalances, continued volatile capital flows, exchange rate movements and issues related to the supply and accumulation of official reserves. Given that these issues are critically important for the effective operation of the global economy and the stability of the international monetary system, we call on the Fund to deepen its work in these areas, including in-depth studies to help increase the effectiveness of policies to manage capital flows. We look forward to reviewing further analysis and proposals over the next year.”
Music: "Nobody Knows the Bubbles I've Seen"
by Calculated Risk on 10/09/2010 04:55:00 PM
Watch for the "Hoocoodanode" mention (A Tanta snark and the name of our message board) ...
Duration of Unemployment
by Calculated Risk on 10/09/2010 11:45:00 AM
An update by request ...
 Click on graph for larger image.
This graph shows the duration of unemployment as a percent of the civilian labor force. The graph shows the number of unemployed in four categories: less than 5 week, 6 to 14 weeks, 15 to 26 weeks, and 27 weeks or more.
Note: The BLS reports 15+ weeks, so the 15 to 26 weeks number was calculated.
In Setpember 2010, the number of unemployed for 27 weeks or more declined to 6.123 million (seasonally adjusted) from 6.249 million in August. It appears the number of long term unemployed has peaked, but it is still very difficult for these people to find a job - and this is a very serious employment issue.
The 5 to 14 week category declined in September, however the less than 5 week category continued to increase - and is now at the highest level since January 2010.
The less than 5 week category shows how the turnover in the labor market has changed. Back in the '70s and '80s there was much more turnover in the labor market. And that added turnover is a key reason the overall unemployment rate was higher in the early '80s recession than right now.
Note: Even though these numbers are all seasonally adjusted, they can't be added together to calculate the unemployment rate.
And a repeat of a popular graph ...
The second graph shows the job losses from the start of the employment recession, in percentage terms (as opposed to the number of jobs lost).
The dotted line is ex-Census hiring. The two lines have joined since the decennial Census is almost over.
Best to all
Employment posts yesterday (with many graphs):
Unofficial Problem Bank List 877 Institutions
by Calculated Risk on 10/09/2010 07:27:00 AM
Note: this is an unofficial list of Problem Banks compiled only from public sources.
Here is the unofficial problem bank list for Oct 8, 2010.
Changes and comments from surferdude808:
The number of institutions on the Unofficial Problem Bank List remained unchanged this week at 877 but assets rose slightly from $416.1 billion to $417.3 billon.
Three institutions were removed with one because of action termination -- First National Bank and Trust Company ($296 million), and two others -- First National Bank & Trust Company in Larned ($34 million) and Clear Creek National Bank ($24 million) because they merged into other banks that are on the Unofficial Problem Bank List.
Additions this week include Valley Bank, Roanoke, VA ($763 million Ticker: VYFC); Fullerton Community Bank, FSB, Fullerton, CA ($705 million); and Fort Lee Federal Savings Bank, FSB, Fort Lee, NJ ($75 million), which received about $1.3 million of TARP capital in May 2009.
We anticipate for the OCC to release its actions from mid-August through mid-September next Friday.
Friday, October 08, 2010
Late night Foreclosure-Gate
by Calculated Risk on 10/08/2010 11:36:00 PM
From Dina ElBoghdady at the WaPo: Buyers anxiously await foreclosure deals to go through
From David Streitfeld and Nelson Schwartz at the NY Times: Largest U.S. Bank Halts Foreclosures in All States
Note: the media is in a frenzy about this, but I've hardly mentioned it other than linking to a few articles and posting Tom Lawler's piece about Who will, and who should "pay"?.
Best to all.
Employment posts today (with many graphs):


