 RSS Feed
 by Calculated Risk on 7/20/2010 10:03:00 AM
Tuesday, July 20, 2010
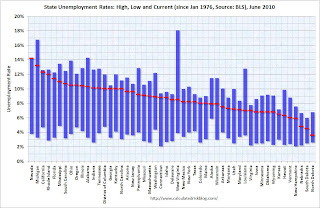
State Unemployment Rates: Generally lower in June
 Click on graph for larger image in new window.
This graph shows the high and low unemployment rates for each state (and D.C.) since 1976. The red bar is the current unemployment rate (sorted by the current unemployment rate).
Sixteen states and D.C. now have double digit unemployment rates. Arizona and New Jersey are close.
Nevada set a new series high at 14.2% and now has the highest state unemployment rate. Michigan held the top spot for over 4 years until May.
From the BLS: Regional and State Employment and Unemployment Summary
Regional and state unemployment rates were generally lower in June. Thirty-nine states and the District of Columbia recorded unemployment rate decreases, five states had increases and six states had no change, the U.S. Bureau of Labor Statistics reported today.
...
Nevada again reported the highest unemployment rate among the states, 14.2 percent in June. The rate in Nevada also set a new series high. (All region, division, and state series begin in 1976.) The states with the next highest rates were Michigan, 13.2 percent; California, 12.3 percent; and Rhode Island, 12.0 percent.
emphasis added
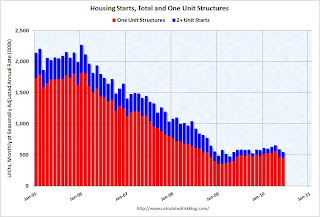
Housing Starts decline in June
by Calculated Risk on 7/20/2010 08:30:00 AM
 Click on graph for larger image in new window.
Total housing starts were at 549 thousand (SAAR) in June, down 5% from the revised May rate of 578,000 (revised down from 593 thousand), and up 15% from the all time record low in April 2009 of 477 thousand (the lowest level since the Census Bureau began tracking housing starts in 1959).
Single-family starts declined 0.7% to 454,000 in June. This is 26% above the record low in January 2009 (360 thousand). 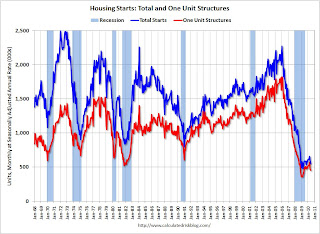 The second graph shows total and single unit starts since 1968. This shows the huge collapse following the housing bubble, and that housing starts have mostly been moving sideways for over a year.
Here is the Census Bureau report on housing Permits, Starts and Completions.
Housing Starts:This is way below expectations of 580 thousand (I took the under!), and is good news for the housing market longer term (there are too many housing units already), but bad news for the economy and employment short term.
Privately-owned housing starts in June were at a seasonally adjusted annual rate of 549,000. This is 5.0 percent (±13.2%)* below the 13.2%) revised May estimate of 578,000 and is 5.8 percent (±10.5%)* below the June 2009 rate of 583,000.
Single-family housing starts in June were at a rate of 454,000; this is 0.7 percent (±10.7%)* below the revised May figure of 457,000.
Building Permits:
Privately-owned housing units authorized by building permits in June were at a seasonally adjusted annual rate of 586,000. This is 2.1 percent (±2.1%)* above the revised May rate of 574,000, but is 2.3 percent (±2.0%) below the June 2009 estimate of 600,000.
Single-family authorizations in June were at a rate of 421,000; this is 3.4 percent (±1.8%) below the revised May figure of 436,000.
Monday, July 19, 2010
Merle Hazard: Greek Debt Song
by Calculated Risk on 7/19/2010 11:42:00 PM
A little music to go along with the Sovereign Debt series ...
Update: Unemployment Benefits extension likely to pass
by Calculated Risk on 7/19/2010 07:40:00 PM
Earlier I mentioned I wasn't sure if the unemployment benefit extension would pass - it looks like it will pass tomorrow.
The WSJ reports Senate Set to Extend Jobless Benefits
On Tuesday, Democrats are likely to get the 60 votes they need to extend the benefits through November. ... The House is expected to approve the Senate's version Wednesday and send it to Mr. Obama for his signature.Note: this is an extension of the qualification dates for existing tiers of extended unemployment benefits, not additional weeks of benefits.
Moody's: Commercial Real Estate Price Index increases in May
by Calculated Risk on 7/19/2010 04:40:00 PM
Moody's reported today that the Moody’s/REAL All Property Type Aggregate Index increased 3.6% in May. This is a repeat sales measure of commercial real estate prices.
Below is a comparison of the Moodys/REAL Commercial Property Price Index (CPPI) and the Case-Shiller composite 20 index.
Notes: Beware of the "Real" in the title - this index is not inflation adjusted. Moody's CRE price index is a repeat sales index like Case-Shiller - but there are far fewer commercial sales - and that can impact prices. Click on graph for larger image in new window.
CRE prices only go back to December 2000.
The Case-Shiller Composite 20 residential index is in blue (with Dec 2000 set to 1.0 to line up the indexes).
It is possible that commercial real prices have bottomed - in general - but it is hard to tell because the number of transactions is very low and there are a number of distressed sales.
Commercial real estate values are now down 6.3% over the last year, and down 38.9% from the peak in late 2007.
Comments from PIMCO
As I've noted every month, this is a very thin market that is skewed by distressed sales. John Murray at PIMCO also cautioned about the CPPI index in a recent note: PIMCO U.S. Commercial Real Estate Project
National price indices such as the Moody’s Commercial Property Price Index (CPPI) can provide misleading indications of a recovery in CRE asset price levels. Since November 2009, the index has rebounded 3%.Comments from MIT Professor David Geltner
While it is natural to draw comparisons between the CPPI and the S&P/Case-Shiller index used to gauge residential home prices, we caution that indexes such as the CPPI are relatively meaningless in today’s limited transaction environment – commercial real estate transaction volume fell nearly 90% from 2007 to 2009.
Our ride along meetings highlight another limitation of the CPPI. Based on repeat transactions, the index excludes the truly distressed or overpriced properties acquired in the past few years that have yet to trade, and is instead skewed by the high proportion of trophy asset and Agency-financed multifamily transactions.
Dr. Geltner writes a column that appears on the Real Estate Analytics LLC website on the lower right under "Professor's Corner". This is based on last month's data, but still explains the market dynamics:
CPPI advanced in April, due to the very strong performance of “healthy” properties (i.e., those without the RCA “troubled asset” flag). Figure 4 shows that the healthy property breakout index (estimated using the same methodology as the CPPI only dropping out the “troubled assets”) rose 6.3% from March to April while the “distressed” index declined more than 5%. The “healthy property index” is now only 33% below the October 2007 peak, while properties falling into distress since then are still selling more than 50% below 2007 values on average.
 Graph from Dr. Geltner.
Whereas 2009 saw the advent of a bifurcated market between “healthy” and “distressed” properties, 2010 is now seeing what might be called a “trifurcated” market. Not only are distressed properties selling at sharp discounts, but “trophy” properties and solid “core” assets are selling at very respectable prices well above the general market average.Roughly, CRE prices are moving up for "trophy" properties, moving sideways for the general market, and falling again for distressed properties. But this is based on very few transactions ...
Lawler: Preview on Existing Home Sales
by Calculated Risk on 7/19/2010 03:10:00 PM
CR Note: Last month, housing economist Tom Lawler's forecast was well below the consensus of 6.2 million (SAAR) for May and close to the actual reported existing home sales (he does a bottom up calculation every month, and he has been very close). Here is his preview for this month:
The pace of existing home sales in June varied dramatically across the country in June, with some of the difference reflecting the pace of closings of contracts signed to beat the federal home buyer tax credit. Long Island was a “standout” to the upside, with home closings in June coming in at 73.8% higher than last June, reflecting the longer-than-national norm time to close signed contracts. Most other markets saw materially slower YOY sales growth in June compared to May, with a number of areas seeing YOY declines. And many markets where a year ago sales were dominated by foreclosure sales saw YOY sales declines, with the drops mainly reflecting significantly lower foreclosure sales.
Based on all the data I have so far, I estimate that existing home sales ran at a seasonally adjusted annual rate of about 5.3 million in June, down about 6.4% from May’s pace. July sales, of course, will see a MUCH bigger drop.
On the inventory front, the local realtor/MLS were on balance consistent with my national tracking, which showed active residential listings up about 1.6% from May. I don’t know if the NAR data will show the same thing however; the NAR apparently doesn’t use available national listings but instead uses reports from the sample of realtor/MLS groups it gets each month, and uses that to “gross up” total inventory in a fashion that clearly produces some “spurious” volatility.
CR Note: this was from housing economist Tom Lawler. The National Association for Realtors (NAR) will release the June existing home sales report on Thursday. The consensus is for a decline to 5.3 million sales in June (SAAR, seasonally adjusted annual rate).
Summers: More Fiscal Stimulus Now, Reduce Deficits when economy has recovered
by Calculated Risk on 7/19/2010 01:17:00 PM
Lawrence Summers writes in the Financial Times: America’s sensible stance on recovery
[W]here an economy’s level of output is constrained by demand and the central bank has at best a limited ability to relax that constraint because it cannot reduce interest rates to below zero, fiscal policy can have a significant impact on output and employment.It looks like the only additional stimulus will be an extension of the emergency unemployment benefits - and even that isn't clear.
...[and] there is a very strong presumption that there are likely to be beneficial effects from the expectation that budget deficits will be reduced after an economy has recovered and is no longer demand-constrained.
...
In most of the industrialised world, given that economies are in or near liquidity trap conditions, it is [these] propositions that should control policy. Together they make a case for fiscal actions that maintain or increase demand in the short run while reassuring markets on sustainability over the medium term.
NAHB Builder Confidence falls to lowest level since April 2009
by Calculated Risk on 7/19/2010 10:00:00 AM
Note: any number under 50 indicates that more builders view sales conditions as poor than good. Click on graph for larger image in new window.
This graph shows the builder confidence index from the National Association of Home Builders (NAHB).
The housing market index (HMI) was at 14 in June. This is the lowest level since April 2009.
The record low was 8 set in January 2009, but 14 is very low ... This second graph compares the NAHB HMI (left scale) with single family housing starts (right scale). This includes the July release for the HMI and the May data for starts (June starts will be released tomorrow).
This shows that the HMI and single family starts mostly move generally in the same direction - although there is plenty of noise month-to-month.
Press release from the NAHB: Builder Confidence Declines in July
Builder confidence in the market for newly built, single-family homes declined for a second consecutive month in July to its lowest level since April of 2009, according to the National Association of Home Builders/Wells Fargo Housing Market Index (HMI) released today. The HMI fell two points from a downwardly revised number in the previous month to 14 for July.This suggests futher declines in housing starts. The consensus is for a decrease to 580K (SAAR) in June from 593K in May. I'll take the under.
...
Each of the HMI's component indexes recorded declines in July. The component gauging current sales conditions fell two points to 15, while the component gauging sales expectations in the next six months edged down one point to 21 and the component gauging traffic of prospective buyers fell three points to 10.
Moody's Downgrades Ireland
by Calculated Risk on 7/19/2010 08:33:00 AM
From Matthew Saltmarsh at the NY Times: Moody’s Cuts Ireland’s Credit Rating
Moody’s Investors Service downgraded Ireland one notch, to Aa2 from Aa1 ... Moody’s also changed the outlook on the ratings to stable from negative.And from the WSJ: Spanish Bad Bank Debt Rises
“Today’s downgrade is primarily driven by the Irish government’s gradual but significant loss of financial strength, as reflected by its deteriorating debt affordability,” said Dietmar Hornung, a senior credit officer at Moody’s.
Bad debt held by Spanish banks topped €100 billion ($129 billion) for the first time in May, as more companies filed for bankruptcy and unemployment continued to rise amid the economic downturn.On Friday, the Committee of European Banking Supervisors (CEBS) will release the stress test results for 91 European Banks.
This ties in with the Sovereign debt series too!
Sunday, July 18, 2010
This and that ...
by Calculated Risk on 7/18/2010 09:18:00 PM
First, some earlier posts:
And some more stories:
Hungarian assets could come under selling pressure on Monday after the International Monetary Fund and European Union postponed the conclusion of a budgetary review in Budapest, insisting that the government must rethink its proposals.
excerpt with permission


