 RSS Feed
 by Calculated Risk on 7/20/2010 10:03:00 AM
Tuesday, July 20, 2010
State Unemployment Rates: Generally lower in June
 Click on graph for larger image in new window.
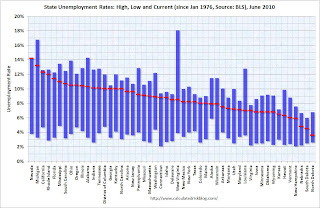
This graph shows the high and low unemployment rates for each state (and D.C.) since 1976. The red bar is the current unemployment rate (sorted by the current unemployment rate).
Sixteen states and D.C. now have double digit unemployment rates. Arizona and New Jersey are close.
Nevada set a new series high at 14.2% and now has the highest state unemployment rate. Michigan held the top spot for over 4 years until May.
From the BLS: Regional and State Employment and Unemployment Summary
Regional and state unemployment rates were generally lower in June. Thirty-nine states and the District of Columbia recorded unemployment rate decreases, five states had increases and six states had no change, the U.S. Bureau of Labor Statistics reported today.
...
Nevada again reported the highest unemployment rate among the states, 14.2 percent in June. The rate in Nevada also set a new series high. (All region, division, and state series begin in 1976.) The states with the next highest rates were Michigan, 13.2 percent; California, 12.3 percent; and Rhode Island, 12.0 percent.
emphasis added


