 RSS Feed
 by Calculated Risk on 7/13/2010 08:56:00 AM
Tuesday, July 13, 2010
Trade Deficit increases in May
The Census Bureau reports:
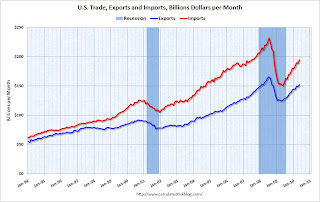
[T]otal May exports of $152.3 billion and imports of $194.5 billion resulted in a goods and services deficit of $42.3 billion, up from $40.3 billion in April, revised. May exports were $3.5 billion more than April exports of $148.7 billion. [May] imports were $5.5 billion more than April imports of $189.0 billion.
 Click on graph for larger image.
The first graph shows the monthly U.S. exports and imports in dollars through May 2010.
Clearly imports are increasing much faster than exports. On a year-over-year basis, exports are up 21% and imports are up 29%. This is an easy comparison because of the collapse in trade at the end of 2008 and into early 2009.
The second graph shows the U.S. trade deficit, with and without petroleum, through May.
 The blue line is the total deficit, and the black line is the petroleum deficit, and the red line is the trade deficit ex-petroleum products.
Import oil prices decreased slightly to $76.93 in May - and are up 96% from the low of February 2009 (at $39.22). Oil import volumes were down in May.
With oil prices and volumes down, oil imports decreased sharply in May, however other imports - especially from China - increased significantly. Most of the increase in the trade deficit since last year has been related to oil, but now it appears the ex-oil deficit is increasing sharply again.
Ceridian-UCLA: Diesel Fuel index Falls Sharply in June
by Calculated Risk on 7/13/2010 08:20:00 AM
This is the new UCLA Anderson Forecast and Ceridian Corporation index using real-time diesel fuel consumption data: Pulse of Commerce IndexTM
Press Release: Amid Fears of Double-Dip Recession, PCI Falls Sharply in June
The Ceridian-UCLA Pulse of Commerce Index™ (PCI) by UCLA Anderson School of Management tumbled 1.9 percent in June after its impressive 3.1 percent gain in May.
...
“While June’s number is substantially down, erasing two-thirds of May’s great gain, the daily and weekly activity on which the monthly PCI is based does not suggest that the economy is heading over a cliff,” said [PCI Chief Economist Edward Leamer]. “Part of the apparent strength of May and weakness in June is the result of the Memorial Day holiday occurring on the last day of May, allowing the negative Memorial Day effect which is usually confined to May to leak into June. More importantly, the June weakness was confined to the first two weeks, and by the second half of June, we were seeing strong growth again.”
...
The PCI is based on an analysis of real-time diesel fuel consumption data ...
 Click on graph for larger image in new window.
This graph shows the index since January 1999.
The decline in June is just one month (partially offsetting the large increase in May), and the three month average is still increasing.
Note: This index appears to lead Industrial Production (IP), but there is a significant amount of monthly noise. This is a new index and is something to follow along with other transportation data.
Small Businesses a little more pessimistic
by Calculated Risk on 7/13/2010 07:47:00 AM
From the NFIB:
The National Federation of Independent Business Index of Small Business Optimism lost 3.2 points in June falling to 89.0 after posting modest gains for several months. The Index has been below 93 every month since January 2008 (30 months), and below 90 for 23 of those months, all readings typical of a weak or recession-mired economy.The key problems are a shortage of customers and also falling prices (via WSJ): “widespread price cutting continued to contribute to reports of lower nominal sales.”
...
Over the next three months, 8 percent plan to reduce employment (up one point), and 10 percent plan to create new jobs (down four points), yielding a seasonally adjusted net 1 percent of owners planning to create new jobs, unchanged from the May reading and positive for the second time in 20 months.
...
“Hiring and capital spending depend on expectations for growth in future sales, so the outlook for improved spending and hiring is not good,” said [William Dunkelberg, NFIB’s chief economist].
Small business owners continued to liquidate inventories and weak sales trends gave little reason to order new stock.
Updates: something to remember: "Small businesses" includes a large percentage of real estate related companies - so weak housing skews the results. The press release will be here, and the report here.
Monday, July 12, 2010
Condo Shadow Inventory
by Calculated Risk on 7/12/2010 11:30:00 PM
Another update on condos as shadow inventory ...
From Kelly Bennett at the Voice of San Diego: Vantage Pointe's Trouble Persists, but Downtown Thinks It's Found Bottom
Weighing in at 679 units, downtown's biggest condo building, Vantage Pointe, has met with outsize trouble since 2004 when buyers first got in fistfights for the privilege of securing a unit.This is another reminder that unless these condos are listed, they do not show up as either existing or new home inventory (the new home report doesn't include high rise condos).
The building's trouble continues. The developers haven't sold a single unit in the 14 months since returning deposits to the previous contracted buyers. About 40 buyers have signed contracts to buy there but can't close the deals. More than 150 other units are being rented.
But that's not enough to satisfy the project's lenders behind its $210 million loan, the largest construction loan on a single residential building in San Diego history. Those lenders filed a notice of default in April, pushing the developers to the first stage of foreclosure.
And 150 of these units have been rented and will probably be sold someday too. I spoke to a landlord in the downtown San Diego area yesterday, and she has had to cut rents significantly to compete with all the condo units being rented.
There are some areas - like Las Vegas and Miami - that have a huge number of vacant high rise condos. But there are also many smaller buildings that are mostly vacant in a number of cities (like in New York, Chicago, Raliegh, N.C. and Irvine, Ca). This is all part of the shadow inventory ...
Stress Tests: EU Concerned about "pockets of vulnerability”
by Calculated Risk on 7/12/2010 06:32:00 PM
From James Kanter at the NY Times: European Ministers Weigh Details of Stress Test
European Union finance ministers met Monday to start two days of discussions partly aimed at deciding how much information to reveal after they complete [stress] tests ...The results will be released on July 23rd.
“The European banking sector is, over all, resilient,” Olli Rehn, the European commissioner for economic and monetary affairs, said at a news conference. “At the same time when we publish the stress tests we will have to prepare for any pockets of vulnerability.”
And posted this morning from "some investor guy", part 3 in the series on sovereign default:
Earlier posts:
More coming later this week.
Distressed Sales: Sacramento as an Example, June 2010
by Calculated Risk on 7/12/2010 04:08:00 PM
The Sacramento Association of REALTORS® has been breaking out short sales for over a year now. They report monthly resales by equity sales (conventional resales), and distressed sales (Short sales and REO sales), and I'm following this series as an example to see mix changes in a distressed area.  Click on graph for larger image in new window.
Here is the June data.
Total June sales were up from May, and up from June 2009. Of course June was the scheduled closing deadline to qualify for the Federal homebuyer tax credit (closing date since extended), and also the California tax credit played a role. Sales should collapse in July.
The year-over-year (YoY) increase in June sales break a 12 month streak of declining YoY sales. But that was because of the tax credit, and sales will be off YoY in July.
Short sales were up 66% YoY (Year of the Short Sale!), and REO sales were down by 30%.
Note: This data is not seasonally adjusted. The second graph shows the percent of REO, short sales and conventional sales. The percent of short sales is now at a high for this brief series.
In June, 62.4% of all resales (single family homes and condos) were distressed sales.
The percent of REOs has been generally declining (seasonally there are a larger percentage of REOs in the winter). Also there appears to be a higher percentage of conventional sales associated with the tax credit.
On financing, 54.6% percent were either all cash (21.3%) or FHA loans (33.3%), suggesting most of the activity in distressed former bubble areas like Sacramento is first time home buyers using government-insured FHA loans, and investors paying cash.
With the tax credit (mostly) over, I expect total sales to decline and the percent of distressed sales (Short and REO) to increase.
FHFA attempting to recoup some losses of Fannie and Freddie
by Calculated Risk on 7/12/2010 02:15:00 PM
From the Federal Housing Finance Agency: FHFA Issues Subpoenas for PLS Documents
FHFA, as Conservator of Fannie Mae and Freddie Mac (the Enterprises), has issued 64 subpoenas to various entities, seeking documents related to private-label mortgage-backed securities (PLS) in which the two Enterprises invested. The documents will enable the FHFA to determine whether PLS issuers and others are liable to the Enterprises for certain losses they have suffered on PLS. If so, the Conservator expects to recoup funds, which would be used to offset payments made to the Enterprises by the U.S. Treasury.Many of the originators of the PLS mortgages are no longer in business (New Century, etc.), however most of the PLS issuers still exist.
...
Before and during conservatorship, the Enterprises sought to assess and enforce their rights as investors in PLS, in an effort to recoup losses suffered in connection with their portfolios. Specifically, the Enterprises have attempted to determine whether misrepresentations, breaches of warranties or other acts or omissions by PLS counterparties would require repurchase of loans underlying the PLS by the counterparties and whether other remedies might be appropriate. However, difficulty in obtaining the loan documents has presented a challenge to the Enterprises’ efforts. FHFA has therefore issued these subpoenas for various loan files and transaction documents pertaining to loans securing the PLS to trustees and servicers controlling or holding that documentation.
Bankruptcy and 2nd Liens
by Calculated Risk on 7/12/2010 11:12:00 AM
From Catherine Curan writing at the NY Post: Liening on banks
Underwater homeowners are jumping onto an unexpected financial life raft that lets them escape crippling second mortgage debts and keep their homes -- Chapter 13 bankruptcy.For many borrowers, this makes a Chapter 13 bankruptcy a better choice than a foreclosure. With a foreclosure, the borrower loses the house - and the 2nd lien holder might still pursue the borrower (unless they release the lien for some compensation, like under HAFA).
...
How it works is this: If the home is appraised at less than the value of the first mortgage, the owner can apply for permission in bankruptcy court to reclassify the second mortgage debt. That changes it from a secured debt, which must be repaid, into an unsecured debt, which does not have to be paid in full. The homeowner can then focus on paying off the first mortgage.
"This is the only time where you see such a huge percentage of houses worth less than the first loan, allowing us to basically get rid of the second loan," says [New York City bankruptcy attorney David Shaev of Shaev & Fleischman], who estimates that 20 percent of his Chapter 13 clients who own homes qualify for this type of workout. "We're at a unique place in history."
With a bankruptcy - under certain circumstances - the borrower keeps the house, and the 2nd lien is converted to unsecured debt and does not have to be paid in full. This is probably part of the reason for sharp increase in bankruptcy filings.
Part 3. What are the Market Estimates of the Probabilities of Default?
by Calculated Risk on 7/12/2010 08:50:00 AM
CR Note: This series is from reader "some investor guy".
There are a number of ways of looking at chances of default and/or expected losses, including: bond yields vs a low or no default bond in the same currency, credit default swap prices, bond ratings, and analysis of underlying financial factors.
Bond ratings move more slowly than bond yields or CDS prices. Ratings often are lowered only after a major problem has been realized and is already incorporated into yields or CDS prices. While bond prices can be useful, there are an assortment of problems of trying to extract default probabilities. One is the yield curve, and that for many sovereigns there aren’t all that many maturities outstanding. Trying to get a 5 year probability of default from a dataset including only a 2 year and 20 year maturity presents some analytic problems. Bond prices also have a surprising amount of differences due solely to liquidity. For example see Longstaff.
“We find a large liquidity premium in Treasury bonds, which can be more than fifteen percent of the value of some Treasury bonds. This liquidity premium is related to changes in consumer confidence, the amount of Treasury debt available to investors, and flows into equity and money market mutual funds. This suggests that the popularity of Treasury bonds directly affects their value.”
Yes, that’s 15 percent between different US Treasuries and a series of bonds explicitly guaranteed by the US govt, the 1990s Resolution Trust. Even on the run and off the run US treasuries have different yields due to liquidity.
Because it provides daily information for almost all large sovereigns, and calculates cumulative probabilities of default (CPD), we use data from CMAVision to estimate sovereign default probabilities.
 Click on graph for larger image in new window.
This chart shows outstanding debt with the (CPD) for each country. Despite it having a moderate 8.3% probability of default, Japan’s huge outstanding bond portfolio makes it the largest contributor to expected sovereign losses. However, it’s unlikely that any country would only have a default on a small group of bonds. If Japan defaulted, it is likely that most or all of its outstanding debt would be restructured (e.g., different interest rate, extended payment, a haircut on principal).
CPDs from 3/31/10 and 6/30/10 are shown in the next chart. The red bars are Q2, the orange bars are from Q1. Obviously, some credit default swap prices moved substantially in those three months, like Greece, Portugal, Spain and Belgium.
 As of June 30, 2010, the weighted average expected default rate is 7.4%. When weighted by value of debt outstanding, CDS pricing worldwide points to 7.4% of it defaulting within 5 years. If the outstanding sovereign debt was still $34 trillion as reported at 12/31/09, that’s $2.5 trillion of defaulted debt. If the trend of increased borrowing has continued to $36 trillion at 6/30/10, it’s about $2.7 trillion of defaulted debt.
Before you run out and start shorting sovereigns or panic over your retirement, remember that bondholders seldom lose all of their money on defaulted bonds. Sometimes recovery rates are quite good. Others, not so much.
CR Note: This is from "Some investor guy". Over the next week or so, some investor guy will address several questions: What are total estimated losses on sovereign bonds due to default? What happens if things go really badly and what are the indirect effects of default?
Later this week: Part 4. What are Total Estimated of Losses on Sovereign Bonds Due to Default?
Series:
• Part 1: How Large is the Outstanding Value of Sovereign Bonds?
• Part 2. How Often Have Sovereign Countries Defaulted in the Past?
• Part 2B: More on Historic Sovereign Default Research
• Part 3. What are the Market Estimates of the Probabilities of Default?
• Part 4. What are Total Estimated Losses on Sovereign Bonds Due to Default?
• Part 5A. What Happens If Things Go Really Badly? $15 Trillion of Sovereign Debt in Default
• Part 5B. Part 5B. What Happens If Things Go Really Badly? More Things Can Go Badly: Credit Default Swaps, Interest Swaps and Options, Foreign Exchange
• Part 5C. Some Policy Options, Good and Bad
• Part 5D. European Banks, What if Things Go Really Badly?
Sunday, July 11, 2010
Deflation and the Fed
by Calculated Risk on 7/11/2010 11:59:00 PM
From Paul Krugman: Trending Toward Deflation
Inflation has been falling, but how close are we to deflation? I found myself wondering that after observing John Makin’s combusting coiffure, his prediction that we might see deflation this year.And in the NY Times: The Feckless Fed
...
What I take from this is that deflation isn’t some distant possibility — it’s already here by some measures, not far off by others. And of course there isn’t some magic boundary effect when you cross zero; falling inflation is raising real interest rates and making debt problems worse as we speak.
Back in 2002, a professor turned Federal Reserve official by the name of Ben Bernanke gave a widely quoted speech titled “Deflation: Making Sure ‘It’ Doesn’t Happen Here.” Like other economists, myself included, Mr. Bernanke was deeply disturbed by Japan’s stubborn, seemingly incurable deflation, which in turn was “associated with years of painfully slow growth, rising joblessness, and apparently intractable financial problems.” This sort of thing wasn’t supposed to happen to an advanced nation with sophisticated policy makers. Could something similar happen to the United States?And an interesting point from Mike Bryan, vice president and senior economist at the Atlanta Fed: How close to deflation are we? Perhaps just a little closer than you thought
CPI will be released on Friday, and expectations are for another slight decline in the headline number. Persistent deflation (like in Japan) would be a serious problem. Perhaps if rents are increasing slightly, as recent reports suggests, the U.S. might avoid deflation without further Fed action (I'm not confident that rents have bottomed given the high vacancy and unemployment rate - especially if I'm correct about growth slowing in the 2nd half of 2010).
Note: Last week I asked "What might the Fed do?" and I excerpted from Bernanke's 2002 speech. If the trend towards deflation continues, I think the FOMC - based on Bernanke's speech - might set "explicit ceilings for yields on longer-maturity Treasury debt".


