 RSS Feed
 by Calculated Risk on 7/03/2010 01:25:00 PM
Saturday, July 03, 2010
Duration of Unemployment
An update by request ... Click on graph for larger image.
This graph shows the duration of unemployment as a percent of the civilian labor force. The graph shows the number of unemployed in four categories: less than 5 week, 6 to 14 weeks, 15 to 26 weeks, and 27 weeks or more.
Note: The BLS reports 15+ weeks, so the 15 to 26 weeks number was calculated.
In June 2010, the number of unemployed for 27 weeks or more declined slightly to 6.751 million (seasonally adjusted) from a record 6.763 million in May. Because the civilian labor force declined sharply, the percent of long term unemployed set a new record in June (4.39% of civilian labor force).
It is possible that the number of long term unemployed might has peaked, but it is still very difficult for these people to find a job - and this is a very serious employment issue.
All categories of unemployment duration increased in June as a percent of civilian unemployment.
Note: Even though these numbers are all seasonally adjusted, they can't be added together to calculate the unemployment rate.
Double Dip Search Trends
by Calculated Risk on 7/03/2010 08:53:00 AM
From Google Trends, search trend on "double dip"...
 |
It appears the 2nd half slowdown is here, but I think the U.S. will avoid a technical "double-dip" recession. As I noted last week, for the unemployed and marginally employed, and for many other Americans suffering with too much debt or stagnant real incomes, there is little difference between slower growth and a double-dip recession.
And a repeat of a couple graphs from yesterday ...
 Click on graph for larger image.
This graph shows the job losses from the start of the employment recession in percentage terms.
The dotted line shows the impact of Census hiring. In May, there were 339,000 temporary 2010 Census workers on the payroll. The number of Census workers will continue to decline - and the gap between the solid and dashed red lines will be mostly closed in three or four months.
 This graph shows the employment-population ratio; this is the ratio of employed Americans to the adult population.
The Employment-Population ratio decreased to 58.5% in June from 58.7% in May. This had been increasing after plunging since the start of the recession, and the recovery in the Employment-Population ratio was considered a good sign - but the ratio has now decreased for two consecutive months.
Note: the graph doesn't start at zero to better show the change.
Employment posts yesterday:
Friday, July 02, 2010
Illinois and California: State Basket Cases
by Calculated Risk on 7/02/2010 11:25:00 PM
A couple of stories ...
From the NY Times: Illinois Stops Paying Its Bills, but Can’t Stop Digging Hole
For the last few years, California stood more or less unchallenged as a symbol of the fiscal collapse of states during the recession. Now Illinois has shouldered to the fore, as its dysfunctional political class refuses to pay the state’s bills and refuses to take the painful steps — cuts and tax increases — to close a deficit of at least $12 billion, equal to nearly half the state’s budget.From the LA Times PolitiCal: Appeals court affirms Schwarzenegger's order to cut state workers' pay
Then there is the spectacularly mismanaged pension system, which is at least 50 percent underfunded and, analysts warn, could push Illinois into insolvency if the economy fails to pick up.
A state appeals court ruled Friday that Gov. Arnold Schwarzenegger can reduce state workers' pay to the federal minimum wage when the state budget is late.The state problems will be a drag on the economy for some time.
The ruling comes a day after the governor ordered the pay of nearly 200,000 state employees to be reduced to $7.25 an hour until a budget is passed ...
Employment posts today:
Unofficial Problem Bank List at 798 Institutions
by Calculated Risk on 7/02/2010 08:45:00 PM
Note: this is an unofficial list of Problem Banks compiled only from public sources.
Here is the unofficial problem bank list for July 2, 2010.
Changes and comments from surferdude808:
The Unofficial Problem Bank List underwent minor changes after a flurry of activity last week. It looks like the FDIC is taking the holiday weekend off.
The only changes were the addition of two institutions -- United Western Bank, Denver, CO ($2.6 billion Ticker: UWBK); and Cecil Bank, Elkton, MD ($513 million Ticker: CECB); and one removal from a voluntary liquidation -- American Trust & Savings Bank, Whiting, IN ($119 million). At mid-year 2010, the list stands at 798 institutions with aggregate assets of $412.6 billion.
With the passage of another quarter, we thought it was time to update the transition matrix. The Unofficial Problem Bank List debuted on August 7, 2009 with 389 institutions with assets of $276.3 billion (see table). Over the past ten months, 119 institutions have been removed with 87 due to failure, 22 due to action termination, and 10 due to unassisted merger. Thus, 73 percent of the removals are from failure. Moreover, 22.4 percent of the 389 institutions on the original list have failed, which is substantially higher than the 12 percent figure usually cited by the media as the failure rate for institutions on the FDIC Problem Bank List.
More distressing, however, is that failed institutions represented 55 percent or $152.9 billion of the $276.3 billion assets on the original list. Notable failures include Colonial Bank ($26.4 billion); Westernbank Puerto Rico ($15.1 billion); AmTrust Bank ($14.4 billion); Guaranty Bank ($14.3 billion); Corus Bank (7.6 billion); First Federal Bank of California ($6.8 billion); California National Bank ($6.5 billion); and Amcore Bank ($5.2 billion).
Other changes to the original list include the addition of 602 institutions. However, only 528 of those 602 additions are on the current list as 74 institutions have been removed in the interim. Of the 74 interim removals, 62 were due to failure, 10 were due to unassisted merger, and one each from action termination and voluntary liquidation. Again, failure represents a disproportionate 83.7 percent of the reason for removal. 872 institutions have made an appearance on the Unofficial Problem Bank List and 149 or 17 percent have failed. The average asset size of removals because of failure is $623 million. Currently, the average asset size of institutions is $517 million versus $710 million on the original list. Thus, the average asset size of future failures will likely be lower, which is the only positive in the data.
| Unofficial Problem Bank List | |||
|---|---|---|---|
| Change Summary | |||
| Number of Institutions | Assets ($Thousands) | ||
| Start (8/7/2009) | 389 | 276,313,429 | |
| Subtractions | |||
| Action Terminated | 22 | (3,272,910) | |
| Unassisted Merger | 10 | (1,317,634) | |
| Failures | 87 | (152,932,468) | |
| Asset Change | (9,337,980) | ||
| Still on List at 7/02/2010 | 270 | 109,452,437 | |
| Additions | 528 | 303,142,129 | |
| End (4/02/2010) | 798 | 412,594,566 | |
| Interperiod Deletions1 | |||
| Action Terminated | 1 | 37,695 | |
| Unassisted Merger | 10 | 1,769,600 | |
| Voluntary Liquidation | 1 | 119,082 | |
| Failures | 62 | 60,103,942 | |
| Total | 74 | 62,030,319 | |
| 1Institution not on 8/7/2009 or 7/02/2010 list but appeared on a list between these dates. | |||
Fewest Teen Jobs added in June since 1951
by Calculated Risk on 7/02/2010 04:18:00 PM
According to the BLS, only 497,000 teens (ages 16 to 19) found jobs in June 2010 NSA (June is the key months for summer employment). This is the fewest teen jobs added in June since 1951. Click on graph for larger image in new window.
This graph shows the number of teens looking for work (lowest since 1954) and the number of teens found jobs in June (data is not seasonally adjusted).
This partially explains the large drop in participation rate in June - an extremely low number of teenagers joined the workforce, and this resulted in 256,000 teens leaving the workforce on a seasonally adjusted basis - of the total 652,000 total people leaving the workforce (seasonally adjusted).
Teens not looking for jobs - because the job market is so bad - actually helped push down the unemployment rate!
Earlier employment posts today:
Personal Bankruptcy Filings up 14% in first 6 months of 2010
by Calculated Risk on 7/02/2010 01:45:00 PM
From the American Bankruptcy Institute: Consumer Bankruptcy Filings up 14 percent through First Half of 2010
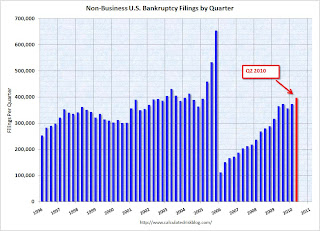
U.S. consumer bankruptcy filings totaled 770,117 nationwide during the first six months of 2010 (Jan. 1-June 30), a 14 percent increase over the 675,351 total consumer filings during the same period a year ago, according to the American Bankruptcy Institute (ABI), relying on data from the National Bankruptcy Research Center (NBKRC). The consumer filings for the first half of 2010 represent the highest total since 2005, when Congress enacted the Bankruptcy Abuse Prevention and Consumer Protection Act to try and stem the tide of filings, although the number of monthly consumer filings has been steadily decreasing since March.
"Years of rising consumer debt and low savings rates, combined with the housing and unemployment crises, are causing bankruptcy levels not seen since the 2005 amendments to the Bankruptcy Code," said ABI Executive Director Samuel J. Gerdano. "We expect that there will be more than 1.6 million new bankruptcy filings by year end."
The overall June consumer filing total of 126,270 was 8.5 percent more than the 116,365 consumer filings recorded in June 2009.
 Click on graph for larger image in new window.
This graph shows the non-business bankruptcy filings by quarter using monthly data from the ABI and previous quarterly data from USCourts.gov.
Excluding 2005, when the so-called "Bankruptcy Abuse Prevention and Consumer Protection Act of 2005" was enacted (really a pro-lender act), the record year was in 2003 when 1.62 million personal bankruptcies were filed. This year will be close to that level.
Employment Report: Temporary Help and Diffusion Index
by Calculated Risk on 7/02/2010 11:47:00 AM
This post is a little more technical ...
Temporary Help
From the BLS report:
Within professional and business services, employment continued to increase in temporary help services (+21,000). Employment in temporary help has risen by 379,000 since a recent low in September 2009.The following graph was used early this year as the basis for some optimistic employment forecasts.
 This graph is a little complicated. The red line is the three month average change in temporary help services (left axis). This is shifted four months into the future.
The blue line (right axis) is the three month average change in total employment (excluding temporary help services).
Unfortunately the data on temporary help services only goes back to 1990, but it does appear that temporary help leads employment by about four months.
The thinking is that before companies hire permanent employees following a recession, employers will first increase the hours worked of current employees (hours worked decreased slightly in June) and also hire temporary employees. After the number of temporary workers increased sharply late last year, some people thought this might be signaling the beginning of a strong employment recovery.
I was skeptical and joked that "We're all temporary now!" - and now temporary hiring is growing at a slower pace and it appears the hoped for surge in overall hiring didn't happen.
Note that the temporary hiring for the Census is excluded from this graph.
Diffusion Index
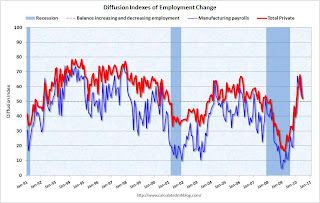 The BLS diffusion index for total private employment decreased to 52.2 from 54.8 in May. For manufacturing, the diffusion index is at 52.4; down sharply from 62.2 in May.
Think of this as a measure of how widespread job gains are across industries. The further from 50 (above or below), the more widespread the job losses or gains reported by the BLS. From the BLS:
Figures are the percent of industries with employment increasing plus one-half of the industries with unchanged employment, where 50 percent indicates an equal balance between industries with increasing and decreasing employment.The increase in the diffusion index earlier this year was one of the clear positives in the monthly employment reports. The decrease in the diffusion index in June (almost falling to 50%), is disappointing.
Earlier employment posts today:
Employment-Population Ratio, Part Time Workers, Unemployed over 26 Weeks
by Calculated Risk on 7/02/2010 09:53:00 AM
Here are a few more graphs based on the employment report ...
Percent Job Losses During Recessions, aligned at Bottom Click on graph for larger image.
This graph shows the job losses from the start of the employment recession, in percentage terms - but this time aligned at the bottom of the recession.
The current recession bounced along the bottom for a few months - so the choice of bottom is a little arbitrary (plus or minus a month or two).
The dotted line shows the impact of Census hiring. In June, there were 339,000 temporary 2010 Census workers on the payroll. The number of Census workers will continue to decline - and the gap between the solid and dashed red lines will be mostly closed in three or four months.
Employment-Population Ratio
The Employment-Population ratio decreased to 58.5% in June from 58.7% in May. This had been increasing after plunging since the start of the recession, and the recovery in the Employment-Population ratio was considered a good sign - but the ratio has now decreased for two consecutive months. This graph shows the employment-population ratio; this is the ratio of employed Americans to the adult population.
Note: the graph doesn't start at zero to better show the change.
The Labor Force Participation Rate decreased to 64.7% from 65.0% in May. This is the percentage of the working age population in the labor force. This decline is very disappointing, and the rate is well below the 66% to 67% rate that was normal over the last 20 years.
The reason the unemployment rate declined was because people left the workforce - and that is not good news. As the employment picture improves, people will return to the labor force, and that will put upward pressure on the unemployment rate.
Part Time for Economic Reasons  From the BLS report:
The number of persons employed part time for economic reasons (some times referred to as involuntary part-time workers), at 8.6 million, was little changed over the month but was down by 525,000 over the past 2 months. These individuals were working part time because their hours had been cut back or because they were unable to find a full-time job.The number of workers only able to find part time jobs (or have had their hours cut for economic reasons) was at 8.63 million in June. This slight decline was a little bit of good news.
The all time record of 9.24 million was set in October.
These workers are included in the alternate measure of labor underutilization (U-6) that was at 16.5% in June.
Unemployed over 26 Weeks
 The blue line is the number of workers unemployed for 27 weeks or more. The red line is the same data as a percent of the civilian workforce.
According to the BLS, there are 6.751 million workers who have been unemployed for more than 26 weeks and still want a job. This is a record 4.39% of the civilian workforce. (note: records started in 1948). It does appear the increases are slowing ... perhaps because people are giving up.
Summary
The underlying details of the employment report were mixed. The positives: the economy added 100 thousand payroll jobs ex-Census (still weak but better than in May), the unemployment rate decreased to 9.5%, the number of part time workers (for economic reasons) decreased slightly helping to push down U-6 to 16.5% (from 16.6%).
Negatives include the declines in the participation rate and employment-population rate, the slight decrease in hourly wages, the decline in average hours worked, and a record percent of workers unemployed for more than 26 weeks. The number of long term unemployed is one of the key stories of this recession, especially since many of them are now losing their unemployment benefits.
Overall this was a weak report.
Earlier employment post today:
June Employment Report: 100K Jobs ex-Census, 9.5% Unemployment Rate
by Calculated Risk on 7/02/2010 08:30:00 AM
From the BLS:
Total nonfarm payroll employment declined by 125,000 in June, and the unemployment rate edged down to 9.5 percent, the U.S. Bureau of Labor Statistics reported today. The decline in payroll employment reflected a decrease (-225,000) in the number of temporary employees working on Census 2010. Private-sector payroll employment edged up by 83,000.Census 2010 hiring decreased 225,000 in June. Non-farm payroll employment increased 100,000 in June ex-Census.
 Click on graph for larger image.
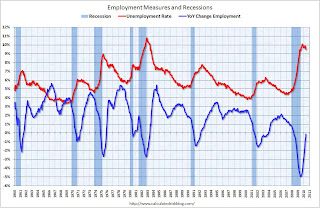
This graph shows the unemployment rate and the year over year change in employment vs. recessions.
Nonfarm payrolls decreased by 125 thousand in June. The economy has lost 170 thousand jobs over the last year, and 7.5 million jobs since the recession started in December 2007.
Ex-Census hiring, the economy added 100,000 jobs in June. The unemployment rate fell to 9.5 percent.
The second graph shows the job losses from the start of the employment recession, in percentage terms (as opposed to the number of jobs lost).The dotted line is ex-Census hiring. The two lines will rejoin later this year when the Census hiring is unwound.
For the current employment recession, employment peaked in December 2007, and this recession is by far the worst recession since WWII in percentage terms, and 2nd worst in terms of the unemployment rate (only early '80s recession with a peak of 10.8 percent was worse).
The decrease in the unemployment rate was because of a decline in the participation rate - and that is not good news. Although better than May, this is still a weak report. I'll have much more soon ...
Thursday, July 01, 2010
Employment Report: Which payroll number to use?
by Calculated Risk on 7/01/2010 09:56:00 PM
Reading some of the employment preview articles tonight, I can see there will be some confusion just like last month. In May there were three payroll numbers commonly reported:
This created some confusion because I reported the underlying trend as +20,000 ex-Census, and many other reports used the private sector hiring of +41,000.
All three numbers have meaning, but the number consistent with previous reports (after removing temporary Census workers) was +20,000.
Tomorrow some sites will report private sector payroll jobs only - and that is not the correct method to remove the temporary Census workers and is inconsistent with previous reports (unless they were reporting private sector jobs only). Government hiring counts, especially since state and local governments might be cutting back later this year.
I will use the headline number and adjust by the number of temporary Census hires (the number will be reported here).


