 RSS Feed
 by Calculated Risk on 7/02/2010 11:47:00 AM
Friday, July 02, 2010
Employment Report: Temporary Help and Diffusion Index
This post is a little more technical ...
Temporary Help
From the BLS report:
Within professional and business services, employment continued to increase in temporary help services (+21,000). Employment in temporary help has risen by 379,000 since a recent low in September 2009.The following graph was used early this year as the basis for some optimistic employment forecasts.
 This graph is a little complicated. The red line is the three month average change in temporary help services (left axis). This is shifted four months into the future.
The blue line (right axis) is the three month average change in total employment (excluding temporary help services).
Unfortunately the data on temporary help services only goes back to 1990, but it does appear that temporary help leads employment by about four months.
The thinking is that before companies hire permanent employees following a recession, employers will first increase the hours worked of current employees (hours worked decreased slightly in June) and also hire temporary employees. After the number of temporary workers increased sharply late last year, some people thought this might be signaling the beginning of a strong employment recovery.
I was skeptical and joked that "We're all temporary now!" - and now temporary hiring is growing at a slower pace and it appears the hoped for surge in overall hiring didn't happen.
Note that the temporary hiring for the Census is excluded from this graph.
Diffusion Index
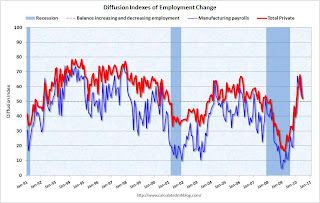 The BLS diffusion index for total private employment decreased to 52.2 from 54.8 in May. For manufacturing, the diffusion index is at 52.4; down sharply from 62.2 in May.
Think of this as a measure of how widespread job gains are across industries. The further from 50 (above or below), the more widespread the job losses or gains reported by the BLS. From the BLS:
Figures are the percent of industries with employment increasing plus one-half of the industries with unchanged employment, where 50 percent indicates an equal balance between industries with increasing and decreasing employment.The increase in the diffusion index earlier this year was one of the clear positives in the monthly employment reports. The decrease in the diffusion index in June (almost falling to 50%), is disappointing.
Earlier employment posts today:


