 RSS Feed
 by Calculated Risk on 7/02/2010 08:30:00 AM
Friday, July 02, 2010
June Employment Report: 100K Jobs ex-Census, 9.5% Unemployment Rate
From the BLS:
Total nonfarm payroll employment declined by 125,000 in June, and the unemployment rate edged down to 9.5 percent, the U.S. Bureau of Labor Statistics reported today. The decline in payroll employment reflected a decrease (-225,000) in the number of temporary employees working on Census 2010. Private-sector payroll employment edged up by 83,000.Census 2010 hiring decreased 225,000 in June. Non-farm payroll employment increased 100,000 in June ex-Census.
 Click on graph for larger image.
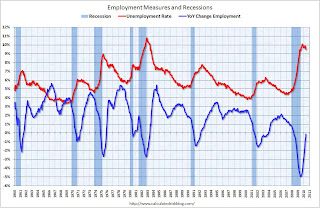
This graph shows the unemployment rate and the year over year change in employment vs. recessions.
Nonfarm payrolls decreased by 125 thousand in June. The economy has lost 170 thousand jobs over the last year, and 7.5 million jobs since the recession started in December 2007.
Ex-Census hiring, the economy added 100,000 jobs in June. The unemployment rate fell to 9.5 percent.
 The second graph shows the job losses from the start of the employment recession, in percentage terms (as opposed to the number of jobs lost).
The dotted line is ex-Census hiring. The two lines will rejoin later this year when the Census hiring is unwound.
For the current employment recession, employment peaked in December 2007, and this recession is by far the worst recession since WWII in percentage terms, and 2nd worst in terms of the unemployment rate (only early '80s recession with a peak of 10.8 percent was worse).
The decrease in the unemployment rate was because of a decline in the participation rate - and that is not good news. Although better than May, this is still a weak report. I'll have much more soon ...
Thursday, July 01, 2010
Employment Report: Which payroll number to use?
by Calculated Risk on 7/01/2010 09:56:00 PM
Reading some of the employment preview articles tonight, I can see there will be some confusion just like last month. In May there were three payroll numbers commonly reported:
This created some confusion because I reported the underlying trend as +20,000 ex-Census, and many other reports used the private sector hiring of +41,000.
All three numbers have meaning, but the number consistent with previous reports (after removing temporary Census workers) was +20,000.
Tomorrow some sites will report private sector payroll jobs only - and that is not the correct method to remove the temporary Census workers and is inconsistent with previous reports (unless they were reporting private sector jobs only). Government hiring counts, especially since state and local governments might be cutting back later this year.
I will use the headline number and adjust by the number of temporary Census hires (the number will be reported here).
Housing: Timing for reported increase in Months-of-Supply and Decrease in House Prices
by Calculated Risk on 7/01/2010 07:10:00 PM
Some housing statistics are released with a long lag. Here is an overview ...
Earlier today, the NAR reported that the NAR's Pending Home Sales Index (PHSI) declined to a record low 77.6 in May. Although there is some variability, the PHSI usually leads existing home sales by about 45 to 60 days, so this suggests existing home sales will decline sharply in July. Of course we already knew this since tax credit buyers had to close by June 30th before the closing extension.
Note: The closing date for the tax credit was extended until Sept 30th, but that will only boost sales in July a little. (See from Reuters: US Congress Backs Home Tax Credit Extension)
In January 2009, the Pending Home Sales Index fell to a then record low 80.4. Two months later, existing home sales in March 2009 were at a 4.61 million rate. We can use that to estimate sales and months of supply in July.
If we assume sales fall a little little lower level in July 2010 than in March 2009 (because of the new record low PHSI), to say a 4.5 million sales rate, and that inventory stays about the same as in May 2010, say 3.9 million units for sale, the months-of-supply in July will be:
3.9 million units of inventory divided by 4.5 million existing sales (SAAR) times 12 months = 10.4 months of supply.
Maybe sales will be a little higher, or inventory a little lower, but the months-of-supply should be close to double digits in July.
Earlier I posted this graph showing the relationship between months-of-supply and the change in house prices (change in house prices plotted inverted to show the relationship):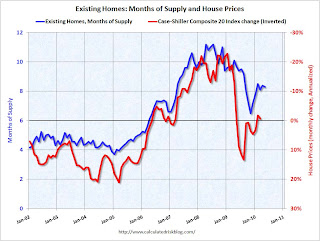 Click on graph for larger image in new window.
This graph shows months of supply from NAR, and the annualized change in the Case-Shiller Composite 20 house price index (inverted).
Below 6 months of supply (blue line) house prices are typically rising (red line, inverted).
Above 6 months of supply house prices are usually falling (although there were many programs to support house prices over the last year).
Since the months-of-supply will probably be close to 10 months this summer, house prices will probably be falling again. I don't expect dramatic price declines later this year because prices are much closer to normal now, based on price-to-rent and price-to-income measures, than in 2007 and 2008. But I do expect falling house prices.
However it will take some time for this to show up in the house price indexes. The Case-Shiller index is a three month average and is released with a two month lag (the release this week was for a three month average ending in April).
The first Case-Shiller release with July prices will be released at the end of September - and that will include the months of May, June and July! And prices will be up in May and June.
The Corelogic data for July will also be released in September. There are other repeat sales measures (like from Radar Logic and Clear Capital), but in general it will be a long wait before reported house prices are falling.
U.S. Light Vehicle Sales 11.1 Million SAAR in June
by Calculated Risk on 7/01/2010 03:43:00 PM
Based on an estimate from Autodata Corp, light vehicle sales were at a 11.08 million SAAR in June. That is up 14% from June 2009 (when sales were very low), and down 4.6% from the May sales rate. Click on graph for larger image in new window.
This graph shows the historical light vehicle sales (seasonally adjusted annual rate) from the BEA (blue) and an estimate for June (red, light vehicle sales of 11.08 million SAAR from Autodata Corp).
The second graph shows light vehicle sales since the BEA started keeping data in 1967. Note: dashed line is current month sales rate.
Auto sales have recovered from the low levels of early 2009, but are below the lowest point of the '90/'91 recession (even with a larger number of registered drivers).
This was below most forecasts of around 11.4 million SAAR.
Hotel Occupancy Rate increases compared to same week in 2009
by Calculated Risk on 7/01/2010 02:40:00 PM
From HotelNewsNow.com: STR reports US results for week ending 26 June 2010
In year-over-year measurements, the industry's occupancy last week increased 6.8 percent to 69.7 percent. Average daily rate rose 1.1 percent to US$98.79. Revenue per available room rose 7.9 percent to US$68.88.The following graph shows the four week moving average for the occupancy rate by week for 2008, 2009 and 2010 (and a median for 2000 through 2007).
 Click on graph for larger image in new window.
Notes: the scale doesn't start at zero to better show the change.
On a 4-week basis, occupancy is up 5.4% compared to last year (the worst year since the Great Depression) and still 7.7% below normal. About half way back ...
Last year leisure travel held up better than business travel and leisure travel (summer) is the key for the next couple of months.
Data Source: Smith Travel Research, Courtesy of HotelNewsNow.com
Construction Spending declined in May
by Calculated Risk on 7/01/2010 12:25:00 PM
Overall construction spending declined in May, and private construction spending, both residential and non-residential, also decreased. From the Census Bureau: May 2010 Construction at $841.9 Billion Annual Rate
The U.S. Census Bureau of the Department of Commerce announced today that construction spending during May 2010 was estimated at a seasonally adjusted annual rate of $841.9 billion, 0.2 percent below the revised April estimate of $843.3 billion.
...
Spending on private construction was at a seasonally adjusted annual rate of $536.3 billion, 0.5 percent below the revised April estimate of $538.9 billion. Residential construction was at a seasonally adjusted annual rate of $260.8 billion in May, 0.4 percent below the revised April estimate of $261.7 billion. Nonresidential construction was at a seasonally adjusted annual rate of $275.6 billion in May, 0.6 percent below the revised April estimate of $277.2 billion.
 Click on graph for larger image in new window.
This graph shows private residential and nonresidential construction spending since 1993. Note: nominal dollars, not inflation adjusted.
Private residential construction spending appears to have bottomed in early 2009, but has only increased gradually since then. Residential spending is now 61% below the peak of early 2006.
Private non-residential construction spending is now 33% below the peak of late 2008.
Residential spending will probably exceed non-residential later this year (or early 2011), but that will be mostly because of weakness in non-residential construction, as opposed to any significant increase in residential spending.
General Motors: Sales up 10.7% compared to June 2009
by Calculated Risk on 7/01/2010 11:00:00 AM
From MarketWatch: General Motors U.S. June sales rise 10.7%.
General Motors Co. said Thursday that June U.S. sales rose 10.7% to 195,380 vehicles from 176,571 in the year-ago period.This seems very weak considering GM was in bankruptcy last June.
This is based on an easy comparison in several ways: in June 2009 U.S. light vehicle sales fell almost 30% to 9.7 million (SAAR) from 13.8 million (SAAR) in June 2008. The sharp decline last year was due to the financial crisis, the recession, and of course the Chrysler and GM bankruptcy filings (Chrysler filed for bankruptcy at the end of April, 2009 and GM filed for bankruptcy on June 1, 2009).
I'll add reports from the other major auto companies as updates to this post.
Update 1: From MarketWatch: Ford total sales rise 13.3% to 175,895 units
Update 2: From MarketWatch: Chrysler U.S. June sales jump 35% to 92,482 units
Update 3: From MarketWatch: Toyota U.S. June sales rise 6.8% to 140,604 units
NOTE: Once all the reports are released, I'll post a graph of the estimated total June sales (SAAR: seasonally adjusted annual rate) - usually around 4 PM ET. Most estimates are for a decrease to 11.4 million in June from the 11.6 million SAAR in May.
ISM Mfg index shows slower expansion in June, Pending Home sales collapse
by Calculated Risk on 7/01/2010 10:00:00 AM
A two-in-one post ...
PMI at 56.2% in June down from 59.7% in May.
From the Institute for Supply Management: June 2010 Manufacturing ISM Report On Business®
Economic activity in the manufacturing sector expanded in June for the 11th consecutive month, and the overall economy grew for the 14th consecutive month, say the nation's supply executives in the latest Manufacturing ISM Report On Business®.And from the NAR: Pending Home Sales Drop as Expected
The report was issued today by Norbert J. Ore, CPSM, C.P.M., chair of the Institute for Supply Management™ Manufacturing Business Survey Committee. "The manufacturing sector continued to grow during June; however, the rate of growth as indicated by the PMI slowed when compared to May. The lower reading for the PMI came from a slowing in the New Orders and Production Indexes. We are now 11 months into the manufacturing recovery, and given the robust nature of recent growth, it is not surprising that we would see a slower rate of growth at this time. The sector appears to be solidly entrenched in the recovery. Comments from the respondents remain generally positive, but expectations have been that the second half of the year will not be as strong in terms of the rate of growth, and June appears to validate that forecast."
...
ISM's New Orders Index registered 58.5 percent in June, which is a decrease of 7.2 percentage points when compared to the 65.7 percent reported in May.
...
ISM's Employment Index registered 57.8 percent in June, which is 2 percentage points lower than the 59.8 percent reported in May.
emphasis added
The Pending Home Sales Index, a forward-looking indicator, dropped 30.0 percent to 77.6 based on contracts signed in May from a reading of 110.9 in April ... NAR chief economist Lawrence Yun said, “The sharp decline in contract signings in May is a natural result with similar low levels of sales activity anticipated in June.”Both the ISM index and pending home sales were below consensus.
Weekly Initial Unemployment Claims increase to 472,000
by Calculated Risk on 7/01/2010 08:30:00 AM
The DOL reports on weekly unemployment insurance claims:
In the week ending June 26, the advance figure for seasonally adjusted initial claims was 472,000, an increase of 13,000 from the previous week's revised figure of 459,000. The 4-week moving average was 466,500, an increase of 3,250 from the previous week's revised average of 463,250.
...
The advance number for seasonally adjusted insured unemployment during the week ending June 19 was 4,616,000, an increase of 43,000 from the preceding week's revised level of 4,573,000.
 Click on graph for larger image in new window.
This graph shows the 4-week moving average of weekly claims since January 2000.
The four-week average of weekly unemployment claims increased this week by 3,250 to 466,500.
The dashed line on the graph is the current 4-week average.
Initial weekly claims have been at about the same level since December 2009. Historically the current level of 472,000, and 4-week average of 466,500, would suggest ongoing weakness in the labor market.
Wednesday, June 30, 2010
Fannie Mae: Serious Delinquency rate declines in April
by Calculated Risk on 6/30/2010 09:55:00 PM
 Click on graph for larger image in new window.
Fannie Mae reported today that the rate of serious delinquencies - at least 90 days behind - for conventional loans in its single-family guarantee business decreased to 5.30% in April, down from 5.47% in March - and up from 3.42% in April 2009.
"Includes seriously delinquent conventional single-family loans as a percent of the total number of conventional single-family loans."
This is similar to the report from Freddie Mac (although Fannie Mae releases data one month later). Just as for Freddie Mac, some of the earlier rapid increase was probably because of foreclosure moratoriums, and distortions from modification programs because loans in trial mods were considered delinquent until the modifications were made permanent.
More modifications have become permanent (and no longer counted as delinquent) and Fannie Mae is foreclosing again (they have a record number of REOs) - so there has been a slight decline in the delinquency rate.


