 RSS Feed
 by Calculated Risk on 7/01/2010 07:10:00 PM
Thursday, July 01, 2010
Housing: Timing for reported increase in Months-of-Supply and Decrease in House Prices
Some housing statistics are released with a long lag. Here is an overview ...
Earlier today, the NAR reported that the NAR's Pending Home Sales Index (PHSI) declined to a record low 77.6 in May. Although there is some variability, the PHSI usually leads existing home sales by about 45 to 60 days, so this suggests existing home sales will decline sharply in July. Of course we already knew this since tax credit buyers had to close by June 30th before the closing extension.
Note: The closing date for the tax credit was extended until Sept 30th, but that will only boost sales in July a little. (See from Reuters: US Congress Backs Home Tax Credit Extension)
In January 2009, the Pending Home Sales Index fell to a then record low 80.4. Two months later, existing home sales in March 2009 were at a 4.61 million rate. We can use that to estimate sales and months of supply in July.
If we assume sales fall a little little lower level in July 2010 than in March 2009 (because of the new record low PHSI), to say a 4.5 million sales rate, and that inventory stays about the same as in May 2010, say 3.9 million units for sale, the months-of-supply in July will be:
3.9 million units of inventory divided by 4.5 million existing sales (SAAR) times 12 months = 10.4 months of supply.
Maybe sales will be a little higher, or inventory a little lower, but the months-of-supply should be close to double digits in July.
Earlier I posted this graph showing the relationship between months-of-supply and the change in house prices (change in house prices plotted inverted to show the relationship):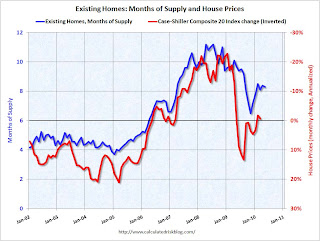 Click on graph for larger image in new window.
This graph shows months of supply from NAR, and the annualized change in the Case-Shiller Composite 20 house price index (inverted).
Below 6 months of supply (blue line) house prices are typically rising (red line, inverted).
Above 6 months of supply house prices are usually falling (although there were many programs to support house prices over the last year).
Since the months-of-supply will probably be close to 10 months this summer, house prices will probably be falling again. I don't expect dramatic price declines later this year because prices are much closer to normal now, based on price-to-rent and price-to-income measures, than in 2007 and 2008. But I do expect falling house prices.
However it will take some time for this to show up in the house price indexes. The Case-Shiller index is a three month average and is released with a two month lag (the release this week was for a three month average ending in April).
The first Case-Shiller release with July prices will be released at the end of September - and that will include the months of May, June and July! And prices will be up in May and June.
The Corelogic data for July will also be released in September. There are other repeat sales measures (like from Radar Logic and Clear Capital), but in general it will be a long wait before reported house prices are falling.


