 RSS Feed
 by Calculated Risk on 6/15/2010 03:47:00 PM
Tuesday, June 15, 2010
Employment and Real GDP, Real GDI
Last night I excerpted from a speech by St Louis Fed President James Bullard. I noted that GDI might be more useful in measuring the recovery than GDP (they are conceptually equivalent).
As a followup to that post (and also to the previous post with the forecast from UCLA-Anderson's Ed Learmer), here are two graphs looking at payroll employment vs. the change in real GDP and real GDI.
At the bottom of this post are estimates of the unemployment rate in 12 months for several growth scenarios. Note: This is similar to Okun's relationship between GDP and unemployment.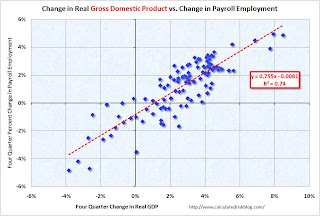 Click on graph for larger image.
The first graph shows the four quarter change in real GDP vs. the four quarter change in employment, as a percent of payroll employment (to normalize for changes in payroll over time).
The second graph shows the same relationship, but uses Gross Domestic Income instead of GDP. There is a clear relationship - the higher the change in the real GDP or real GDI, the larger the increase in payroll employment. The R2 for GDI is slightly higher than for GDP (0.80 vs. 0.74).
This shows that real GDP / real GDI has to grow at a sustained rate of about 1% just to keep the net change in payroll jobs at zero.
A 3% increase in real GDI (over a year) would lead to about a 1.4% increase in payroll employment. With approximately 130 million payroll jobs, a 1.4% increase in payroll employment would be just over 1.8 million jobs over the next year - and the unemployment rate would probably remain close to the current level (9.7%) depending on changes in population and the participation rate.
The following table summarizes several growth scenarios. The unemployment rate is from the household survey and depends on the number of people in the work force - so it cannot be calculated directly. The table uses a range of unemployment rates based on 1.6 to 2.1 million people entering the workforce over the next 12 months (a combination of population growth and discouraged workers reentering the work force).
NOTE: For those interested in understanding the differences between the household and establishment employment surveys - and why the unemployment rate cannot be calculated directly from the payroll report, see: Jobs and the Unemployment Rate
| Real Growth | Percent Payroll Growth | Annual Payroll Growth (000s) | Monthly Payroll Growth (000s) | Unemployment Rate in One Year1 |
|---|---|---|---|---|
| 6.0% | 3.6% | 4648 | 387 | 7.6% to 7.9% |
| 5.0% | 2.9% | 3718 | 310 | 8.2% to 8.5% |
| 4.0% | 2.1% | 2787 | 232 | 8.8% to 9.1% |
| 3.0% | 1.4% | 1857 | 155 | 9.4% to 9.7% |
| 2.0% | 0.7% | 926 | 77 | 10.0% to 10.3% |
| 1.0% | 0.0% | -4 | 0 | 10.6% to 10.9% |
| 1The unemployment rate is from the Household Survey and depends on several factors including changes in population and the participation rate. | ||||
I think Leamer is a little optimistic for 2010 - I'm expecting a 2nd half slowdown in GDP growth this year - and I think the unemployment rate will stay near the current level for some time.
UCLA's Leamer: "A Homeless Recovery"
by Calculated Risk on 6/15/2010 12:14:00 PM
From UCLA: UCLA Anderson Forecast: U.S. recovery a long, slow climb; Calif. recovery weaker than nation's
"If the next year is going to bring exceptional growth," [UCLA Anderson Forecast director Edward] Leamer writes, "consumers will need to express their optimism in the way that really counts — buying homes and cars. And that is not going to happen if businesses continue to express their pessimism in the way that really counts — by not hiring workers."A couple of key points:
The result is an economic Catch-22.
Leamer explains that significant reductions in the unemployment rate require real gross domestic product (GDP) growth in the 5.0 percent to 6.0 percent range. Normal GDP growth is 3.0 percent, enough to sustain unemployment levels, but not strong enough to put Americans back to work. As a consequence, consumers concerned about their employment status are reluctant to spend, and businesses concerned about growth are reluctant to hire.
The forecast for GDP growth this year is 3.4 percent, followed by 2.4 percent in 2011 and 2.8 percent in 2012, well below the 5.0 percent growth of previous recoveries and even a bit below the 3.0 percent long-term normal growth. With this weak economic growth comes a weak labor market, and unemployment slowly declines to 8.6 percent by 2012.
NAHB Builder Confidence declines sharply in June
by Calculated Risk on 6/15/2010 10:00:00 AM
Note: any number under 50 indicates that more builders view sales conditions as poor than good.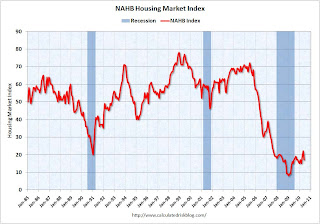 Click on graph for larger image in new window.
This graph shows the builder confidence index from the National Association of Home Builders (NAHB).
The housing market index (HMI) was at 17 in June. This was a sharp decline from 22 in May.
The record low was 8 set in January 2009. This is still very low ... This second graph compares the NAHB HMI (left scale) with single family housing starts (right scale). This includes the June release for the HMI and the April data for starts (May starts will be released tomorrow).
This shows that the HMI and single family starts mostly move generally in the same direction - although there is plenty of noise month-to-month.
Press release from the NAHB: Builder Confidence Declines in June
Snapping a string of two consecutive monthly gains, builder confidence in the market for newly built, single-family homes fell back to February levels, before the beginning of the home buyer tax credit-related surge, according to results of the latest National Association of Home Builders/Wells Fargo Housing Market Index (HMI), released today. The HMI dropped five points to 17 in June.This suggests single family starts will decline sharply soon.
“The home buyer tax credit did its job in stoking spring sales and we expected a temporary pull back in the builders’ outlook after the credit expired at the end of April,” said NAHB Chairman Bob Jones, a home builder from Bloomfield Hills, Mich. “However, the reduction in consumer activity may have been more dramatic than some builders had anticipated, which resulted in their lower confidence levels.”
...
Each of the HMI’s component indexes recorded declines in June. The component gauging current sales conditions fell five points to 17, while the component gauging sales expectations for the next six months declined four points to 23 (from a one-point downward revised index level of 27 in May) and the component gauging traffic of prospective buyers fell two points to 14.
The HMI also posted losses in every region in June. The Northeast, which has the smallest survey sample and is therefore subject to greater month-to-month volatility, fell 17 points to 18 following a 14-point jump in May. The Midwest posted a three-point loss to 14, while the South also registered a three-point decline to 19 and the West fell four points to 15 from a revised May level of 19.
NY Fed: Manufacturing Conditions improve in June
by Calculated Risk on 6/15/2010 08:30:00 AM
From the NY Fed: Empire State Manufacturing Survey
The Empire State Manufacturing Survey indicates that conditions for New York manufacturers improved in June. The general business conditions index edged up from its May level to 19.6, extending its string of positive readings to eleven months. The new orders and shipments indexes were also positive and higher than their May levels. The inventories index remained near zero for a second straight month, indicating that inventory levels were little changed.This came in slightly below expectations. This is more evidence that the inventory adjustment is over. Manufacturing continued to improve, although at a somewhat slower pace than earlier this year.
...
The new orders index rose modestly, to 17.5, and the shipments index climbed to 19.7. The unfilled orders index was negative for a third consecutive month, at -1.2.
...
The index for number of employees slipped 10 points, to 12.4, and the average workweek index climbed from zero last month to 8.6.
Monday, June 14, 2010
Fed's Bullard on the Economy
by Calculated Risk on 6/14/2010 11:59:00 PM
I thought these comments by St Louis Fed President James Bullard today were a little odd: The Global Recovery and Monetary Policy
"As of the first quarter of 2010, real GDP stands just shy of the 2008 second quarter level, so that growth of about 1.25 percent would be sufficient to allow real GDP to surpass the previous peak. At that point, the U.S. economy would be fully "recovered" from the very sharp downturn of late 2008 and early 2009."Fully recovered? Tell that to the millions of unemployed workers.
"To be clear, the 1.25 percent is a quarterly number, and would be 5.0 percent at an annual rate."Uh, I don't think that is clear. The 1.25% is the level real GDP is currently below the pre-recession peak.
What he meant is it would take an annualized quarterly growth rate of about 5% in Q2 to raise real GDP the 1.25% needed to reach the previous peak.
Although I think that 5.0 percent at an annual rate is too much to expect for current quarter real GDP growth, it seems like a reasonable possibility over the next two quarters combined.What he means is he thinks there is "a reasonable possibility" that the economy will grow at an annualized rate of 2.5% over the six months period including Q2 and Q3. That is possible, but I'll take the under.
Given these conditions, I expect the U.S. recovery in GDP to be complete in the third quarter of this year.This is overlooking the weakness in Gross Domestic Income. There are really two measures of GDP: 1) real GDP, and 2) real Gross Domestic Income (GDI). The two measures are conceptually identical, but yield slightly different results.
Recent research suggests that GDI is often more accurate than GDP, especially when the economy is weak. From Fed economist Jeremy Nalewaik, “Income and Product Side Estimates of US Output Growth,” Brookings Papers on Economic Activity.:
Considerable evidence suggests that the growth rates of GDP(I) better represent the business cycle fluctuations in true output growth than do the growth rates of GDP(E). ... These results strongly suggest that economists and statisticians interested in business cycle fluctuations in U.S. output should pay attention to the income-side estimates, and consider using some sort of weighted average of the income- and expenditure-side estimates in their analyses. The evidence in this paper clearly suggests that the weights should be skewed towards GDP(I) ...Real GDI is still 2.3% below the previous peak, and if the economy grows at 3% all year, real GDI will not surpass the previous peak until Q1 2011.
Vacation Cancellations along the Gulf Coast
by Calculated Risk on 6/14/2010 07:51:00 PM
From Kathy Jumper at the Mobile Press-Register: As oil washes ashore, property managers sharply cut condo rents (ht DaveinSV)
Property managers are offering 30 percent to 50 percent cuts at condominium units and beach houses, hoping to fill rooms and prevent cancellations in the wake of the BP oil spill.I'm not sure the lower prices will make much difference. Who wants to vacation at a beach and not be able to swim in the water? Or to see (and probably smell) the oil?
"June has been gutted, as far as rental occupancies," said David Bodenhamer, a partner in Young's Suncoast Vacation Rentals in Gulf Shores ... "We've had $220,000 in cancellations in the last three days." ... "The problem is that even at those lower rates, we're not getting near enough takers. Reservation calls have gone to a fraction of what they would normally be on a daily basis."
The article mentions that Alabama beach resorts generate about 75% of their annual revenue in June, July and August. So this entire season is lost.
On the bright side, other resort areas are probably doing better.
When I went backpacking in the Sierra in the summer of 2008, I asked the ranger how the economy was impacting traffic. He said it was their busiest year ever! People were still going on vacation, just to less expensive destinations. With the Gulf disaster, I expect the inland mountain resorts will have a banner year.
When will the Fed raise rates?
by Calculated Risk on 6/14/2010 03:54:00 PM
Over the last year a number of analysts have predicted the Fed would raise the Fed Funds rate "soon". They have all been wrong.
The Fed's mission is to conduct "monetary policy by influencing the monetary and credit conditions in the economy in pursuit of maximum employment, stable prices, and moderate long-term interest rates". Historically the Fed has not raised the Fed Funds rate until unemployment drops significantly. Based on the the Fed's own forecasts of the unemployment rate and inflation, the Fed will probably not raise the Fed Funds rate until late 2011 at the earliest.
San Francisco Fed senior vice president and associate director of research Glenn Rudebusch writes: The Fed's Exit Strategy for Monetary Policy
Rudebusch's economic letter suggests that the Fed might not raise rates until 2012 ... Click on graph for larger image in new window.
The graph from Rudebusch's shows a modified Taylor rule. According to Rudebusch's estimate, the Fed Funds rate should be around minus 5% right now if we ignore unconventional policy (obviously there is a lower bound):
The resulting simple policy guideline recommends lowering the funds rate by 1.3 percentage points if inflation falls by 1 percentage point and by almost 2 percentage points if the unemployment rate rises by 1 percentage point.
...
Figure 1 also provides a simple perspective on when the Fed should raise the funds rate. The dashed line combines the benchmark rule of thumb with the Federal Open Market Committee’s median economic forecasts (FOMC 2010), which predict slowly falling unemployment and continued low inflation. The dashed line shows that to deliver future monetary stimulus consistent with the past—and ignoring the zero lower bound—the funds rate would be negative until late 2012. In practice, this suggests little need to raise the funds rate target above its zero lower bound anytime soon.
 Rudebusch them modifies the rule taking into account unconventional policy.
 Even though the funds rate was pushed to its zero lower bound by the end of 2008, considerable scope remained to lower long-term interest rates. To do this, the Fed started buying longer-term Treasury and federal agency debt securities ...Perhaps the unemployment rate will decline faster than expected - or inflation will increase - but right now I wouldn't expect an increase in the Fed Funds rate for a long long time ...
The additional stimulus from the Fed’s unconventional monetary policy implies that the appropriate level of short-term interest rates would be higher than shown in Figure 1. ... If the Fed’s purchases reduced long rates by ½ to ¾ of a percentage point, the resulting stimulus would be very roughly equal to a 1½ to 3 percentage point cut in the funds rate. Assuming unconventional policy stimulus is maintained, then the recommended target funds rate from the simple policy rule could be adjusted up by approximately 2¼ percentage points, as shown in Figure 3, and the recommended period of a near-zero funds rate would end at the beginning of 2012.
Moody's Downgrades Greece Ratings to Junk
by Calculated Risk on 6/14/2010 01:21:00 PM
From MarketWatch: Moody's slashes Greece to 'Ba1' from 'A3'
Moody's Investors Service on Monday downgraded Greece's government bond ratings by four notches to junk status of Ba1 from A3 ...No real surprise ...
Report: State and Local cutbacks may cut 0.25% from GDP
by Calculated Risk on 6/14/2010 11:03:00 AM
From Bloomberg: Economy in U.S. Slows as States Lose Federal Stimulus Funds (ht Brian)
State and local cutbacks may trim growth by about a quarter percentage point in 2010 and 2011 ... said Mark Zandi, chief economist at Moody’s Analytics Inc. He also sees the governments lopping payrolls by 200,000 during the next year after reducing them by 190,000 in the 12 months through May.I've been forecasting a 2nd half slowdown in GDP growth based on:
“The budget cutting that is dead ahead will be a significant impediment to economic growth later this year into 2011,” he said in an interview.
1) less Federal stimulus spending in the 2nd half of 2010. The decline in stimulus will probably be a drag of about 0.5% on GDP growth by Q4.
2) the end of the inventory correction. The inventory adjustment contributed 3.8% in Q4 2009 of the 5.6% annualized growth rate, and 1.65% of the 3.0% GDP growth (annualized) in Q1 2010. This will probably fall to zero - or even subtract from growth.
3) more household saving leading to slower growth in personal consumption expenditures,
4) another downturn in housing (lower prices, less residential investment),
5) slowdown in China and Europe and
6) cutbacks at the state and local level. According the Mark Zandi, this will subtract about 0.25% from GDP growth.
David Rosenberg of Gluskin Sheff + Associates wrote this morning:
"A double-dip, admittedly, is not yet a sure thing but I am definitely warming to the view."I still think we will avoid a double dip, but I expect growth to be sluggish and choppy.
A quarter point here, and half point there ... and pretty soon you have some real drag.
BIS reports Bank Exposure to Euro area countries facing market pressure
by Calculated Risk on 6/14/2010 09:02:00 AM
The Bank for International Settlements (BIS) put out the BIS Quarterly Review, June 2010 yesterday. As part of the review, the BIS estimated the exposures of banks by nationality to the residents of Greece, Ireland, Portugal and Spain:
As of 31 December 2009, banks headquartered in the euro zone accounted for almost two thirds (62%) of all internationally active banks’ exposures to the residents of the euro area countries facing market pressures (Greece, Ireland, Portugal and Spain). Together, they had $727 billion of exposures to Spain, $402 billion to Ireland, $244 billion to Portugal and $206 billion to Greece (Graph 3).
French and German banks were particularly exposed to the residents of Greece, Ireland, Portugal and Spain. At the end of 2009, they had $958 billion of combined exposures ($493 billion and $465 billion, respectively) to the residents of these countries. This amounted to 61% of all reported euro area banks’ exposures to those economies. French and German banks were most exposed to residents of Spain ($248 billion and $202 billion, respectively), although the sectoral compositions of their claims differed substantially. French banks were particularly exposed to the Spanish non-bank private sector ($97 billion), while more than half of German banks’ foreign claims on the country were on Spanish banks ($109 billion). German banks also had large exposures to residents of Ireland ($177 billion), more than two thirds ($126 billion) of which were to the non-bank private sector.
French and German banks were not the only ones with large exposures to residents of euro area countries facing market pressures. Banks headquartered in the United Kingdom had larger exposures to Ireland ($230 billion) than did banks based in any other country. More than half of those ($128 billion) were to the non-bank private sector. UK banks also had sizeable exposures to residents of Spain ($140 billion), mostly to the non-bank private sector ($79 billion). Meanwhile, Spanish banks were the ones with the highest level of exposure to residents of Portugal ($110 billion). Almost two thirds of that exposure ($70 billion) was to the non-bank private sector.
 Click on graph for larger image in new window.
 This graph shows the exposure of bank by nationality to the risky countries.
The bailout of the risky countries is very much a bailout of the banks - especially the banks of Germany and France.
The BIS puts the numbers in perspective:
The exposures of BIS reporting banks to the public sectors of the euro area countries facing market pressures can be put into perspective by comparing them with these banks’ capital. The combined exposures of German, French and Belgian banks to the public sectors of Spain, Greece and Portugal amounted to 12.1%, 8.3% and 5.0%, respectively, of their joint Tier 1 capital. By comparison, the combined exposures of Italian, Dutch and Swiss banks to the same public sectors were equal to 2.8%, 2.7% and 2.0%, respectively, of their Tier 1 capital. Those ratios stood at 3.4%, 1.2% and 0.7%, respectively, for Japanese banks and 2.0%, 0.8%, and 0.7%, respectively, for UK banks. The exposures of US banks to each of the above public sectors amounted to less than 1% of their Tier 1 capital.It is the German and French banks that are most at risk.


