 RSS Feed
 by Calculated Risk on 6/09/2010 05:50:00 PM
Wednesday, June 09, 2010
Waste Traffic Indicator?
From Bloomberg: Waste on Freight Cars Gains Most Since ’94 Confirming Rebound (ht Brian)
If garbage is any indication, the U.S. economy is strengthening.And here is the graph:
The number of freight cars carrying waste jumped 45 percent in April and May from the same period last year ... according to the Washington-based Association of American Railroads.
...
Shipments of waste and scrap have a higher correlation with economic growth than coal or copper, according to data compiled by Bloomberg News.
 Click on graph for larger image in new window.
From the Association of American Railroads: Rail Time Indicators: Waste and Scrap Materials traffic in May 2010 was "up 37.1% from May 2009 and down 20.4% from May 2008."
Waste traffic was down from the April level. The Bloomberg article suggests this confirms the "economy is strengthening" - I'd say this shows the recovery has been sluggish (still well below the May 2008 level) and the economy might have slowed in May (although one month doesn't make a trend).
Fed's Beige Book: "modest" economic growth, "Shadow" inventory of Foreclosed Homes
by Calculated Risk on 6/09/2010 02:00:00 PM
From the Federal Reserve: Beige book
Economic activity continued to improve since the last report across all twelve Federal Reserve Districts, although many Districts described the pace of growth as "modest."On Real Estate:
Residential real estate activity improved since the last report. Most Districts noted an increase in home sales and construction prior to the April 30th deadline for the homebuyer tax credit, with contacts in many of these Districts also indicating a corresponding slowing in activity in May. Tight credit, the elevated inventory of homes available for sale, and the "shadow inventory" of foreclosed properties on banks' balance sheets held back residential development in the New York, Cleveland, Atlanta, and Chicago Districts. Commercial real estate activity generally remained weak. Office, industrial, and retail vacancy rates continued to drift upward in many Districts putting downward pressure on rents. However, lower rents were said to have led to an increase in leasing activity in New York, Philadelphia, Richmond, Kansas City, Dallas, and San Francisco. The elevated inventory of existing properties for sale or rent continued to weigh on new private nonresidential construction. However, stronger industrial demand was noted in several Districts. Public construction increased in Philadelphia, Cleveland, and Chicago, but slowed in Minneapolis.This is the first mention of shadow inventory on banks' balance sheet (at least recently).
Happy "Froth" Day
by Calculated Risk on 6/09/2010 12:30:00 PM
Jon Lansner at the O.C. Register notes the fifth anniversary of then Fed Chairman Alan Greenspan's "Froth" speech: Greenspan’s froth not bubble, 5 years later
“Although a ‘bubble’ in home prices for the nation as a whole does not appear likely, there do appear to be, at a minimum, signs of froth in some local markets where home prices seem to have risen to unsustainable levels.” [said Fed Chairman Alan Greenspan, June 9, 2005 in testimony to Congress]Perhaps to celebrate "Froth Day", Fed Chairman Bernanke made this statement:
[U]nderlying housing activity appears to have firmed only a little since mid-2009, with activity being weighed down, in part, by a large inventory of distressed or vacant existing houses and by the difficulties of many builders in obtaining credit.So there are too many "distressed or vacant existing houses", and not enough credit for builders to add to that oversupply.
Bernanke Testimony before House Budget Committee at 10 AM
by Calculated Risk on 6/09/2010 09:50:00 AM
Fed Chairman Ben Bernanke will testify before the House Budget Committee at 10 AM. The topic is State of the Economy: View from the Federal Reserve
Note: Bernanke has promised not to discuss fiscal policy.
Here is the CNBC feed. (starts at 10 AM ET)
Here is the CSpan feed
Prepared testimony: Economic and financial conditions and the federal budget
MBA: Mortgage Purchase Applications decline 35% over last four weeks
by Calculated Risk on 6/09/2010 07:33:00 AM
The MBA reports: Mortgage Applications Decrease in Latest MBA Weekly Survey
The Refinance Index decreased 14.3 percent from the previous week and the seasonally adjusted Purchase Index decreased 5.7 percent from one week earlier.
...
“Purchase and refinance applications dropped this week, even after an adjustment for the Memorial Day holiday. Purchase applications are now 35 percent below their level of four weeks ago, as homebuyers have not yet returned to the market following the expiration of the homebuyer tax credit at the end of April,” said Michael Fratantoni, MBA’s Vice President of Research and Economics. “Although rates remained essentially flat, refinance applications dropped this past week for the first time in a month. Despite the historically low rates, many homeowners have already refinanced recently, remain underwater on their mortgages, have uncertain job situations, or have damaged credit following this downturn, and therefore may not qualify to refinance.”
...
The average contract interest rate for 30-year fixed-rate mortgages decreased to 4.81 percent from 4.83 percent, with points decreasing to 1.02 from 1.05 (including the origination fee) for 80 percent loan-to-value (LTV) ratio loans.
 Click on graph for larger image in new window.
This graph shows the MBA Purchase Index and four week moving average since 1990.
The purchase index has collapsed following the expiration of the tax credit suggesting home sales will fall sharply too. This is the lowest level for the purchase index since February 1997.
Late Night Futures
by Calculated Risk on 6/09/2010 12:04:00 AM
Wednesday: The MBA will release the mortgage purchase applications index. This has been falling sharply suggesting a sharp decline in home sales after the expiration of the tax credit. Also on Wednesday, Wholesale Inventories and the Fed’s Beige Book will be released.
Fed Chairman Ben Bernanke will testify at 10 AM before the house budget committee (the hearing is about the State of the Economy: View from the Federal Reserve), and the NY Fed’s Brian Sack will speak at noon at the New York Association of Business Economics.
The Asian markets are mixed tonight.
The CNBC Pre-Market Data shows the S&P 500 down 6 points and the Dow futures are down about 60 points.
The Euro is down slightly at 1.195 dollars
Best to all.
Tuesday, June 08, 2010
Europe Update: Strikes in Spain, UK Austerity, ECB Bond Purchases
by Calculated Risk on 6/08/2010 06:57:00 PM
Form the NY Times: Spain Hit by Strike Over Austerity Measures
Spanish public workers went on strike on Tuesday against a cut in their wages in what could be the first of several union-led protests against the government’s latest austerity measures.From The Times: Osborne’s four-year austerity programme
George Osborne braced the country for cuts in government spending of up to 20 per cent as he laid the ground for an austerity programme to last the whole parliament.From Der Spiegel (a week ago): ECB Buying Up Greek Bonds (ht Chris)
Bonds worth about €3 billion are now being purchased on every trading day, with €2 billion of the bonds coming from Athens.From Bloomberg: Greek Default Seen by Almost 75% in Poll Doubtful About Trichet
Global investors have little confidence in Europe’s efforts to contain its debt crisis or in European Central Bank President Jean-Claude Trichet, with 73 percent calling a default by Greece likely.From the NY Times: E.U. Finance Ministers Agree on Tighter Oversight
Despite continuing tensions over economic policy, European Union finance ministers agreed Tuesday on far-reaching steps to tighten oversight of national governments’ budgets and crack down on falsification of economic data, in a concerted effort to avert a further loss of confidence in the euro.
Market Update, and the $24 Billion Medicaid Aid to States Debate
by Calculated Risk on 6/08/2010 04:01:00 PM
The euro is up slightly to 1.1944 dollars. The TED spread increased to 43.24 (a measure of credit stress). This TED spread has been increasing slowly ... 
And a market graph from Doug Short of dshort.com (financial planner).
This graph shows the ups and downs of the market since the high in 2007.
And on the issue of state budget cuts, from the NY Times yesterday: Medicaid Cut Places States in Budget Bind
The Medicaid provision ... was considered such a sure bet by many governors and legislative leaders that they prematurely included the money in their budgeting. ... at least 30 states will have to close larger-than-anticipated shortfalls in the coming fiscal year unless Congress passes a six-month extension of increased federal spending on Medicaid.
...
In California, Gov. Arnold Schwarzenegger’s proposed budget assumed $1.5 billion in increased federal aid for Medicaid. ... In New York, which started its fiscal year on April 1 without a financial plan, Gov. David A. Paterson’s proposed budget included $1.1 billion in unsecured federal financing.
...
“I’m very concerned about the level of federal spending and what it would mean for the long term,” said Gov. Jim Douglas of Vermont, a Republican and chairman of the National Governors Association. “But for the short term, states need this bridge to sustain the safety net of human services programs and education.”
Has the 2nd half slowdown started?
by Calculated Risk on 6/08/2010 01:21:00 PM
I've been forecasting a 2nd half slowdown in GDP growth based on:
1) less Federal stimulus spending in the 2nd half of 2010,
2) the end of the inventory correction,
3) more household saving leading to slower growth in personal consumption expenditures,
4) another downturn in housing (lower prices, less residential investment),
5) slowdown in China and Europe and
6) cutbacks at the state and local level.
Some recent reports - like the disappointing employment report for May, reports of pending home sales collapsing in May (after the expiration of the tax credit), soft retail sales in April, a soft month for rail traffic in May - might suggest the slowdown has already started.
However other recent reports - like the ISM manufacturing and service surveys, Industrial Production and Capacity Utilization in April and U.S. auto sales - suggest decent expansion in Q2.
My guess is GDP growth in Q2 will be close to 3% - sluggish for a recovery, but about the same as Q1. So I don't think the 2nd half slowdown has started yet.
Note on housing: I think the news flow will soon turn negative for housing. Existing home sales will be strong in May and June (reported at close) and house prices will be decent through June (reported with a significant lag), but housing starts, new home sales, and house prices later this summer will probably all turn down. And pending home sales will collapse in May, and existing home sales will follow this summer. I think we will see new lows (but not huge declines) for the repeat sales house price indexes later this year.
BLS: Low Labor Turnover, Job Openings Increase in April
by Calculated Risk on 6/08/2010 10:00:00 AM
From the BLS: Job Openings and Labor Turnover Summary
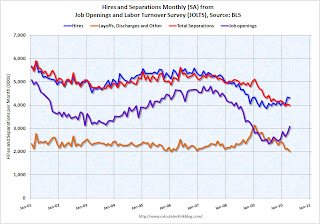
There were 3.1 million job openings on the last business day of April 2010, the U.S. Bureau of Labor Statistics reported today. The job openings rate increased over the month to 2.3 percent. The hires rate (3.3 percent) and the separations rate (3.1 percent) were unchanged.Note: The difference between JOLTS hires and separations is similar to the CES (payroll survey) net jobs headline numbers. The CES (Current Employment Statistics, payroll survey) is for positions, the CPS (Current Population Survey, commonly called the household survey) is for people.
The following graph shows job openings (purple), hires (blue), Total separations (include layoffs, discharges and quits) (red) and Layoff, Discharges and other (yellow) from the JOLTS.
Unfortunately this is a new series and only started in December 2000.
 Click on graph for larger image in new window.
Notice that hires (blue) and separations (red) are pretty close each month. Right now about 4 million people lose their jobs each month, and over 4 million are hired (this is the labor turnover in the economy).
When the hires (blue line) is above total separations (as in April), the economy is adding net jobs, when the blue line is below total separations, the economy is losing net jobs.
According to the JOLTS report, there were 4.304 million hires in April (SA), and 4.000 million total separations, or 304 thousand net jobs gained. The comparable CES report showed a gain of 290 thousand jobs in April (after revision).
Note: Hires include Census 2010 temporary hires.
Layoffs and discharges have declined sharply from early 2009 - and are near a series low - and that is a good sign. And the number of job openings increased sharply in April, although the level is still pretty low.
Job openings and "layoffs and discharges" have been improving, but the overall labor turnover is still low.


